Bitcoin Analysis==>>Descending Scallop Pattern!!!As I expected in the previous post , Bitcoin( BINANCE:BTCUSDT ) again attacked the Heavy Support zone($93,400-$90,000) .
Bitcoin is trying to break the Heavy Support zone($93,400-$90,000) . What do you think? Can Bitcoin finally break the Heavy Support zone($93,400-$90,000) or not!?
According to the theory of Elliott waves , Bitcoin seems to be in the next five downward waves after completing the corrective pattern , and these five waves can break the Heavy Support zone($93,400-$90,000) .
From the point of view of Classic Technical Analysis , it seems that Bitcoin is forming a Descending Scallop Pattern to break the Heavy Support zone($93,400-$90,000) , which can cause the break of this heavy zone .
Looking at the chart of USTD.D% ( CRYPTOCAP:USDT.D ), we can see the Inverse Head and Shoulders Pattern that can cause USTD.D% to increase , which in turn causes Bitcoin and other tokens to decrease .
I expect Bitcoin to soon break the Heavy Support zone($93,400-$90,000) given the above description, and Bitcoin will fall to the Targets I have specified on my chart.
My medium-term view of Bitcoin on the chart I shared with you on January 7, 2025. 👇
⚠️Note: If Bitcoin goes above $94,500, we can expect more Pumps.⚠️.
⚠️Note: There is a possibility that Bitcoin will drop sharply and make a long shadow.⚠️.
🙏Please respect each other's ideas and express them politely if you agree or disagree.🙏
Bitcoin Analyze (BTCUSDT), 1-hour time frame⏰.
🔔Be sure to follow the updated ideas.🔔
Do not forget to put Stop loss for your positions (For every position you want to open).
Please follow your strategy and updates; this is just my Idea, and I will gladly see your ideas in this post.
Please do not forget the ✅' like '✅ button 🙏😊 & Share it with your friends; thanks, and Trade safe.
Btcsignals

Bitcoin is Ready to Attack Heavy Support Zone!!!Today, January 10 , key U.S. employment data , including Average Hourly Earnings , Non-Farm Employment Change, and the Unemployment Rate , were released, influencing global markets, including Bitcoin ( BINANCE:BTCUSDT ).
Stronger-than-expected employment figures suggest a robust economy, potentially leading the Federal Reserve to maintain or increase interest rates. Higher interest rates can strengthen the U.S. dollar ( TVC:DXY ), making Bitcoin and other cryptocurrencies less attractive as alternative investments , possibly exerting downward pressure on their prices.
--------------------------------------------
Bitcoin started to pump from the Heavy Support zone($93,400-$90,000) , as I expected . ( Bitcoin allowed us to enter a long position two times .)
Bitcoin is moving near the Resistance zone($96,800-$95,520) , the upper line of the Ascending Channel , and near the 50_SMA(Daily) .
According to Elliott's wave theory , Bitcoin seems to complete wave C of Zigzag waves(ABC/5-3-5) . At best, wave C could rise to $99,000 (but unlikely).
I expect Bitcoin to go down based on today's US employment data and the fact that the U.S. DoJ received court approval to sell 69,370 BTCs . Bitcoin will attack the Heavy Support zone($93,400-$90,000) again soon, and this attack may be able to break this zone .
⚠️Note: If Bitcoin goes above $99,000, we can expect more Pumps.⚠️.
⚠️Note: We should expect more dumps if Bitcoin touches $93,500 before reaching the Resistance zone($96,800-$95,520) again⚠️.
🙏Please respect each other's ideas and express them politely if you agree or disagree.🙏
Bitcoin Analyze (BTCUSDT), 15-minute time frame⏰.
🔔Be sure to follow the updated ideas.🔔
Do not forget to put Stop loss for your positions (For every position you want to open).
Please follow your strategy and updates; this is just my Idea, and I will gladly see your ideas in this post.
Please do not forget the ✅' like '✅ button 🙏😊 & Share it with your friends; thanks, and Trade safe.

Bitcoin is Ready to Pump Again==>>Short-term!!!As I expected in the previous post , Bitcoin ( BINANCE:BTCUSDT ) fell to the Heavy Support zone($93,400-$90,000) .
Bitcoin is moving in a Heavy Support zone($93,400-$90,000) near the Support line .
According to the theory of Elliott waves , it seems that Bitcoin has completed the first 5 downward waves , and we can wait for upward corrective waves . Bitcoin has completed two corrective waves in the 15-minute time frame , and we can wait for the next corrective wave .
From the point of view of Classical Technical Analysis , it seems that Bitcoin has formed a Falling Wedge Pattern in the 15-minute time frame , and if Bitcoin breaks the upper line of this pattern, we can confirm this pattern.
I expect Bitcoin to rise to at least $95,170 AFTER breaking the Upper line of the Falling Wedge Pattern .
⚠️Note: If Bitcoin breaks the support line, we can wait for the Heavy Support zone($93,400-$90,000) to break.⚠️.
⚠️Note: In general, if you open a Long position, you can keep it up to the Resistance zone($96,680-$95,520) or Risk-Free your position.⚠️
🙏Please respect each other's ideas and express them politely if you agree or disagree.🙏
Bitcoin Analyze (BTCUSDT), 15-minute time frame⏰.
🔔Be sure to follow the updated ideas.🔔
Do not forget to put Stop loss for your positions (For every position you want to open).
Please follow your strategy and updates; this is just my Idea, and I will gladly see your ideas in this post.
Please do not forget the ✅' like '✅ button 🙏😊 & Share it with your friends; thanks, and Trade safe.

BTC Weekly Advanced Detailed Analysis & Prediction with DataThe chart demonstrates a strong bullish order flow in the 4-hour timeframe, with price consistently respecting Fair Value Gaps (FVGs) and showing a sharp reaction to imbalanced zones. This behavior reflects the active involvement of institutional or "smart money" participants, who are driving the market higher from key demand zones. The recent structural movements highlight a well-defined trend continuation, with the price eyeing significant liquidity levels as the next targets.
The levels of 99,850 and 102,787 stand out as critical liquidity zones for the week. These areas represent potential clusters of stop-loss orders and other liquidity pools that price often gravitates toward during trending markets. When The price approaches these levels, we may see a liquidity grab followed by either continued bullish movement or a short-term reversal. The bullish bias remains intact, reinforced by a solid rejection and reversal seen at the 92,279 level, where smart money activity was most evident. This region not only acted as a turning point but also established itself as a major structural support.
Given the Monday session dynamics, a minor retracement is expected as traders take profits or the market rebalances slightly. However, any pullback is likely to respect local Fair Value Gaps or untested order blocks within the 96,000–98,000 range. Such pullbacks would provide opportunities for bulls to re-enter the market, aligning with the broader trend. With clear higher highs and higher lows, signaling sustained bullish momentum unless a breakdown below 96,000 occurs, which would challenge this narrative.
When the price edges closer to the 99,850 liquidity zone, market participants should watch for signs of momentum continuation or exhaustion. Increasing volume alongside upward price action will confirm the strength of the trend, while divergence in volume could signal potential weakening. Similarly, the 102,787 level represents an upper target that may prompt profit-taking or consolidation before further directional clarity emerges.
The 92,279 level, where the smart money reversal occurred, continues to be a pivotal support zone. If the price sees a deeper retracement, this level is expected to act as a strong demand area due to its significance in shifting market sentiment. Traders should also monitor minor untested order blocks that price may respect intraday, providing opportunities for strategic entries or short-term trades.
The market is navigating a bullish environment, driven by institutional demand and liquidity-seeking behavior. The immediate focus lies on the liquidity zones at 99,850 and 102,787, with pullbacks offering opportunities to align with the prevailing trend. However, a sustained breakdown below 96,000 would warrant caution as it could signal a potential shift in the current bullish structure. This week's price action is poised to deliver significant insights into the strength and continuation of the ongoing momentum.

Bitcoin is Ready to Fall Below $90,000!!!Reasons!!!As I expected in the last few posts, Bitcoin ( BINANCE:BTCUSDT ) seems to have started a major correction .
Please be with me.
First, let's take a look at the weekly chart analysis that I shared with you on November 12, 2024 , which almost gave you an All-Time High(ATH) in both time and price .
Let's examine the Bitcoin chart on the 4-hour time frame in terms of Classic Technical Analysis . Bitcoin seems to be forming the right shoulder of the Head and Shoulders Pattern . So that in terms of the validity of this pattern , the following two points can be pointed out:
1- During the time when the right shoulder reached $104,000, it was 8 days and 4 hours that the right shoulder was not able to reach $104,000 during this period, and this shows the weakness of buyers or the strength of sellers along the path of the right shoulder.
2- Regular Divergence(RD-) between the right and left shoulders between the price and the volume indicator.
In terms of Elliott wave theory , Bitcoin, over the past 18 days , seems to be forming an Expanding Flat(ABC/3-3-5) corrective pattern, with the main wave C ending at $102,725 . ( I mentioned this in the update of yesterday's post ).
If we look at the chart of USDT.D% ( CRYPTOCAP:USDT.D ), as I said in the update of yesterday's post , we should have waited for the increase of USDT.D% (due to the sensitive position it was in). I expect USDT.D% to attack the upper line of the descending channel soon .
I expect Bitcoin to attack the Heavy Support zone($93,400-$90,000) and the neckline of the Head and Shoulders Pattern soon, and if it breaks, we should expect Bitcoin to drop to the Potential Reversal Zone(PRZ) , Support line s and 100_SMA(Daily) and then Bitcoin can fill the CME Gap($80,670-$77,100) .
🙏Please respect each other's ideas and express them politely if you agree or disagree.🙏
Bitcoin Analyze (BTCUSDT), 4-hour time frame⏰.
🔔Be sure to follow the updated ideas.🔔
Do not forget to put Stop loss for your positions (For every position you want to open).
Please follow your strategy and updates; this is just my Idea, and I will gladly see your ideas in this post.
Please do not forget the ✅' like '✅ button 🙏😊 & Share it with your friends; thanks, and Trade safe.

BTCUSD IS READY TO FLY MUST READ THE CAPTIONThis chart represents the Bitcoin (BTC) price movement against the US Dollar (USD) on a 1-hour timeframe. Here's a breakdown:
1. Trend Analysis:
The chart initially shows an ascending channel marked by green and gray lines, where Bitcoin's price moves upward.
After reaching a peak, there is a sharp bearish correction, as indicated by the steep downward movement.
2. Key Levels:
Stop Loss: Marked below the current price near 93,192, this is the level where traders would close their position to limit losses.
Target Zone: Two key target levels are marked for potential price increases:
98,067 (first target level)
100,597 (second target level)
3. Trading Plan:
A reversal scenario is depicted with upward yellow arrows, suggesting a potential recovery or bullish bounce from the current price.
Green arrows highlight areas of potential buying interest or price support.
4. Indicators:
Heikin Ashi candles are used to smooth out price movements, making trends clearer.
Red and green markers indicate resistance (red arrows) and support (green arrows) areas.
The trader's strategy appears to involve entering a buy position at the current level, with the stop loss in place to manage risk and targeting higher levels near 98,067 and 100,597 for profit.

BITCOIN can continue upward new record in this month Bitcoin's bullish momentum shows strong potential to continue, with market analysts suggesting that it may push towards a new all-time high within this month. If the upward trend holds steady, we could see record-breaking levels by January 20th, driven by increasing investor confidence and market dynamics.

Bitcoin Analysis==>>Last Chance!!!Bitcoin ( BINANCE:BTCUSDT ) is moving in the Resistance zone($100,000-$98,000) and near the Resistance lines .
Regarding Elliott's wave theory , I still see the waves as corrective . It is likely that Bitcoin is completing a Double Three Correction(WXY) so that it is currently completing a wave Y .
Also, we can see the Regular Divergence(RD-) between Consecutive Peaks ( between volume and price ).
In addition, USDT.D% ( CRYPTOCAP:USDT.D ) is moving near the Support zone and the lower line of the descending channel , so we can expect an increase in this index in the coming hours, and the increase in USDT.D% can cause Bitcoin to decrease .
I expect Bitcoin to start falling from the Resistance zone($100,000-$98,000) , Cumulative Short Liquidation Leverage , and Resistance lines again. The First Target can be the Support zone($96,680-$95,500) . If Bitcoin breaks the Support zone($96,680-$95,500), we can expect the CME Gap($94,830-$94,420) to be filled.
Cumulative Short Liquidation Leverage: $100,000-$99,000
Cumulative Long Liquidation Leverage: $96,000-$95,000
⚠️Note: If Bitcoin breaks the Resistance lines and Resistance zone($100,000-$98,000), we can hope for a further increase in Bitcoin.⚠️
🙏Please respect each other's ideas and express them politely if you agree or disagree.🙏
Bitcoin Analyze (BTCUSDT), 1-hour time frame⏰.
🔔Be sure to follow the updated ideas.🔔
Do not forget to put Stop loss for your positions (For every position you want to open).
Please follow your strategy and updates; this is just my Idea, and I will gladly see your ideas in this post.
Please do not forget the ✅' like '✅ button 🙏😊 & Share it with your friends; thanks, and Trade safe.

Will Bitcoin Break the Heavy Support Zone!? Happy New Year 2025 ! May this year bring you health , happiness , and financial success 🎉.
Let's make it a year of growth and prosperity together !
First, let's take a look at the reasons for Bitcoin's decline these days :
1 - Profit-Taking : Long-term investors are selling after 2024's gains.
2 - Federal Reserve Policy : Slower rate cuts in 2025 have dampened optimism .
3 - Macroeconomic Concerns : Inflation risks and high-interest rates affect sentiment.
4 - Institutional Activity : Reduced MicroStrategy purchases and Bitcoin ETF outflows show declining institutional interest.
--------------------------------------------------------------------
Now, let's take a look at the Bitcoin ( BINANCE:BTCUSDT ) chart from the point of view of Technical Analysis :
Bitcoin is currently moving in a Heavy Support zone($95,000-$90,870) and is trying to break this zone. Also, the most important Resistance for Bitcoin , in my opinion, right now is the 50_SMA(Daily) and in the next step $98,100 .
In addition, with the closing of the monthly candle , we can also see the Shooting Star Candlestick Reversal Pattern .
After breaking the Uptrend lines , I expect Bitcoin to fall at least to the width of the Ascending Channel(broken) and Potential Reversal Zone(PRZ) .
Cumulative Short Liquidation Leverage : $97,686-$96,380
Cumulative Long Liquidation Leverage : $91,446-$90,000
⚠️Note: If Bitcoin breaks the Resistance lines and Resistance zone($96,620-$95,500), we can hope for a further increase in Bitcoin.⚠️
🙏Please respect each other's ideas and express them politely if you agree or disagree.🙏
Bitcoin Analyze (BTCUSDT), 1-hour time frame⏰.
🔔Be sure to follow the updated ideas.🔔
Do not forget to put Stop loss for your positions (For every position you want to open).
Please follow your strategy and updates; this is just my Idea, and I will gladly see your ideas in this post.
Please do not forget the ✅' like '✅ button 🙏😊 & Share it with your friends; thanks, and Trade safe.

$BTC in 2025!CRYPTOCAP:BTC #BTC Modest entry to the new year 2025! $95,878 resistance testing as I write this post, Previous 4H close with good follow thru on Bullish engulfing, Needs to regain support over $99,361-$100,334 resistance area to get back above $103,093. latest ATH at $108,388. $94,148 current support area, $91,357 key support area.

BTC SHORT TP:88,000 20-12-2024I am looking to open a short position in BTC, with a target set below 88,000. Entry points are available both now and below 101,000. It is essential to set stop losses above 103,200 to safeguard the investment. This movement is expected to unfold within a timeframe of 4 to 8 days. As the trade progresses, I will provide updates, so to stay informed, I invite you to activate notifications and follow me. #Bitcoin #Trade

Bitcoin is Ready to Fall by Flag Pattern!!!Bitcoin ( BINANCE:BTCUSDT ) managed to break the 50_SMA(Daily) in the past days, and this could be a sign for a further fall of Bitcoin .
Bitcoin is currently moving in a Heavy Support zone($95,000-$90,870) and is breaking the Support lines .
In terms of Classic Technical Analysis , the Bearish Flag Pattern can cause Bitcoin to fall further.
I expect Bitcoin to drop towards $91,000 minimum after breaking the Support line and a possible pullback, and if the Heavy Support zone($95,000-$90,870) is broken, we should expect more dumps .
⚠️Note: If Bitcoin breaks the Resistance lines, we can hope for a further increase in Bitcoin.⚠️
🙏Please respect each other's ideas and express them politely if you agree or disagree.🙏
Bitcoin Analyze (BTCUSDT), 15-minute time frame⏰.
🔔Be sure to follow the updated ideas.🔔
Do not forget to put Stop loss for your positions (For every position you want to open).
Please follow your strategy and updates; this is just my Idea, and I will gladly see your ideas in this post.
Please do not forget the ✅' like '✅ button 🙏😊 & Share it with your friends; thanks, and Trade safe.

Bitcoin: The Cyclic Pattern Unfolding Again?Analyzing the current BTC weekly chart reveals striking similarities to the past, specifically the cycle seen at the end of 2023 and the beginning of 2024. Let’s break it down step by step.
1. Price Movement Comparison
Late 2023 vs. Late 2024: At the end of 2023, Bitcoin experienced a sharp rally of around 65%, moving from the lows to a significant peak. Fast forward to late 2024, and we see a nearly identical pattern—again, approximately 65% growth from the bottom to the recent high. The symmetry is hard to ignore.
2. WaveFlow Indicator
On both occasions, the WaveFlow indicator paints an eerily similar picture. It shows a strong push from the lows to the highs, followed by an expected pullback before another rally. If history repeats itself, the current setup implies that BTC will form a second peak following an intermediate bottom in the near term.
3. PrimeMomentum Long-Term Signal
The red diamond signal from the PrimeMomentum Long-Term Signal BTC indicator appears in a nearly identical spot:
The beginning of 2024: Red diamond signaled a top before a significant correction.
Late 2024: The same signal has just appeared, aligning with a possible cyclical correction phase.
4. PrimeMomentum Oscillator
At the bottom of the chart, the PrimeMomentum oscillator shows behavior that mirrors the end of 2023. This resemblance reinforces the idea that Bitcoin’s price action is following a cyclic pattern.
5. Expectations and Forecast
January Correction: Based on these indicators and historical patterns, we anticipate a pullback at the beginning of January 2025, targeting a mid-range consolidation or support zone.
February–March Rally: Following the correction in the second half of January, a rally is expected, peaking around March 2025, similar to early 2024’s price action.
Post-March Decline: After March, we could see another downward phase, mirroring the price behavior in mid-2024.
Conclusion: The Power of Cyclicality
This chart showcases the undeniable rhythm of Bitcoin’s cyclicality. Indicators like WaveFlow and PrimeMomentum provide clear parallels between the current market state and historical movements. If the cycle repeats as expected:
Short-Term: Prepare for a correction.
Mid-Term: Watch for a strong rally.
Long-Term: Plan for another cyclical downturn.
The data strongly suggests that Bitcoin’s market structure continues to adhere to predictable cyclical trends. With this knowledge, traders can better anticipate key market movements and position themselves accordingly.

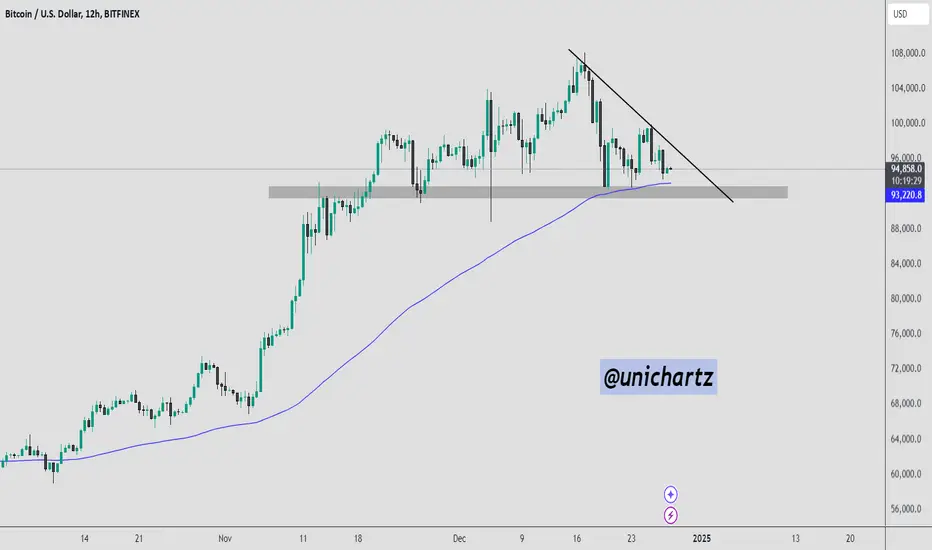
Bitcoin Battles Between Key Support and Resistance – What’s NextBitcoin is currently trading near $94,500, resting on a strong confluence of support. The price is testing the 100 EMA on the 12-hour chart, which aligns with a critical horizontal support zone around $93,000. At the same time, a descending trendline is acting as resistance, keeping the price under pressure.
A breakdown below the marked support zone could trigger a sharp decline toward the next significant level around $88,000. On the other hand, if BTC holds this support and breaks above the descending trendline, it could signal a bullish reversal, pushing the price back toward $98,000 and potentially higher.
Bitcoin Analysis==>>Bears' Turn for Selling Pressure!!!As I expected , Bitcoin ( BINANCE:BTCUSDT ) rose to the Resistance zone($100,000-$98,130) , the lower line of the ascending channel and 100_EMA(4H TF) .
According to Elliott's wave theory , Bitcoin is completing wave 4 . The structure of wave 4 is Double Three Correction(WXY) .
Also, the Volume of candles that brought Bitcoin up to the Resistance zone($100,000-$98,130) is not significant for me.
I expect Bitcoin to at least fall to the Support zone($95,890-$95,540) . And if the support zone breaks, we can expect another attack on the Support zone($95,000-$90,870) and 50_SMA(Daily) and fill the CME Gap($94,435-$93,935) .
⚠️Note: If Bitcoin goes above $100,000, we should expect more PUMPS.⚠️
🙏Please respect each other's ideas and express them politely if you agree or disagree.🙏
Bitcoin Analyze (BTCUSDT), 1-hour time frame⏰.
🔔Be sure to follow the updated ideas.🔔
Do not forget to put Stop loss for your positions (For every position you want to open).
Please follow your strategy and updates; this is just my Idea, and I will gladly see your ideas in this post.
Please do not forget the ✅' like '✅ button 🙏😊 & Share it with your friends; thanks, and Trade safe.

BTCUSDT Near Strong Trendline Support!BITSTAMP:BTCUSD Techncial analssyso update
BTC price is currently trading at the 200 EMA level, which will act as strong support on the 4-hour chart. Additionally, the price is approaching the trend support line, which is considered a key support level for BTC. The volume profile also indicates significant support in the $ 94K-$96K range. A strong bounce from this level can be expected
Regards
Hexa

Bitcoin Roadmap==>>Short-termWith the start of the new week and the good news that came during the weekend , Bitcoin ( BINANCE:BTCUSDT ) began to pump again and successfully created a new All-Time High(ATH) .
Bitcoin has already managed to break the Resistance zone($104,280-$103,340) .
According to Elliott's wave theory , Bitcoin seems to be completed wave 4 ; we should wait for Bitcoin to rise again . The structure of wave 4 is of the Double Three Correction type(WXY) . Bitcoin is currently completing wave 5 .
Also, USDT.D% ( CRYPTOCAP:USDT.D ) managed to break the Support lines and the Support zone(4.00%-3.90%) ( on the chart it is currently the Resistance zone ) and we have to wait for another attack on the Next Support zone(3.82%-3.77%) . A drop in USDT.D% can make Bitcoin rise .👇
I expect Bitcoin to start rising again after the completion of microwave 4 of wave 5 . Bitcoin's Targets can be :
🎯 $107,320 - $106,967 🎯
🙏Please respect each other's ideas and express them politely if you agree or disagree.🙏
Bitcoin Analyze (BTCUSDT), 15-minute time frame⏰.
🔔Be sure to follow the updated ideas.🔔
Do not forget to put Stop loss for your positions (For every position you want to open).
Please follow your strategy and updates; this is just my Idea, and I will gladly see your ideas in this post.
Please do not forget the ✅' like '✅ button 🙏😊 & Share it with your friends; thanks, and Trade safe.

$BTC Looks bullish and ready for more ATHs - LONGCRYPTOCAP:BTC Bullish engulfing on prev 4H close, $107,461 given resistance in effect, Key support at $103,093, $104,987 support yet to be tested. Looks great on 1D, more ATHs to come, $107,857 latest ATH closed with a wick at given resistance $107,461 and testing.
Prediction : Next key resistance areas could be $110,423, $112,255-$112,893, $114,674, $116,908, $119,756.

Bullish Patterns and Bitcoin: A Roadmap to $125KAs anticipated by many, following Trump’s election, Bitcoin experienced a significant surge. On November 14th, it encountered its first notable correction during this upward momentum.
In early December, Bitcoin crossed the critical 100k milestone for the first time. However, this achievement was followed by a swift pullback.
Since then, dips have consistently been met with strong buying activity, and as of now, the price has stabilized comfortably above this key psychological level.
The price action since mid-November reveals the formation of an ascending channel, a technical pattern that historically suggests a 70% probability of continuation to the upside.
A decisive breakout above 107k could confirm this bullish scenario, with a measured target for the next leg up around 125k if the pattern fulfills its statistical expectation.

Bitcoin will make the New ATH!?Bitcoin ( BINANCE:BTCUSDT ) is moving near the Support zone($99,600-$98,000) and has managed to break the Resistance lines .
Regarding Elliott wave theory , Bitcoin completed a corrective wave as I expected .
I expect Bitcoin to rise to at least Resistance zone($102,280-$101,000) and if the Resistance zone breaks , we can hope for a new All-Time High(ATH) soon .
⚠️Note: if BTC goes below the Support zone($99,600-$98,000), we can expect more dumps. ⚠️
🙏Please respect each other's ideas and express them politely if you agree or disagree.🙏
Bitcoin Analyze (BTCUSDT), 1-hour time frame⏰.
🔔Be sure to follow the updated ideas.🔔
Do not forget to put Stop loss for your positions (For every position you want to open).
Please follow your strategy and updates; this is just my Idea, and I will gladly see your ideas in this post.
Please do not forget the ✅' like '✅ button 🙏😊 & Share it with your friends; thanks, and Trade safe.

BTCUSD - Possible sells?Here is our signal on BTCUSD . Potential short opportunity.
As the price on BTCUSD is moving in a “range” we could take this into our advantage and sell BTCUSD at the top of it. With smaller time-frames such as m15 we can see a clear break of the 100k support zone. We can enter into safe sells and target at around 98k. Our entry is sitting at the break of the support zone at 100296 . Our SL (Stop Loss) is sitting at 101273 while our TP (Take Profit) is sitting at 98276 .
PARAMETERS
- Entry: 100296
- SL: 101273
- TP: 98276
KEY NOTES
- BTCUSD broke the support zone on m15.
- BTCUSD is trading in a range.
- We are at the top of the range.
Happy trading!
FxPocket

Bitcoin Analysis==>>FallingBitcoin ( BINANCE:BTCUSDT ) is breaking the Support zone($99,600-$98,620) and the lower line of the Descending channel .
According to the theory of Elliott waves , Bitcoin was able to complete Double Three Correction(WXY) .
I expect Bitcoin to fal l at least as far as the width of the descending channel(broken) .
⚠️Note: We can expect more pumps if Bitcoin goes over $99,900. ⚠️
🙏Please respect each other's ideas and express them politely if you agree or disagree.🙏
Bitcoin Analyze (BTCUSDT), 1-hour time frame⏰.
🔔Be sure to follow the updated ideas.🔔
Do not forget to put Stop loss for your positions (For every position you want to open).
Please follow your strategy and updates; this is just my Idea, and I will gladly see your ideas in this post.
Please do not forget the ✅' like'✅ button 🙏😊 & Share it with your friends; thanks, and Trade safe.

Is Bitcoin Losing Momentum? Correction to 85K LikelyYesterday, Bitcoin experienced another drop, falling from above 100K and reaching a low of just over 94K, briefly touching the ascending trendline that dates back to the time of Trump’s election.
While the price action since November 5 has been characterized by higher highs and higher lows—usually a sign of bullish momentum—the broader structure appears to signal a potential reversal. This pattern suggests that Bitcoin is struggling to sustain its highs, raising doubts about its ability to maintain upward momentum, at least for now.
Although a new all-time high remains a possibility, I believe it is unlikely that Bitcoin will hold gains above 100K for an extended period. Instead, the more probable scenario involves a correction toward the 85K level.
A critical area to monitor lies between 92,500 and 93,000. A decisive break below this support zone would confirm my bearish outlook and could signal the beginning of a deeper correction.
