Bitcoin reaction to volume, when is the growth?Hello everyone, there is a positive reaction of purchases and also RSI on the key time frames of 12h and 6h, I expect the formation of a bullish divergence soon, the target is $27500 - $28300.
Pullbacks are being actively redeemed, we can see this on the indicator of key volumes.
As you can see, now buyers are defending their approaches to $25400, which is understandable - the level is extremely important, but the local bearish mood will be disabled when it is overcome and consolidated above the $26,600 mark.
The global level for a set of long-term long positions is at the level of 24800.
Btctechnicalanalysis

BTC Price Continues to Lag Hourly Below SMA 50, 100, and 200 Despite recent fluctuations, the BTC price still struggles to break above the Simple Moving Averages (SMA) of 50, 100, and 200 hourly. This persistent struggle raises concerns about the current market conditions and prompts us to consider a cautious approach in the future.
The Significance of Simple Moving Averages:
Before we delve further, let's briefly discuss the significance of the Simple Moving Averages. These technical indicators help us identify trends and potential support or resistance levels in the market. The SMA 50, 100, and 200 are considered crucial indicators, often relied upon by traders to gauge the overall health of an asset's price action.
The Concerning Trend:
As we closely monitor the BTC price movement, it becomes evident that the cryptocurrency is struggling to gain momentum above the SMA 50, 100, and 200 hourly. This indicates a lack of bullish strength and raises concerns about the potential for a sustained upward trend in the short term.
The Importance of Caution:
Given the current market conditions, traders must exercise caution and consider pausing their BTC trading activities until the price demonstrates more favorable conditions. Although the cryptocurrency market is known for its volatility, it is equally important to recognize when the odds may not be in our favor.
Call-to-Action: Pause Any BTC Until Conditions Improve:
Considering the persistent struggle of BTC to break above the SMA 50, 100, and 200 hourly, it is advisable to pause any BTC trading activities until we witness a more favorable market scenario. We can mitigate potential risks by exercising patience, waiting for improved conditions, and making more informed trading decisions.
Conclusion:
As traders, we are responsible for closely analyzing market trends and adapting our strategies accordingly. The current situation, with BTC prices still below the crucial SMA 50, 100, and 200 hourly, raises concerns about the short-term outlook. We can safeguard our investments by pausing any BTC trading activities until conditions improve and potentially take advantage of more favorable market conditions.
Remember, being cautious and patient is better than rushing into uncertain market situations. Let's stay informed and make calculated decisions to ensure the long-term success of our trading endeavors.

BTC Daily chart Review Here is the moment where the Up trendline was broken, and with the look of things, the deep will be massive again from next week, if price losses $26,041 support.

BTC great SHORT OPPORTUNITY and the LOW BEFORE BULL12h time frame
-
Market's short position is too heavy so far
I think we need a huge pump to liquidate them all, then start the last dump in this bear cycle
If go up to 28000 to create a HS, which target will be aligned with the harmonic pattern(18085~18600)
It'd be the first important price that we can try to buy spot before bull
-
Short trading plan
Entry: 27766~28548
TP: 18085~18600
SL: 29830

Bitcoin Trading Alert - BTC below MA 50 and RSI at 50As an avid participant in the cryptocurrency market, I wanted to bring your attention to a recent development in the Bitcoin (BTC) market that requires caution and careful consideration. This idea aims to inform you about the current state of BTC, which has fallen below its 50-day Moving Average (MA) and is accompanied by a Relative Strength Index (RSI) of 50.
In recent trading sessions, Bitcoin has experienced a decline that has pushed its price below the crucial MA 50 level. The MA 50 is widely regarded as a significant indicator of market sentiment and trend direction, as it reflects the average price of an asset over the past 50 days. This breach below the MA 50 suggests a potential shift in the market sentiment towards a bearish outlook.
Furthermore, the RSI, a technical indicator used to measure the strength and speed of price movements, is currently hovering at the 50 level. An RSI of 50 indicates a neutral position where the buying and selling pressures are relatively balanced. However, when combined with BTC's status below the MA 50, it reinforces the need for caution and careful evaluation of market conditions.
Given these circumstances, I encourage you to exercise prudence and hold off on any Bitcoin market orders until further clarity emerges. It is crucial to thoroughly analyze the market dynamics, consider additional indicators, and monitor the price action before making any trading decisions. Remember, patience and a well-informed approach are essential to successful trading.
As the cryptocurrency market is known for its volatility and unpredictability, it is essential to remain vigilant and adapt to changing market conditions. We can mitigate potential risks and make more informed trading decisions by staying informed and exercising caution.
This is a cautious advisory and does not constitute financial advice. It is always recommended to consult with a qualified financial advisor or conduct thorough research before making investment decisions.

Bitcoin history and future1W time frame
-
Every vertical dotted lines stand for halving timing, we call them "a cycle" between two lines.
Every cycles have similar trend, we can mark them with three colors as below.
(1) White range stand for Bull high to Bear second low
(2) Red range stand for Bull high to Bear low
(3) Green range stand for Bear low to Next halving
According to halving in 2012 and 2016, we can expect Bitcoin make a second low (below 20000) in near future, the most possible time range is from August '23 to February '24.
Before the second low coming, Bitcoin will likely reach price over 33000, therefore, be careful of being fomo and get ready with patience to buy spot.

bitcoin ideahello Traders, here is the full analysis for this pair, let me know in the comment section below if you have any questions, the entry will be taken only if all rules of the strategies will be satisfied. I suggest you keep this pair on your watchlist and see if the rules of your strategy are satisfied. Please also refer to the Important Risk Notice linked below.

BTC Bollinger Bands Signal an Impending Big MoveThe BTC Bollinger Bands have tightened significantly, indicating an impending big move shortly. For those unfamiliar, Bollinger Bands are a technical analysis tool used to measure volatility and identify potential price breakouts or reversals. When the bands tighten, it typically suggests that a significant price movement is on the horizon.
Given the current tightness of the Bollinger Bands, it is essential to exercise caution and carefully evaluate your investment strategy. This tightening often precedes a period of increased price volatility, which can lead to substantial gains or losses. Therefore, we should consider pausing any further BTC holdings until we have a clearer picture of the market direction.
While I am not advocating for panic selling or making hasty decisions, it is crucial to be aware of the potential sell pressure that may be underway for BTC. By remaining vigilant and closely monitoring the market, we can position ourselves to make informed choices and capitalize on any favorable opportunities that arise.
Please take some time to assess your current BTC holdings, review your risk tolerance, and consider the potential implications of the upcoming market movement. Additionally, it might be beneficial to consult with a financial advisor or engage in discussions with fellow investors who can provide valuable insights.
Remember, the cryptocurrency market is highly volatile, and it is always wise to approach it cautiously. We can navigate the market's uncertainties and maximize our returns by staying informed and making well-informed decisions.

BTC MARKET 1-2 THE NEXT WEEKBTC long-term trend is still ascending ladder, a downward correction is forecast to 24k-26k.
If you enter a futures contract, just run a short order and hit 33k down to 26k.
Thank you

BTC Moving Average Remains Flatline with RSI Below 60Over the past few weeks, we have witnessed a rather unsettling trend in the BTC market. The moving average, a key indicator used to assess the overall direction of an asset's price, has been alarmingly flatlined. This lack of movement indicates a potential stagnation or absence of significant price momentum.
Furthermore, the relative strength index (RSI), a widely used oscillator that measures the speed and change of price movements, has dropped below the critical level of 60. This drop below 60 suggests the market sentiment has weakened, and BTC may be losing its upward momentum.
Given these indicators, we must cautiously approach the current BTC price action. While the cryptocurrency market is volatile, the prolonged flatline in the moving average and the declining RSI should not be taken lightly. This situation demands carefully evaluating our trading strategies and risk management techniques.
Therefore, I urge you to reassess your positions, review your stop-loss orders, and consider implementing tighter risk management measures. As traders, we are responsible for adapting and responding to changing market conditions, and this moment calls for heightened vigilance.
Please remember that no single indicator can predict the future with absolute certainty. However, considering the current BTC price action with the flatline moving average and the dropping RSI, we can make more informed decisions and navigate the market more cautiously.
Stay informed, stay vigilant, and remain focused on protecting your capital. Together, we can weather these challenging times and emerge stronger.
If you have any questions or need further guidance, please comment away.

BTCUSD Break-Out Retraction SignalWe expect #Bitcoin to take bullish turn after upcoming Inflation Rate announcement.
Our Probability Indicator observing completion of Bearish Reversal pattern on 1D Timeframe and indicates another leg into bullish pattern continuation.


BitcoinBTC is gravitating Towards that Monthly SBI, And I would like it to fill that Objective Before the End of the Week...
(I know what you're thinking about that breaker that i marked)

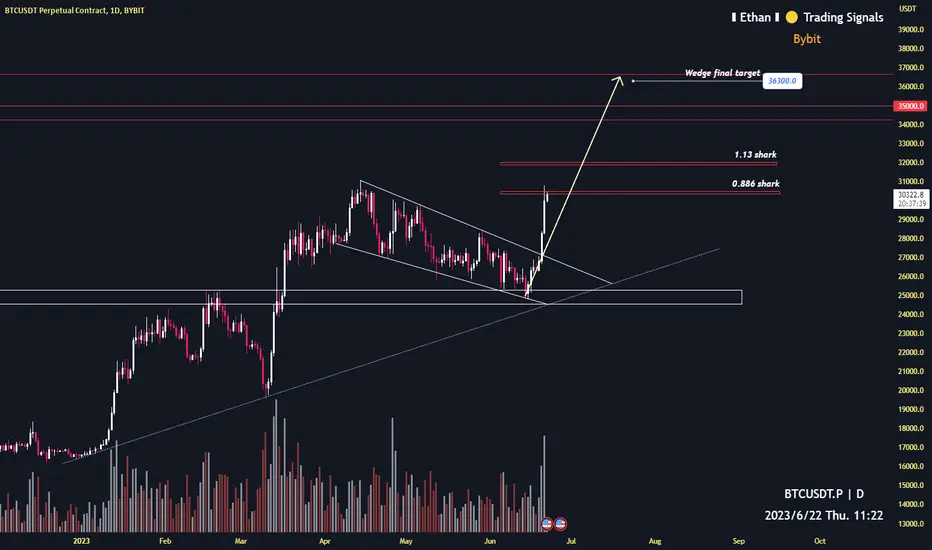
Bitcoin 3 key resistance for short!1D time frame
-
Key resistances: 30500, 32000, 36300
Be careful of any reversal signals at these prices
Stay prepared to open short until this bear really end
BTC Retracement Long Trade (1D TF)
Based on the current trend, we are gradually approaching the midpoint, which seems to present a favorable opportunity for entering a long trade towards the resistance zone. It is worth noting that we haven't witnessed a retest of the midpoint as support yet, indicating potential buying interest in that area. By positioning our entry just below the midpoint, we can potentially avoid any false breakdowns and minimize the risk of stop hunting

Target reached as predicted date (go back 27k before June 20)4h time frame
-
Despite we suffered some big vibration from many news.
We still successfully reached 27k with very exact time prediction as analysis on June 6th.

BTC ready to go back 27k in next 2weeks4h time frame
-
BTC still creating a falling wedge.
With this time structure.
We will see 27000 around June 20th.
Then can judge breakout wedge to 32000 or get rejection again.

BTC.D still building up and 40K target remains.Haven't shared this in a while. This is a 3D Wyckoff BTC.D Accumulation chart. And we have been in the final climax buildup zone for a while, and whenever we go to 3D Breakout resistance line at 49%, we dump and whenever we tap the Buildup Support line at 47%, we pump. So, nothing has changed from this perspective, and we can pump to 40K as per this.
Just to be clear I am not saying we will rally to 40K, it's just I have been tracking this chart since BTC entered the 3D build up zone and 40K is a target I had based on this chart and so far, nothing has changed.
Another interesting thing to note here is the volume divergence, In the chart to the bottom which shows btc price I have highlighted the Volume supported move in yellow lines and volume divergent moves in blue, the previous volume divergent move gave us a bottom at 15K, and we are again seeing the same volume divergence with this dump from 31K.
Again, this does not mean we are about to pump; the volume divergence can continue for a while (Weeks and months) there is no technical limit to it, but we usually see a pump if we see a level hold for a long time with volume divergence.
What is volume divergence?
Volume divergence takes place when we see volume in a downtrend when an asset is trending. So whatever trend the asset is in, up or down we want to see either volume go sideways or up with it , but if we start to see volume go down with a trending move , that's divergent volume , it means less and less people are willing to participate in the current trend which ultimately lead to complete exhaustion of people from the trend and a reversal follows with volume convergence.

BITCOIN 23May2023BTC hasn't shown any significant bullish movement in the last 7 days, looking at the charts that tend to be sideways. The elliot wave notation shows it is still in the wave 2 area, I can't predict how long this correction will last, but when you are an investor, maybe now can be a reference to buy BTC bit by bit


BTC/USDT BinanceBTC/USDT Binance
4H hollow candlesticks
Since mid-March, a sideways movement continues between $25860 and $31000 as an All-Time High (ATH).
In the present phase, a symmetrical triangle has been formed, where a price breakout is expected soon.
The Support area occurs from the extension of the golden ratio of the last Fibonacci retracement.
The Resistance area occurs, if we reverse the golden ratio of extension of the Fibonacci retracement starting from 15/03/2023.
Another conclusion, is that the price is expected to fluctuate within the Descending triangle that has been formed since 06/05/2023, until the price breakout occurs.
Finally, a hypothetical scenario is that the price may follow the slightly resized footprint (Bar Pattern), of a previous price movement (fractal).
Bitcoin (BTC) = $26,928.54 -0.54% (1d)
Market Cap: $1,126,847,982,844
24h Vol: $30,866,809,616
Dominance:
BTC: 46.3%
ETH: 19.4%
Good Luck
#CryptoHellas Team

BTC-24 MONTH PRICE EXPECTATIONSHalving History Performance
A zoomed in view of yesterdays chart. The chart below illustrates the two prior halving cycles fractals 1 year pre & post the halving date.
Whilst past performance is no guarantee of future returns, the chart can help us frame the 24 month period ahead of us and give an idea of reasonable price expectations.
Reasonable Price Expectations
May 2023 - April 2024:
$19,150 to $44,284
(Average $31.7k)
May 2024 - April 2025:
$28,790 to $86,000
(Average $57.4k)

BTC FALL BASED ON GAP AND H&S AND TRENDLINE.The good thing that is happening is that the head and shoulders pattern has been confirmed and the acceptance of the fall of Bitcoin has become accepted in the society and the fall will definitely continue until the trend line.
TP1@25381
TP2@20486
1. H&S CONFIRMED.
2. TRENDLINE CONFIRMED.
3.MARKET READY AND ACCEPT FALLING.
