BTC Pullback on the HorizonBitcoins been running up hot recently but it looks pretty clear we are running out of steam here which is nothing unusual, we are seeing a couple doji candles right now and they lean to the less bullish side of green candles, day isn't over yet though we could see a further decline in todays candle going into close. Remember though pullbacks are necessary and healthy for our overall structure, we have weak support at 44.5k which is pretty unlikely to hold so i figure the 0.3 FIB is a pretty likely target aswell as the next option that is, the 38k level which is longterm and strong, i doubt we would go any further than that. Looking at the MACD too we see that the blue MA is coming down on the orange and we are getting pretty close to a bearish cross, unless we get an unlikely bounce, the histogram aswell is coming down towards the midline and each bar has been getting less and less, looking like we could see a little bit of a red cycle here on the daily MACD. The RSI and Stoch RSI both are overbought and seem to be starting the return to the downside, what is key here for the regular RSI is that we don't drop below that midline and if we do we need to come back up shortly after, this is due to the fact that confirmed movement above this midline is considered in an uptrend and movement below is a considered downtrend, after the past couple months BTC and crypto don't need to go back into a downtrend lol. i personally think this pullback will be a last effort to shake out any weakhands before the return to the bull cycle! Not financial advice just my opinion!
Btctechnicalanalysis

BTC Dominance fall triggered!!Bitcoins dominance is coming down at pretty fast rate and we are passing multiple important supports that we needed to breakthrough, as you can see with my path drawing i hit it pretty accurate with the 1-2-3 move to the downside i just had the timing/timeframe a bit off. We have pushed through multiple supports and we are now passing a very important one which is longer ranging support and aswell as the S1, a breakdown and hold below this level for daily close is key, also as dominance falls we notice altcoins really starting to takeoff with multiple today already putting out %'s in the teens! The bollinger bands looks good in this situation and keep in mind i would like to see dominance fall because we tend to see explosive altseasons follow, our price action is riding the bottom band and if we keep this up we could really see a bigger further fall. We have a very light support at the 43.32% we could see a drop to here but my guess is that we are going to end up at the 41.57% level or the S2, these levels are much stronger and give us a good chance to catch a bounce, also keep in mind that in 2018 the altseason drove BTC's dominance just a bit lower than 35% and if thats the same case for this year we have a big drop still and even more explosions coming from the altcoins! Looking at the MACD we are seeing very bearish separation within the MA's, the blue MA is taking off from the orange pointing towards the ground, the more separation we see the more bearish momentum which in this case is positive for the altcoin market. The histogram is continuing to push out bigger red bars and the bear momentum is becoming greater! Not financial advice just my opinion!

BTC Pullback Coming soon!??Bitcoins pullback may be coming sooner than we thought or atleast i thought, i've thought about it for a bit and came to a likely scenario, if we think about how the major crypto players and whales move markets we could likely assume that we have to be in for a pullback before we takeoff back into our ultra bullish cycle, now a move like this (which is very common) eliminates or shakes out a lot of weak hands and liquidates tons of trade positions, also it really messes with peoples overall emotions when it comes to crypto which is their hard earned money and that can tend to make people make irrational decisions. holding is key remember that. Now to the technical side of things, we are currently right above a weaker support line at almost 44500$ and we are seeing a bearish day and of course bear candle, if this continues and we close off the day with a red candle this gives the bears some momentum, which personally i think will shred right through this support level due to it being weaker. I have a likely path drawn out which might be a bit conservative but we would soon land on the 0.3 FIB level which is a pretty strong support and could definitely hold but again if we think about the bigger players they likely would want more fear for retail investors so we come down to potentially our next level at 38613$ which again is a very strong level that has been around for months now. With the bollinger bands i think if we start to see a pullback the midline of the bb's which act as support will most likely closely line up with the 0.3 FIB, could be wrong but either way i think pullbacks are a blessing especially in times like these, they can provide you with very good entry points. Both the RSI and Stoch RSI are dipping, we are starting to see the blue crossover the orange bearish on the stoch RSI and on both we are in the overbought zones, starting to curl downwards too, definitely think there is something coming and i hope i am right and able to catch it! Not financial advice just my opinion!

Bitcoin Dominance in for a Crash!!?Bitcoins dominance has been pretty stubborn holding this support level at 45.74% but i think in the coming days we are going to see a decent sized drop in BTC dominance, we have wicked below this support level and are slowly coming down trying to push through it, lower dominance will be key for altcoins to really start exploding, same thing for BTC, we saw low dominance levels a couple months ago and we were seeing nice pumps in PA. What i noticed that could be very important is that todays candle/wick has touched down on the bottom band of the BB's, if we can see this continue we will likely be in for a big slip to the downside, now at first this could pullback the market a little bit but afterwards Altcoins especially will begin to rally, If we do see a drop in dominance it will be key to have that midline on the bollinger bands which right now acts as resistance below the support we are stuck on right now, this gives us a second layer of resistance so pumps back above this support are more unlikely. Im hoping if we do take a ride down the bollinger bands it gives us enough power to push through the next support level at 44.6%. The MACD is looking very positive for this prediction, we are a long way away from a bullish cross especially with our MA's seeing bigger separation, the Blue MA is pointing down pretty heavy leaving the orange behind and we are seeing bigger bear momentum on the histogram. Now the WaveTrend also lines up with this prediction we are almost pointing straight down and we are now passing through the mid section where it was the most likely spot for a reversal, we are likely about to see another bearish wave on the histogram here it looks like it is already starting with no sign of slowing down, ALT Season may not be too far away! Not financial advice just my opinion!

BTC to 50K then a pullback!BTC has flipped longer term resistance back into support and we are pushing up towards that 50K level , i think we are going to see a push upto here but it is pretty heavy resistance so i wouldn't be surprised if we saw a bounce that turns into a pullback, as you can see in my drawing i think we are going to touch 50K but then come down to the green support we just flipped, afterwards i think this level will hold and we will go back to attempt to break the 0.2 FIB/50K and i think we will have the momentum to do so, what is key is that we have that restest of 50K and hold it, we cant shoot right through without retesting this level to build up support. Looking at the bollinger bands we are getting back to almost riding the top band which is key for igniting a big run as we have seen in the past, remember too the midline on the BB's acts as support if we are above it and i think when we see that push to 50K that midline support will line up around the green longer term support drew. The MACD still has some gas left as we continue to push upwards with the Blue MA separating slightly from the orange, this is apart of the reason i think we still got room to climb to the 50K level, before then most likely seeing a bearish cross. The Wave trend aswell i think has some gas left in the tank after we just reached the top of the zone, we don't always see an immediate fall after we reach the top, i mean just look at ETH our WT has been in the top zone for like a week now lol. We are still pushing upwards and could see one final push upto 50K before then coming back down on the pullback, resetting our indicators ideally and to get ready for that next run up! Not financial advice just my opinion!

50K Bitcoin coming soon!!?Bitcoin has been continuing to push upwards after having a few day cooloff, we have pushed right through the R1 resistance and what im looking for here is a hold for daily close, this will look super bullish if we can pull it off! Im looking for a push upto the 0.2 FIB level or aprx 50K, i think this level is definitely achievable but the thing will be can we breakthrough this level, we may get rejected the first time but after a couple im sure we can break it. Also we will be faced with the R2 resistance which will be another challenge. Taking a look at the MACD we remain looking bullish, we had a very nice bullish bounce from the blue MA, we are starting to see greater separation which is key, we got to stay away from that bearish cross, Histogram aswell looking good with out bars growing each day rather than flattening out, if we can keep seeing growth in the green bars we should expect some nice upcoming green days. Finally the Hash ribbons which are super important and a very legendary indicator, as you can see we are slowly coming out of the consolidation phase and we could soon be seeing that rare "buy" signal, historically this buy signal was followed with massive gains, and looking at the depth and dragged out consolidation period i woud say my 50K price target is very very conservative. Not financial advice just my opinion!

ALTSEASON ABOUT TO BLOW UP!!?Btc's dominance has been falling recently along with BTC price action and the more we fall lower and lower the more altcoins will start to explode, as we can see today already BTC is down nearly 3.5% and ETH (leader of the alts) is up around 7% or more. Now looking at the path btc dominance is on we are approaching the 45% support level like i drew with my semi accurate path, now im thinking we could see a further bounce here like we are seeing right now but i think a further slide downwards is likely. First of all we are fastly approaching the bottom of the bollinger bands which we have seen many times can easily activate a medium to bigger sized fall in price action but in this case dominance level. we need to get a break below the 45% level which could bring our bollinger band midline resistance below this level which will give us another layer of resistance to hopefully stop dominance from shooting back up. The Wave trend looks very good it seems like we have definitely topped out for now, and we are coming down to the middle of the zone which hopefully we don't see a bounce and just continue heading in the downwards direction. now the RSI is getting somewhat close to the oversold area but we have seen time and time again the RSI staying down there and waiting awhile before recovering, now even more important than that is the fact that we have broken the midline on the RSI and if we can continue to hold below here we will find ourselves in a confirmed downtrend for BTC dominance, which i think is bullish af for altcoins. if we do see a larger crash in BTC dominance its likely that the market will see an initial drop but afterwards altcoins will start to really fly, just like ETH is already doing. Not financial advice just my opinion!

BTC DOMINANCE PASSING A CRUCIAL LEVEL!!Bitcoins dominance level is on the fall once again after i thought we would see it happen a bit earlier but none the less this is positive for the market overall! We have actually passed a very crucial level here that could bring us an overall trend reversal, we have crossed the pivot point and if we can secure a daily close here we have a very good chance of turning to a downtrend which in turn could drag down the market initially but afterwards as dominance gets lower and lower altcoins will start to make some explosive moves. Also looking at the bollinger bands we are headed towards the bottom band which whenever that happens we could see a bigger fall if price action starts to ride the bottom band, very important is if we keep trailing downwards getting that midline on the BB below that pivot point will give us an extra layer of resistance so hopefully we can stay below the pivot point keeping the BTC dominance downtrend going! Now the RSI looking pretty bearish which in BTC dominance terms i see as good, we have crossed through the midline at the 50. point and if we can keep pushing downwards and hold below this line we will be looking at a confirmed downtrend, we have been in an uptrend for a months time now and i feel like we got a good chance of reversing that here and getting back to the bull cycle / altseason! not financial advice just my opinion!

BTC Possible Bull Flag?!!After Bitcoins beautiful runup i talked about the possibility for a cooloff day or a few and i think we might just be seeing that now, also it looks as we could see a bull flag forming which in most cases ends up swinging to the upside after the flag is completed. For this to be true we will need to see wicks or touches on the support and resistances, following a similar channel i have drawn, the top resistance of the flag is more accurate than the bottom support as because we haven't closed out the day yet and we could still see more downside, and thats even if we get a bull flag here. I do think we are going to get a little pullback which is normal after runs like this, i think that because looking at these indicators there isn't another "technical" way to think lmao. So the Wave trend oscillator is looking pretty bearish as we nearly crossed into the sell zone with are wav e now looking like its topped out, we most likely will be heading down here before starting another wave upwards, there are times where we do hover in the top area for a little bit. Looking at the coppock curve we notice the same thing but with this indicator we don't really have any jagged movement, for the most part we see smooth transitions between waves and when we see a top of the zone wave we usually see a "crash" tp the bottom then repeat, and as you can see we do look like we are starting atleast a bit of a comedown, there definitely is a chance both the WT and CC don't bottom out and we find some support maybe halfway through the zones. Now finally the MACD we see still decent separation in the MA's but the blue one is coming down pretty hard towards our orange, we could for sure see a bearish cross coming up soon, or we could see a bounce off like i talked about in the last BTC TA, this is also part of the reason we may not see a bigger pullback because since our blue MA got so far from our orange it allows us to have those few red days without actually getting a bearish cross, same thing for the WT & CC they could both find quick support which would be ideal! Not financial advice just my opinion

MUST BREAK LEVEL FOR BTCBitcoins went on a beautiful run after i predicted we would see 28k before we see 40k and now we are sitting right below a very crucial level for BTC, at some point in the coming days we definitely need to break through this 40-41K level or the 0.3 FIB. A break and hold of this level will turn my sights fully bullish as we have been stuck in a sideways trend from 30K-40K for a couple months now. Looking at the bollinger bands we have took a very big ride up the top of the bands like i talk about a lot of the time, we had enough momentum to reach the 0.3 FIB but seems like we ran out of gas for the time being, i figure we could see a couple cooloff days like we are seeing today or even a single red day before we keep pushing up, remember that we need structure and can't simply go up without creating any supports or getting footing. The MACD looks very bullish with our histogram printing big green bars getting taller and taller on each one and our Blue MA has completely taken off away from the orange which is definitely a positive sign and gives us room to have a couple cool off or bearish days without actually getting a bearish cross. Also what i noticed on the Hash ribbons one of the most powerful and accurate indicators is that we see the capitulation starting to shrink, the ribbon is starting to come back together and at some point when the bottom ribbon crosses the top we should get that legendary buy signal which has led to some serious gains in the past, in recent runs we haven't really ever seen a capitulation period this large before and what im thinking is that we could be in for a absolutely massive run once this is over! Not financial advice just my opinion!

BTC primed for a move to the bullish pivot point!Bitcoins moving up quick after i predicted we would see 28K before we saw a bigger move up to possibly 40K and that just about happened perfectly, we got the bounce a little over the 28K level and we have been pushing up since! Now what i think is likely is we could see a little breather day maybe even a slight red candle but it looks like we are ready to keep moving after that! If we can get a daily close here above the 0.5 FIB level that would be very bullish, we aren't too far away from that pivot point where we can really rebound to the bullish upside. Looking at the bollinger bands you guys might know what i am gonna say lol.. but we are getting super close to grabbing ahold of that top band where we could then really start to go for a ride to the upside, this is where my prediction for a little breather day comes from, if we can settle cool off and find footing above this 0.5 fib level we have a very good chance of getting ahold of that top bollinger band, and thats why i think we are going to climb to that bullish pivot point! Checking out the macd we got a very nice bullish cross where we are now seeing big separation in the MA's the blue is taking off from the orange, which is definitely a positive sign, also gives us some room to have that cooloff day without getting a bearish cross! Think overall the crypto market is starting to heat up again with BTC dominance slowly falling back down we should be back to it in no time! But like i have said before i am more neutral until we cross that 40K mark, than my view is switched to bullish and if we cross below 30k and stay under i would be bearish! Not financial advice just my opinion!

UPCOMING BTC REJECTION!??As i have shared in my previous TA's i expected a drop to the 28K level before then coming back up as shown by my drawing and we we're very close to hitting that exactly! Now taking a look here we got a possible upcoming rejection for BTC, Looking at the bollinger bands we are fast approaching the midline on the bands and this is for the time being resistance and we could possibly see a bit of a bounce off here pushing us a little bit downwards, but i do think we are going to be starting our recovery as we speak. Now also something that correlates perfectly with the bollinger band resistance is the RSI, as you can see we had a longer term uptrend support on the RSI that is now flipped into resistance and this level has proven to be pretty strong, we are a few hairs away from this resistance just like the midline on the bb's and thats why i believe we could definitely see a rejection here for the time being. Now if we do break this uptrend resistance we then face resistance of the actual midline on the RSI, so for the time being i think we are going to see a bounce off to the downside, if i was a betting man i would easily bet on a rejection here. looking at the pivot points we do have a fair ways to go before reaching that pivot line where we could then reverse to the bullish side of things, i have said before a few times, if we are in between 30k and 40k i am neutral, for the reasoning of because we have been in sideways movement between these levels since may and i don't think it would be logical to be bullish or bearish until we either break 40k or we break 30K, the sideways movement is unpredictable and is way to hard to predict exactly where we are headed again until either of these levels are broken! Not financial advice just my opinion!

BTC 28K!!?As i was talking about previously btc has begun a slight pullback out of the bottom of the wedge and we got a bounce today around 30K which has held us up so far, we could still see that 28K level i was talking about before, there is still lots of bearish momentum pushing us down. There is a chance that we start to recover but i wouldn't go that far yet especially without a successful retest of the 30K level we bounced from today. we are still in a very dangerous spot as our candles are riding the bottom of the bollinger bands which almost always gives us some downside, we havent really seen a big drop along the BB's but like i said this pullback could still be going on and waiting will be the only thing that can provide those answers. The RSI has dropped pretty hard aswell with us not even coming back to the uptrend support to retest it. we are getting closer to the oversold area but still have a bit to go, thats another reason i think we could still see some downside which would more than likely push that RSI into the oversold area before then coming back up with price. The Hash ribbons aswell are still extending in this capitulation phase, and for the real bull run to start back up again i personally have to wait for these hash ribbons atleast finish the capitulation cycle but ultimately print that legendary buy signal, at that point i would be fully confident in a btc and full crypto market recovery and ultimately the next leg up in this bull run! Not financial advice just my opinion!

BTC Fall is sparkedBitcoin's broken out of the bottom of our descending triangle and is looking pretty shaky as of right now. looking at the RSI we blew right through the uptrend support and we are now falling towards the bottom of the RSI channel, still a bit away from oversold aswell. Also yesterday we saw a bearish cross on the daily MACD but we aren't seeing much separation in the MA's so that is something to watch. Something that is a little worrying for BTC as of right now is the bollinger bands, we are directly sitting on the bottom band and we definitely see a big dragdown if this continues. I think we are going to see this pullback and i think it is pretty likely that we see a 28K atleast BTC price, from there if thats all that we fall i would say we will see a pretty quick recovery. Not financial advice just my opinion!

BTC 28K before 40K!?Bitcoins following along its sideways path and we are almost at the end of this wedge/ pennant. It does look like we are going to slip out of the bottom of this pattern and i believe a pullback is coming before we have our next leg upwards. I think we are due for a pullback not for the fact that we have been shooting up in price but the technical fact that a lot of indicators are shorter term bearish. We see the EMA ribbons which i have talked about before are fully spread out bearish and is constantly pushing down on us with bearish momentum, and this type of indicator doesn't flip back and forth in the matter of a few days time it usually takes quite awhile like a few weeks or a months time, we gotta start to see the full flip to the bullish side before i could say we are definitely back into a bull market, theres just too much momentum on the bears side right now. Also the bollinger bands have been squeezing pretty hard on our candles and that always tells us that a big move is coming, the problem is it doesnt show any direction, but as we keep pushing closer and closer to that bottom band we risk having a significant fall riding the bottom band. i would say it is likely we see atleast 28K before pushing back up, we have a potential zone we could further fall to and thats 26.5K or the 0.6 FIB level. Finally the MACD is hanging on by a thread for the bulls we are any day or even minute about to see a bearish cross which i think is going to spark this pullback, unless somehow we reverse the MA's and the Blue starts heading back up, which personally i think is highly unlikely. Not financial advice just my opinion!

BTC AT RISK OF PULLBACK!We are quickly approaching the apex point of this wedge/ pennant and BTC is looking a bit shaky right now in my eyes, we got big time rejected off the midline of the bollinger bands and aswell the top of the wedge now cruising towards the bottom of the wedge. What catches my eye the most is that if we breakdown further and out of the bottom of this wedge we will be sitting on the bottom bollinger band which could result in a huge fall with not super strong support to catch us. we would likely fall to 28.5K support but my worries are if that level breaks due to the huge bear momentum from the bottom bb we could see a bigger fall all the way to 26.5K aprx or the 0.6 Fib Level. The Macd has been pretty stagnant over the past couple days and we are almost about to see a potential bearish cross that could jumpstart this pullback, the blue MA is quickly coming up on the orange with both ma's beginning to turn to the downside, aswell the histogram has gotten very weak and is looking like we are going to see some red bars in the next day or two. Now one of my favorite indicators the hash ribbons, this is a very very powerful indicator that rarely prints a buy signal, but when it does huge gains follow, i highly suggest back testing the hash ribbons to see what im talking about, now we have seen 2 periods of capitulation recently with the first round not printing a buy and this round being very extended, if we do see a buy i imagine it will be after a pullback or nearing the end of july. Not financial advice just my opinion!

30K BTC!!Bitcoins continuing on this sideways path but has recently been really sticking to the 0.5 FIB level. We seem to be getting held up here and we are now facing 0.5 FIB resistance and also the midline on the bollinger bands, we are seeing some more squeezing from the bb's and if we keep going this way we could get a big move in either direction. I think we could see some movement soon and i think it'll be to the downside, most likely 30K but even our pivot point at 28K i think either of these levels will provide us with a bounce back up afterwards though. We do have be careful with the bollinger bands though because if we start to slip and start printing candles on that bottom band we could see a fast move downwards maybe even bringing us to the 0.6 FIB level. The MACD aswell i believe is a little overdue for a bearish cross after we have been seeing lots of green on the histogram, we did get a small bearish cross a little bit ago, but didn't last very long and didn't really fall at all. I believe we will see some more bearish or sideways movement until august before resuming our bull cycle, and i look at these times as great accumulation periods. Not financial advice just my opinion!


Very important close for Bitcoin!!!Bitcoin has recently been cruising around the 0.5 FIB above and below and now we are coming up on our monthly close and this is very important. it looks like we are going to see a very close one as we sit almost right on the 0.5 FIB on the daily and monthly. If we do see a close below the 0.5 we could see another bearish sideways month for BTC and crypto. Not 100% convinced even if we close above the 0.5 FIB though, we have lots of indicators that need to flip back fully bullish. The EMA ribbons being just about flipped fully bearish we need to see a start of resistance and ultimately get some bullish momentum going, that also could happen in july if we start to see some bull momentum we could start the longer process of al the indicators working their way back to bullish. Looking at the bollinger bands we aren't really in any danger of slipping more it looks like since we are far away from the bottom band. But we are getting rejected a couple times in a row now by the midline showing we are still trend for the most part downwards. Which brings me to my next point, the RSI rejected off the midline again and we are heading back down, and this might sound like a broken record but we need to get above the 50. point and hold it if we want to be in a confirmed uptrend again. Until then we are considered in a confirmed downtrend. Lastly the MACD we are seeing a recent buy signal but not much action with now our blue MA starting to curl down towards the orange and its looking like we could see a bearish cross soon, unless we bounce off. It's really hard to tell exactly where we are going because of all the sideways movement but i guess we will see another couple weeks to a month of sideways, slight down and up movement while hopefully those important indicators start to recover, especially the 50 day SMA and 200 day SMA, we really need to start seeing a recovery with those as we recently experienced one of the most bearish indicators out there known as the "Death Cross" Not financial advice just my opinion!!


BTC Monthly cooldownLooking at bitcoins monthly chart and the first thing i realized and said to myself is "this could easily be just a cooloff or correction in the macro perspective" and that is exactly what i think. We had an explosive 6 months previous to these 3 and it really does make sense that we need a break or cooldown, and that goes for everything, we need structure/ supports/ floors in order to keep heading up, now if all continues this way we will have a decent looking monthly close for bitcoin. The key here is to definitely stay above the 0.5 FIB level like we managed to do last month and even better would be to close above last months close around 36K. Even if we don't do any of this we could still see another month of bearish momentum which is kind of likely looking at everything from a technical standpoint, but the point is this will be a tiny blip on the macroscale and a much needed cooloff, 6 months of super bullish momentum and im thinking 4 months of cooloff and then we should be back to it. Also this sort of scenario doesn't faze me really, i actually like it for the fact that i can buy more crypto at discounted prices. If you truly believe in blockchain and crypto as beneficial for the future you shouldn't worry and do not let the emotions cause you to make poor decisions, this whole space may feel like we are late but in fact we are super early imo, big companies and institutions only started buying last year and even looking at that is a very very small number of "big money" compared to what can come, countries are starting to adopt crypto and that in itself should say something! Not financial advice just my opinion

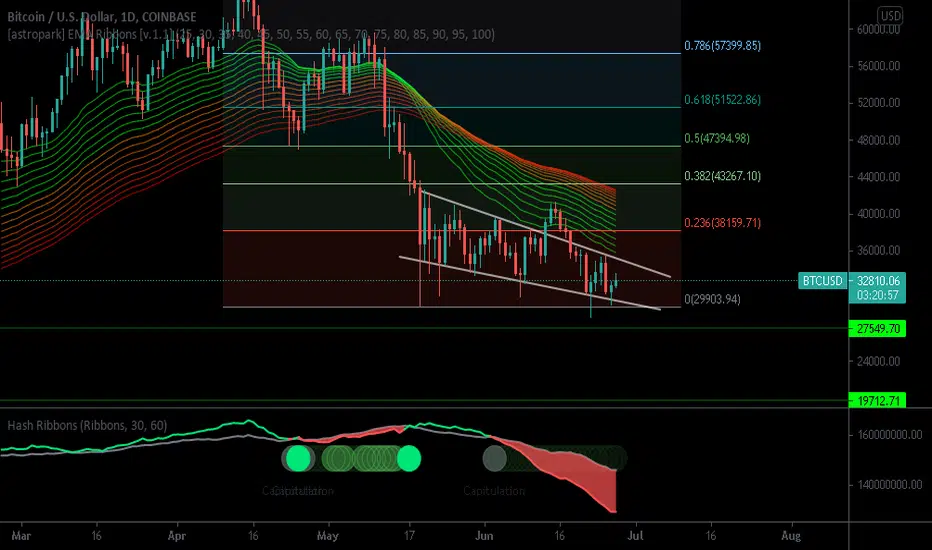
BTC going for 34K again!Bitcoins rallied the past couple days after touching off of the 0 FIB Level or 29K, as we notice we have been in sort of a slight descending channel or wedge and we have been moving sideways pretty accurately in this wedge. We definitely got a bit of room to run here potentially to the top of the wedge or aprx 34-35K. we could see a blast through but that would be kind of unlikely due to our current mini bear market or strong bear trend. One negative indicator i have been talking about recently is the EMA Ribbons we are starting to see the ribbons fully spreading out more and more bearish. the longer this goes on the longer the bear momentum will stay. Ideally we would like to see the ribbons start to compress again and start the whole process of turning back bullish, i say this because it doesn't happen overnight and can be a longer time frame switch. One of the best indicators for BTC in my opinion the.. Hash Ribbons, these don't print very often at all but when they do they do not lie, you can see this by backtesting yourself. right now we are in capitulation like we were recently and we are now looking for that "BUY" signal, we didn't get the signal last time obviously because the market wasn't ready but now this is a top inidacator that i am watching, usually after getting a buy signal we see huge bullish explosions over a longer TF not in a day, but for example a weeks or two weeks time. Not financial advice just my opinion!