BTC/USD Potential Reversal & Bullish Breakout SetupBTC/USD Potential Reversal & Bullish Breakout Setup 🔄🚀
Technical Analysis Overview:
🔹 Pattern Formation:
The chart displays a potential Triple Bottom pattern (🟠), a classic reversal signal forming at the $104,870–$100,000 support zone 🛡️. This structure suggests a strong base is being established for a potential upside move.
🔹 Support Zone:
📉 The price has consistently bounced off the major support area around $100,000–$104,870, indicating strong buying interest.
🔹 Resistance Zone:
📊 The key resistance level lies around the $114,000–$115,000 range 🔵, which has been tested multiple times in the past (🔴 arrows) and could act as a future profit target.
🔹 Price Action & Projection:
Currently, price is trading near $107,025 and is showing signs of bullish continuation after forming a higher low. If the price consolidates above the $104,870 zone and holds support, we could see a potential breakout targeting the $114,000 resistance 📈.
📌 Key Takeaways:
✅ Triple Bottom formation signals trend reversal.
🔄 Bullish structure confirmed above $104,870.
🎯 Next target: $114,000 if breakout holds.
⚠️ Watch for potential consolidation before continuation.
Btctechnicalanalysis

BTC 4H – Critical Support Zones Being TestedCRYPTOCAP:BTC is currently retesting its $107.2k support, which has now turned into resistance after a decisive breakdown.
Support Levels to Watch:
- Upper Support Zone: $105k – $104.4k
- Lower Support Zone: $101.4k – $100.7k
Bounce from $104.4k–$105k will be a temporary relief, but it needs strength to reclaim $107.2k.
If the upper zone is not held, the next leg will be towards the lower zone, near $101.4k—$100.7k.
Breakout confirmation only above $110k (previous rejection zone).
The market is showing signs of weakness, especially with increased selling around resistance. Avoid rushing into trades—better setups may come if key zones hold or break.
Tip: Watch for bullish divergences or strong volume at the lower support for potential reversal setups.

BITCOIN ROAD TO 300K !!! ELLIOTT WAVE CASE STUDYThere are three possible cases for Bitcoin which we can now consider according to Elliot wave count on big picture:
Case I: According to this count if we hold above 74.5k , recent low, we may see major shift in BTC. Retracement Up to 92-79k is good which will form inverse head & shoulders, potentially breaking ATH up to 170K, if things goes well & 74.5K region remains on hold.
Case II: If in case 74.5K region breaks, then it will invalidate minor count causing BTC to retrace more up to 64-52K major reversal zone region. If such thing happens, bullish shark pattern will be formed causing major reversal from that region BUT 49K region should remained hold!!!
Case III: Worst case scenario if 49K region breaks, then it will cause major count invalidation dropping BTC further up to 45-33K region.

#BTC/USD Close Fight but bulls win! $117K Still in sight!CRYPTOCAP:BTC Weekly Update:
BTC closed the week up by just 0.08%, leaving behind a long wick and a tiny body, forming a Dragonfly Doji, one of the strongest candlestick patterns, signalling a fierce battle between bulls and bears.
✅ This time, the bulls won by a small margin, but a win is a win.
✅ BTC successfully held its key support.
✅ The CC is green, which is a positive sign.
The price action remains choppy, but the trend is still pushing upward from here.
Invalidation:- Weekly Close below $100k
What do you think?
Do let me know in the comments section. And please hit the like button.
Thank you
#PEACE

Will BTCUSD see $90,000 ever again? Phoenix FX mid term analysisBTCUSD 4-Hour Outlook: The Week Ahead
🔴 Key Resistance Zones
First Resistance
$107 000–$108 500
Recent swing highs where price stalled before the last leg down. Clearing and closing above $105 000 on the 4H would open the door toward this zone.
Final Resistance
$111 000–$113 000 (If broken expect a run to $115,000)
The all-time-high area. Heavy sell-side liquidity lives here and past price action shows repeated FVG fills and wicks into this region.
🔵 Critical Support & Buy Zones
Discount Buy Zone:
$92 000–$89 000 (50% at $89 150)
A deeper weekly FVG and longer-term trend support. The ultimate “buy the dip” area if the premium zone gives way.
Premium Buy Zone:
$100 000 – $99 000 (50% at $99 450)
A 4H Fair Value Gap that aligns with our higher-timeframe trend support. The recent bounce here signals strength—and a possible launchpad back into resistance.
📊 Weekly Price Action Scenarios
Bullish Theory:
If BTC can close cleanly above $105 000 on the 4H, look for a run into $107 000–$108 500 (First Resistance). A follow-through push could then target $111 000–$113 000 (Final Resistance) by week’s end with a potential further move to $115 000 where the 8 year trend will be tested again.
Bearish Theory:
Failure to reclaim $105 000, or a clear rejection in the $107 000–$108 500 zone, could usher in a retest of the Premium Buy Zone (~$100 000). A break below $99 000 would shift focus toward the Discount Buy Zone around $92 000–$89 000.
💡 Trade Ideas for the Week
Potential Long Ideas
Entry: 4H candle close above $105 000
Targets: First take-profit at $108 500; stretch target $112 000–$113 000
Stop-Loss: Below $103 000
Zone Re-Entry Long
Entry: Bullish 4H candle close in $100 000–$99 000
Targets: $107 000 then $112 000
Stop-Loss: Below $97 500
Potential Short Ideas
Entry: Bearish price action (e.g., engulfing candle or wick rejection) in $107 000–$108 500
Targets: $100 000→$92 000
Stop-Loss: Above $109 000
Just a Heads-Up:
This is my take on the charts—not gospel, not financial advice, and definitely not a crystal ball 🔮.
Trading is part skill, part patience, and part “what just happened?” 😅
We all see things a little differently, and that’s the beauty of it.
So if you’ve got a hot take, wild theory, or just want to drop some chart wisdom—hit the comments!
Let’s grow, learn, and laugh through the madness together. 🚀📈
Each one, teach one.
— Phoenix FX Team 🔥🦅

Bitcoin Prediction - WARNING - Short Set-up Looming? We are spectating something serious on Bitcoin looming right now! Confirmations explained in the video!

BTCUSDT Price Analysis – Potential Drop Incoming! 🔲 Chart Zones
🟥 Resistance Zone (~111,000–112,000):
Price has touched this zone multiple times and failed to break higher – this is a strong resistance area. 🚫📈
🟪 Support Zone (~101,000–102,000):
A historically strong demand area where price previously bounced up. 💪📉
🔍 Current Price Behavior
📊 Price Level: Around 108,666.66
🔄 The chart shows lower highs forming, indicating weakening bullish momentum.
📉 Bearish projection drawn (blue zigzag line) suggests a potential double top forming below resistance.
📉 What’s Expected?
🔵 Big Drop Alert! ⬇️
If the price fails to break above and gets rejected again, the chart predicts a sharp move down toward the support zone.
🎯 Target Area: ~101,000–102,000 (Support zone)
📌 Summary
🧱 Resistance holding strong
💤 Momentum slowing down
⚠️ Bearish move likely
🏹 Targeting support zone for potential bounce
⚠️ Trading Tip 🧠
Watch for confirmation before entering trades! A break below the recent lows could trigger a short opportunity, while a bounce near support could offer a buy setup. 🛑📈

|Trifecta| The Ultra Idea : d-MR96nBa's Ultimate Market Journal | Trifecta |🌌The Ultra Idea : d-MR96nBa's🌠Ultimate Market Journal🎨
*Third times a charm. This Idea will allow me to update my Journal*
Hello Fellow Travelers
It's been some time since I've posted a Fresh Idea, though I've remained actively trading.
What better way to mark my TradView return, than to start an Ultimate Market Journal.
Financial Markets have taken my deep interest again recently, especially as we seem to be at a time of accelerating change and shifting regimes.
I believe many opportunities abound to those with open, flexible and creative minds.
A bit more about myself.
I've been involved with financial markets in one form or fashion for 18 years now.
I started out like most of us, approaching the game with fundamental analysis, only to later incorporate and then fully graduate to T/A.
I'm a natural Contrarian.
My brand of technical analysis is as much about aesthetics, creative expression, discovering hidden truths and applying Universal Principles as it is running the numbers.
I'm starting this off with Ultra Bond Futures, as UB's are the trading instrument I've come to specialise in, having had the most ongoing consistent success trading.
This by no means is going to be a "I bought here and sold there" type of Journal, as that's not my style.
Nor am I going to focus on a single market instrument, observation or style of analysis.
I'd like this to become a repository of accumulated wisdom and unique market perceptives.
I've just begun contemplating what this may evolve into in time, and I invite you to join me in taking this Leap
d-MR96nBa🌌
Concept
Inversion📈📉
Seek out and analyse whatever moves exactly inverse to what you intend to trade.
If you're having trouble discerning trend or observing price patterns, check the inverse.
This can be an excellent technique for exposing Bias.
This can work particularly well for currency traders, though can be Universally applied.
For US Ultra Bonds, the inverse is the US 30 Year Yield
Ultra Bond Futures
US 30 Year Yield
TLT
TBT
SPY
SH
QQQ
PSQ
Currency traders, say you're about to trade AUD/CHF
Check out the CHF/AUD chart first, if they both appear Bullish or Bearish, you've got a Bias.
AUD/CHF
CHF/AUD
GBP/JPY
JPY/GBP
EUR/USD
USD/EUR
Are there any examples of Inversion in Trading you'd like to share ?
What else is on my🧠
Well just casually, I believe we're currently witnessing Peak Bitcoin in it's Entire Life-cycle.
This is coming from a guy who previously recommend people buy BTC for retirement
Have we Bull Trapped & Breakaway Gapped on Berkshire Hathaway
Could Warrens Retirement mark the end of the Great US Bull Market
BRK.B
It's in the Detail
🔑

Bitcoin's Breakout Fizzles: Is a Major Reversal in Play...?Bitcoin Technical Analysis – In-Depth Breakdown
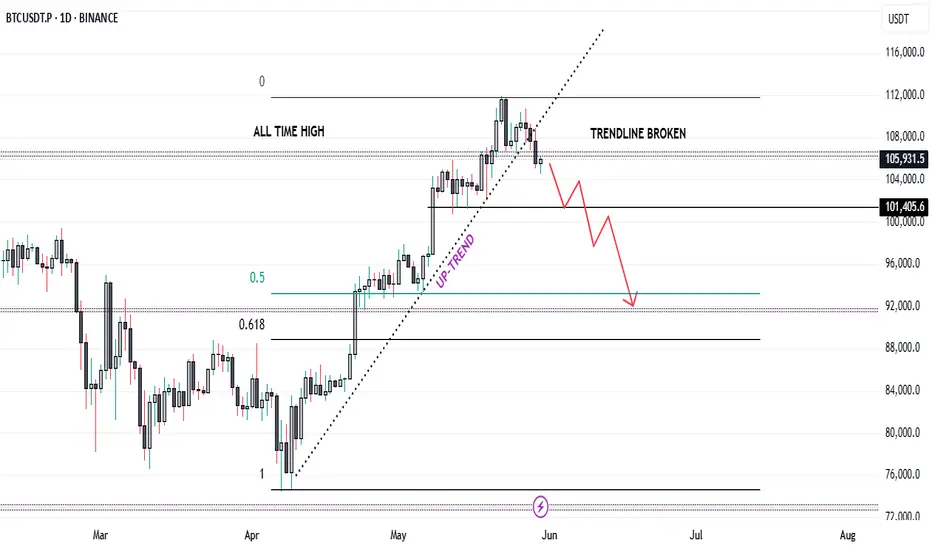
Over the past two months, Bitcoin has exhibited a strong bullish trend, appreciating by approximately 51%. The sustained rally was primarily driven by bullish momentum, increased investor confidence, and broader market sentiment.
Recently, Bitcoin broke through its all-time high (ATH) of 106,500, surging to a new peak near 112,000. However, this breakout was short-lived as the price failed to sustain above this level, indicating significant profit-taking activity by traders and long-term holders. This inability to hold the ATH region highlights a potential liquidity pocket where sell orders accumulate, resulting in a rejection wick and a subsequent reversal.
From a Technical perspective:
The price has now fallen back below 106,500, turning this key level into a major resistance zone. Historically, once a strong resistance level (like an ATH) is breached and subsequently reclaimed, it often acts as a formidable barrier to upward price movement unless there’s renewed bullish momentum.
Additionally, Bitcoin has broken its ascending trendline (drawn from the lows of the uptrend) and has already retested this trendline from below. The retest was successful in confirming the breakdown, which further strengthens the bearish bias.
The price structure is now forming a potential lower high pattern near the 106,500 resistance. This could signal a shift in market sentiment from bullish continuation to consolidation or correction.
In terms of market psychology, the all-time high region represents a crucial psychological barrier. Traders and investors often exhibit heightened caution near such levels. Many choose to lock in profits due to fear of a double top or a false breakout. This behavior can create increased volatility, especially when combined with institutional and retail order flows.
Trading Strategy and Risk Management
Given the technical breakdown and the psychological factors at play:
✅ A short position can be considered, particularly around the 106,500 resistance, with confirmation from the trendline retest.
✅ However, exercise caution due to the high volatility typically observed near ATH levels. Whipsaws and fakeouts are common as both bulls and bears battle for control.
✅ Avoid high-leverage positions unless you have a strict stop-loss in place. Ideally, place the stop-loss just above the 106,500 - 107,000 zone, where a decisive breakout would invalidate the short setup.
✅ For profit targets, initial supports are seen around 100,000 - 98,000, and a deeper correction could test the 94,000 - 92,000 zone.
✅ Wait for clear confirmation, such as a strong bearish candle on the retest of the resistance, before entering the trade.
The Ultra Idea : d-MR96nBa's Ultimate Market Journal🌌The Ultra Idea : d-MR96nBa's🌠Ultimate Market Journal🎨
Hello Fellow Travelers
It's been some time since I've posted a Fresh Idea, though I've remained actively trading.
What better way to mark my TradView return, than to start an Ultimate Market Journal.
Financial Markets have taken my deep interest again recently, especially as we seem to be at a time of accelerating change and shifting regimes.
I believe many opportunities abound to those with open, flexible and creative minds.
A bit more about myself.
I've been involved with financial markets in one form or fashion for 18 years now.
I started out like most of us, approaching the game with fundamental analysis, only to later incorporate and then fully graduate to T/A.
I'm a natural Contrarian.
My brand of technical analysis is as much about aesthetics, creative expression, discovering hidden truths and applying Universal Principles as it is running the numbers.
I'm starting this off with Ultra Bond Futures, as UB's are the trading instrument I've come to specialise in, having had the most ongoing consistent success trading.
This by no means is going to be a "I bought here and sold there" type of Journal, as that's not my style.
Nor am I going to focus on a single market instrument, observation or style of analysis.
I'd like this to become a repository of accumulated wisdom and unique market perceptives.
I've just begun contemplating what this may evolve into in time, and I invite you to join me in taking this Leap
d-MR96nBa🌌
Concept
Inversion📈📉
Seek out and analyse whatever moves exactly inverse to what you intend to trade.
If you're having trouble discerning trend or observing price patterns, check the inverse.
This can be an excellent technique for exposing Bias.
This can work particularly well for currency traders, though can be Universally applied.
For US Ultra Bonds, the inverse is the US 30 Year Yield
Ultra Bond Futures
US 30 Year Yield
Currency traders, say you're about to trade AUD/CHF
Check out the CHF/AUD chart first, if they both appear Bullish or Bearish, you've got a Bias.
AUD/CHF
CHF/AUD
GBP/JPY
JPY/GBP
EUR/USD
USD/EUR
Are there any examples of Inversion in Trading you'd like to share ?
What else is on my🧠
Well just casually, I believe we're currently witnessing Peak Bitcoin in it's entire Life-cycle.
Have we Bull Trapped & Breakaway Gapped on Berkshire Hathaway
BRK.B
It's in the Detail

BTC in Bullish Channel – Another HH Coming ?Bitcoin continues to respect this ascending channel with clear Higher Highs (HH) and Higher Lows (HL).
Every breakout has followed consolidation and pullback patterns. RSI is neutral a breakout above $110K+ could confirm the next HH.
Watching for a move toward the top of the channel... or a deeper HL retest?
What's your take?

$BTC 4H Outlook – Holding the Trendline or Losing Momentum?Bitcoin just saw a strong rejection from the upper resistance zone (highlighted in red), forming a sharp wick after a quick pump.
✅ Key support has held for now, aligning with both the ascending trendline and moving average — historically zones of strong buyer interest (green circles).
⚠️ What’s next?
A 4H candle close above the resistance zone is crucial for bullish continuation.
Failure to close above = potential fakeout and downside pressure.
Eyes on the next reaction — will we see the same buying volume kick in again from support?
📌 Watch closely – confirmation will shape the next move.

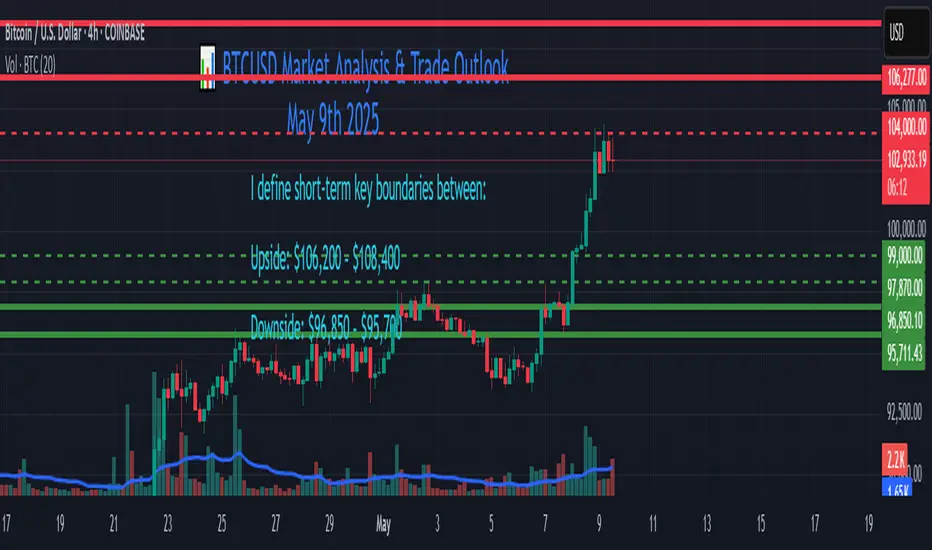
BTCUSD Market Analysis & Trade Outlook (May 9th 2025) 📊 BTCUSD Market Analysis & Trade Outlook (Post $103,500 Target)
Instrument: BTCUSD
Strategy Type: Probabilistic Breakout with Elliott & Gann Confluence
Current Price: $102,600
Trade Horizon: 2–5 Days
Timeframes Observed: 4H / Daily
🔍 Market Overview
BTCUSD has successfully completed the prior trend continuation target of $103,500, respecting the bullish structure on 4H and Daily timeframes.
As of now, price is consolidating just below key resistance, printing a high of $103,800 and retracing slightly to $102,600. This signals a potential decision zone where BTC may either continue its advance or initiate a deeper pullback.
I define short-term key boundaries between:
Upside: $106,200 – $108,400
Downside: $96,850 – $95,700
📐 Technical Structure & Key Zones
Support Zone: $ 97870 , $96,850–$95,700 (Previous consolidation + high volume node)
Resistance Zone: $106,200–$108,400 (Measured move & fib cluster area)
Structure Bias: Bullish above $99,000; bearish pressure increases below $96,850
🔄 Elliott Wave Count (Short-Term, 4H)
BTC appears to be in a Wave (3) of a higher-degree Wave 3, following a Wave (2) retracement toward $94,500.
Current price movement is within a sub-wave 3 of (3), with the recent high at $103,800 potentially marking a sub-wave 3 top.
A brief corrective Wave 4 could develop toward $100,500–$99,000, before a final Wave 5 drives price into the $106,200–$108,400 zone.
If price fails to hold above $96,850, the structure may morph into a larger corrective Wave (4), targeting the lower boundary.
📊 Gann Analysis
The Gann 1/1 angle from the March swing low is currently intersecting near $102,500–$103,000, offering resistance.
Next key Gann levels:
Above: $106,200 (120°) and $108,400 (135°) resistance arcs
Below: $96,850 and $95,700 align with 45° and 60° support angles
Timewise, entering a minor Gann cycle window on May 10–11, often associated with inflection points. Watch for breakout or reversal signals near this period.
🎯 Trade Scenario Outlook
🟢 Bullish Scenario (Breakout)
Trigger: 4H close above $104,000
Target Zones:
TP1: $106,200
TP2: $108,400
Invalidation: 4H close below $99,000 (consider tightening SL)
🔴 Bearish Scenario (Pullback)
Trigger: Break below $99,000, especially on strong volume
Target Zones:
TP1: $97870 or $96,850
TP2: $95,700
Invalidation: Close above $104,000 invalidates pullback thesis
⚙️ Strategic Trade Notes
Scalping & Swinging Options:
Consider range scalps within $102,000–$99,000, but prepare for trend breakout.
Swing traders may build positions on retracement (Wave 4) with invalidation below $97870, $96,850.
Risk Management:
Use volatility-adjusted stop losses under key Gann levels or 50EMA on 4H.
Consider tightening stops or taking partials near $106,200 to protect gains if price extends.
📌 Conclusion
BTCUSD remains in a bullish macro structure but approaches a key inflection zone. A break and hold above $104,000 could launch the next impulsive leg toward $108,400. Conversely, failure to hold above $99,000 opens the door for a deeper retracement to $ 97870, $96,850–$95,700. Traders should remain flexible, aligning with the prevailing momentum while respecting structural boundaries.
BTC-----Sell around 104000, target 102000 areaTechnical analysis of BTC contract on May 16:
Today, the large-cycle daily level closed with a small positive line yesterday, and the K-line pattern was single negative and single positive. The price was still consolidating at a high level. The attached chart indicator was running with a shrinking volume and the fast and slow lines showed signs of a dead cross. But again, the current signal is a retracement correction, not a trend, because at the weekly level, the price is just retracing the moving average, and everyone should be clear about this; the high pressure level is in the 105800 area, and the low point is in the 100600 area; the short-term price rebounded in the early morning, and retreated under pressure in the Asian morning. The intraday high was around the 104500 area. The current retracement did not continue, so there is still a demand for consumption during the day, but the hourly chart attached chart indicator has already crossed.
Therefore, today's BTC short-term contract trading strategy: sell at the 104000 area, stop loss at the 104500 area, and target the 102500 area

Bitcoin Update – Expecting a Correction to $96K! Crypto traders! 💙 Bitcoin looks ready for a pullback to our key level at $96,000. I’m waiting to BUY in this zone, but if the level breaks and price stabilizes below, I’ll consider a SHORT trade to our next target (as previously defined).
⚡️ Pro Trading Tip:
✅ If you’re a trader, always have a strategy—be ready for any scenario!
✅ For long-term investors, accumulate on dips near support levels.
📌 Risk management is key! Double your position size at each lower level to drastically reduce your average entry price.
💎 The Golden Rule of Crypto Success:
🔹 Keep losses small & disciplined.
🔹 Let your winners run to maximize gains!
🔹 The market is unpredictable, but YOU control your capital!
🚀 Bitcoin never sleeps—what’s your play?
👇 What’s your take on this move?
For detailed entry points, trade management, and high-probability setups, follow the channel:
ForexCSP


BTCUSD Technical Analysis – V-Shaped Recovery Points to BreakoutBitcoin (BTCUSD) is showing strong bullish momentum following a textbook V-shaped recovery from the recent support zone around $73,699. After consolidating and breaking the descending channel, BTC surged with conviction, reclaiming critical levels and now approaching the previous All-Time High (ATH).
Key Technical Highlights
Pattern: V-Shaped Recovery
Support Zone: $73,699 – $75,000
Resistance/ATH: $109,255
Trendline: Long-term bullish trend remains intact
Recent Breakout: Clean breakout above the falling wedge/descending channel
BTC has reversed sharply from the bottom, printing higher highs and higher lows. This aggressive rebound has brought price action back toward ATH levels, with strong chances of a breakout continuation.
The structure suggests bullish control, especially after retesting key areas with strength.
Bitcoin Dominance at 62.2%
Bitcoin's market dominance sits at 62.2%, showing clear investor confidence and capital preference for BTC over altcoins. This dominance level reinforces the bullish bias as smart money flows into Bitcoin in anticipation of a potential price discovery breakout.
This trend, along with large institutional inflows, highlights a growing belief in BTC’s strength as a leading asset, especially in the current macro environment.
BTCUSD Trade Setup (As Per Chart)
🎯 Entry $104,732.85
⛔ Stop Loss $99,507.06
✅ Take Profit $114,359.25
The trade idea is based on the continuation of the current uptrend and breakout above $109,255, which previously acted as resistance (ATH). A clean daily close above this level would likely open the path toward $114,359 and possibly $116,000+ as the next milestone.
BTC is primed for a new leg higher. The market structure favors bulls with BTC dominance rising, large investments entering, and strong technical recovery in place. If Bitcoin holds above the entry zone and pushes through ATH, we may see a new high forming in the coming weeks.

BITCOIN Has Unfinished Business Below $74K! Will It Return?Key Disclaimer: Inefficiencies Don’t Need to Be Filled
Let’s set the stage clearly: inefficiencies like the one at $73,624.98–$74,420.69 for BTCUSD do not HAVE to be filled.
They’re a TENDENCY, not a rule, an intriguing opportunity to explore high-probability zones. If Bitcoin doesn’t return to this level, no harm is done; but this is a very good opportunity to analyze the term, as such... let’s break it down.
What Is an Inefficiency?
An inefficiency, or sometimes a fair value gap (FVG), is a price range with "minimal" trading activity, often caused by a rapid move—here, a rally—creating a liquidity imbalance. On the weekly BTCUSD chart, this area between wicks spans $73,624.98 to $74,420.69, likely formed during a sharp rally around April 2025.
This untested range makes it a potential target for future price action, as markets often seek to resolve such imbalances. Notably, the price has already approached this zone, and there’s a chance it may never return. However, around $74,400, there are still some “unfinished things to do”, untested liquidity, or orders, which could draw the price back if conditions align.
Why Do Inefficiencies Attract Price?
Inefficiencies often act as magnets for price due to:
Liquidity Seeking: Markets revisit areas with unfilled liquidity (stop-loss or pending orders) to balance supply and demand.
Market Memory: Traders and algorithms, target these levels, reinforcing their significance.
Mean Reversion: After rapid rallies, the price may retrace to test imbalances before continuing. (atm we are probably too far from it but still keep this area in your minds)
Institutional Activity: Large players might re-enter at these levels, making them key zones for reversals or consolidation.
Historically, assets tends to revisit such areas, as the chart notes.
BTCUSD Context: $103,000 with Bullish Momentum
As of May 10, 2025, BTCUSD is at ~$103,200 on the weekly chart, on the way to confirm a weekly breakout above $100,000, supported by higher highs, an ascending channel, and macro factors ( for example ETF inflows), signaling quite a strong momentum.
The inefficiency at $73,624.98–$74,420.69 is 28–29% below the current price, a deep pullback that might require a catalyst like a macro correction, negative crypto news, or profit-taking. Given the price has already approached this zone, it may not return, but the “unfinished business” around $74,400 keeps it on the radar. Still, strong trends can bypass inefficiencies, and factors like time decay or adoption may drive prices higher.
Trading Approach, Short-, Mid-Term Investors Take Your Profits!
This formation of inefficiency is not a prediction to short, it’s an opportunity to monitor.
Still, if you’re a short- to mid-term investor, it might be a smart move to take some profits here and observe what unfolds next.
Right now, we’re potentially seeing a double top forming around major psychological levels. And to be honest, the inefficiency below (shown on the chart) still lingers in the back of my mind.
People often ask me: “When is a good time to take profits?”
My answer? Now. It is a perfect example and it fits to all assets.
And here's why. There are clear scenarios that help remove the guesswork:
1. You sell now, and the price continues to rally higher.
That’s not a problem. By selling, you’ve reduced your risk, and securing your profits - always a smart move.
If the price breaks above $100K, you can always buy it back after a confirmed breakout and retest.
That’s a strong sign that investors are willing to pay higher prices for BTC, and historically, after such breakouts (like with the $50K level in August 2024), the market tends to come back to retest that breakout zone.
Of course, if you’re a long-term investor with a 3-5+ year horizon, you may choose to ride it out. In that case, trying to time this might just be over-managing your position. There’s always a chance BTC won’t retest $100K again.
2. The best-case scenario if you take profits now:
You get the chance to buy back lower.
If the market pulls back, keep that inefficiency level in mind—there’s also a mid-term trendline, previous yearly highs, and other technical elements that haven’t been tested yet.
Traders’ psychology hasn’t really been pushed to the limits at this stage, and in my view, the crypto market loves to test limits.
So if you’re a short- or mid-term investor who bought in at lower levels, this is a good time to seriously consider locking in some profits.
Step back, and let the price action guide the next move.
Listen—just listen.
Conclusion
Inefficiencies like the one between $73,624 and $74,420 don’t demand to be filled—but they’re worth understanding, tracking, and learning from. Whether price revisits that zone or not, the real value lies in recognizing where the market has moved too fast and what that might mean if momentum shifts.
Right now, BTCUSD is strong. But strength can fade, sentiment can shift, and “unfinished business” below still holds weight for traders who think in probabilities, not certainties.
If you’re in profit—especially from lower levels—this might be one of those moments to pause, and make sure greed isn’t driving your next decision.
Whether this zone becomes just a memory or a brilliant case study, it’s already a valuable example of how understanding market structure helps you stay a step ahead—not a step behind.
Stay alert. Stay humble. And as said… listen.
Cheers,
Vaido

BTC DOMINANCEBitcoin dominance could break down at this point, potentially signaling the start of an exceptional altseason.

BTC H4 Analysis | Key Support Zone: | Watch for ReactionBitcoin is approaching a significant support area between 88,277 and 86,850 on the H4 timeframe. This zone has historically acted as a demand region, and price action within this range will be critical to monitor.
Technical structure shows a potential for volatility, and traders should keep an eye on how BTC behaves around this level. A clear reaction here could offer insight into the next directional move.
No trade setup provided — this is a technical observation for analysis purposes only.

BTC Trade Idea — React, Don’t PredictBINANCE:BTCUSD
Smart Trading Requires Patience!
Bitcoin is currently undergoing a healthy correction.
Strong support is located around $87,500, and if confirmed by price action, it could offer a great buying opportunity.
Trading without a plan = gambling!
** Alternative Scenario:
If the $87,500 level breaks with strong confirmation, after a pullback to this zone, a short
opportunity could emerge.
Follow us for more professional insights!
#CryptoAnalysis #BTCUSD #TradingStrategy #Forex #Cryptocurrency

BTC Retrace or Rally? Bitcoin’s Liquidity Hunt & Next Move.Bitcoin BTC Analysis & Trade Idea
🚦 Market Context & Price Action
Bitcoin has experienced a sharp rally, pushing into previous weekly and daily highs. This area is a classic liquidity pool, where buy stops from breakout traders and late longs are likely accumulating. The current price action is overextended, suggesting that the market may be primed for a retracement as smart money seeks to capture liquidity before the next directional move.
💧 Liquidity Pools & Wyckoff Concepts
According to Wyckoff methodology, this phase resembles a "Buying Climax" (BC) where price surges into resistance, often followed by an "Automatic Reaction" (AR) and a potential "Secondary Test" (ST). The current rally into old highs is likely triggering buy stops, providing institutional players with ample liquidity to offload positions or engineer a shakeout.
🟢 Wyckoff Schematic:
Buying Climax (BC) at current highs
Anticipated Automatic Reaction (AR) as price retraces
Look for a range to develop (potential Accumulation phase) near the 50% Fibonacci retracement
📉 Fibonacci Retracement & Trade Setup
You’re eyeing the 50% retracement of the previous price range as a key level. This aligns with both technical and Wyckoff logic, as it’s a common area for price to find support after a liquidity grab.
🟢 Trade Plan:
Wait for a retrace to the 50% Fibonacci level
Observe for a range or consolidation (signs of absorption/accumulation)
Look for a bullish break of market structure (BOS) as confirmation
Enter long on confirmation, with stops below the range low
🌐 Fundamentals & Market Sentiment
Currently, Bitcoin sentiment is mixed but leaning bullish due to recent ETF inflows, institutional adoption, and macroeconomic uncertainty (e.g., inflation, rate cut expectations). However, funding rates are elevated, and open interest is high, indicating potential for a shakeout as overleveraged longs are vulnerable.
🟢 Key Fundamentals:
ETF inflows and institutional interest remain strong
Macro uncertainty (Fed policy, inflation) supports long-term bullishness
Short-term: Overheated sentiment and high leverage could trigger a corrective move
🧠 Sentiment & Risk Management
Social media and crypto news outlets are buzzing with bullish narratives, but this euphoria often precedes a correction. Be patient and disciplined—wait for the retrace and confirmation before entering.
🟢 Risk Management:
Only enter after clear accumulation and bullish BOS
Use tight stops below the range
Consider scaling in if the range develops with clear absorption
📈 Trade Idea Summary
Wait for a retrace to the 50% Fibonacci level of the recent rally
Look for Wyckoff-style accumulation and a bullish break of structure
Enter long on confirmation, targeting new highs or the top of the previous range
Manage risk with stops below the accumulation range
Not financial advice!

BTC NEXT MOVE ANALYSIS Bitcoin is showing strong bullish momentum, with a potential pullback setup forming. We are currently watching the $93,300 zone for short term reaction, but our primary interest lies lower.
A buy limit is planned at $90,500, aligning with a high-probability demand zone and market structure support. This area could provide an optimal entry for a continued push toward the draw of liquidity near $96,500.
Stay patient any dip toward this zone is a buying opportunity.
Setup is valid unless price closes below $90,000.
Stay Tuned For More 🤝🎖️🫡
