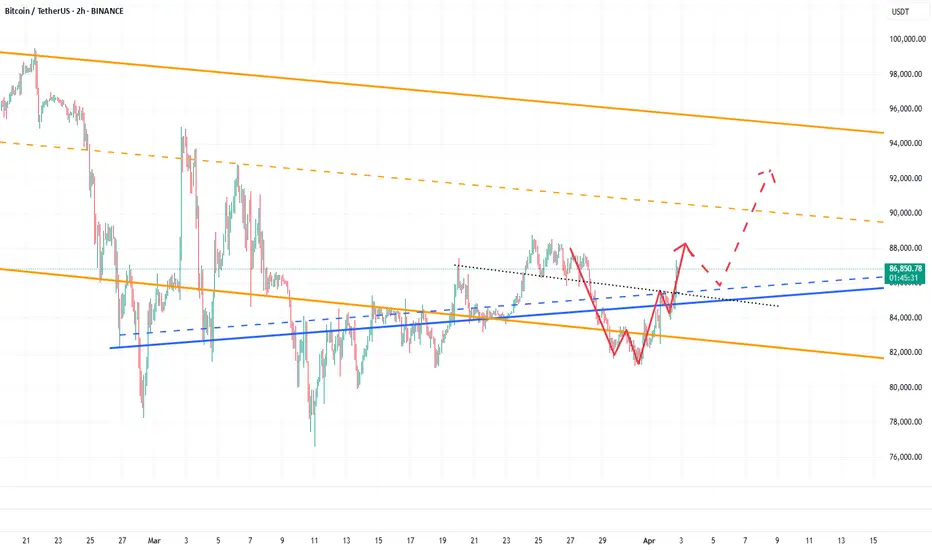
BTC already has the conditions to hit the 90000-95000 zone!A few days ago, I mentioned that BTC had the potential to surge towards the 90000-95000 range. Currently, BTC has already climbed above 87000 during its rebound, effectively opening the door to the 90000-95000 zone.
From a fundamental perspective, with bearish factors becoming clearer, if Trump adopts a more lenient stance on tariffs, BTC could extend its rebound. On the technical side, BTC has successfully broken through the short-term resistance around the 85500 level, turning the 85500-84500 area into a short-term support structure. This transition further supports BTC’s continuation to the upside, potentially testing the 90000-95000 range.
For short-term trading, we can consider waiting for a technical pullback and looking to go long on BTC once it retraces to the 85500-85000 region. The trading strategy verification accuracy rate is more than 90%; one step ahead, exclusive access to trading strategies and real-time trading settings
Btctrade
Can it hit 89,000 again?The price trend of BTC has once again become the focus of global investors' attention.
Previously, BTC experienced a period of consolidation, during which the bulls and bears engaged in repeated games. Now, the bulls of BTC have risen strongly, unleashing powerful upward momentum.
With a swift and fierce move, it has broken through the key resistance level of 85,000 at one stroke. This breakthrough is like a fuse igniting the market, and the upward trend has spread rapidly. It is expected that it will further challenge the range of 87,000-89,000 in the future.
The market has been extremely volatile lately. If you can't figure out the market's direction, you'll only be a cash dispenser for others. If you also want to succeed,Follow the link below to get my daily strategy updates

Bitcoin Analysis: Potential Path to $150K and Market TrendsCurrent Price & Key Levels
- BTC/USDT Price: BINANCE:BTCUSDT (as per chart).
- Critical Support: Bottom of the ascending channel .
- Key Resistance: Upper trendline of the channel (to be confirmed).
Technical Signals
1. Ascending Channel:
- Price is at the bottom of the channel, historically a bounce zone.
- A break above the upper trendline could signal a bullish continuation.
2. Moving Averages:
- SMA 200 (4H) and SMA 20 (1D) are critical for trend confirmation.
- A bullish crossover (e.g., SMA 20 > SMA 200) would strengthen the buy signal.
3. Dominance (BTC.D):
- If Bitcoin dominance turns bearish, expect capital rotation into altcoins (altseason potential).
- Monitor dominance alongside price action for market shifts.
$150K Target: When and How?
- Scenario 1:
- A strong breakout from the ascending channel + rising volume → Acceleration toward $150K.
- Timeline:Mid-2025/Late-2025 (historically aligns with post-halving cycles).
- Scenario 2:
- Slow grind upward with corrections → $150K likely by 2026, pending macroeconomic stability (e.g., ETF inflows, regulatory clarity).
Altcoin Season Watch
- Trigger:
- If Bitcoin’s dominance drops below 57%, altcoins may surge.
- Focus on high-cap alts (ETH, SOL) and narratives like AI, DePIN, or RWA.
Trade Strategy
- Entry:
- Buy on confirmed breakout above the channel + SMA crossover.
- Stop Loss:
- Below the channel’s lower trendline (e.g., $80,000).
- Take Profit:
- targets: $100,000.120,000
- Final target: $150,000 (scale out profits).
Risks to Monitor
- Macro Factors: Fed rate decisions, geopolitical tensions.
- Bitcoin ETF Flows: Sustained inflows/outflows impact momentum.
- Regulation: Crackdowns or approvals (e.g., ETH ETF).
---
Conclusion
- Bullish Outlook: $150K is achievable if Bitcoin holds the ascending channel and dominance remains stable.
- Altseason Hedge: Prepare a basket of altcoins if BTC.D trends downward.
Like, comment, and follow for updates! 🚀

Bitcoin (BTC/USD) Price Analysis: Bearish Breakdown Ahead?🔥 Bitcoin (BTC/USD) 1-Hour Chart Analysis 🔥
🔹 Trend Analysis:
🟡 Price was moving in an ascending channel 📈 but has broken below the trendline.
🟠 A retest of the broken trendline is happening, suggesting a potential drop 📉.
🔹 Trade Setup:
🔽 Short Entry: Expected rejection from the trendline.
❌ Stop Loss: $85,671 - $85,710 (Above resistance).
✅ Take Profit Target: $81,386 - $81,347 (Bearish target 🎯).
🔹 Indicators & Confirmation:
📊 EMA (9) at $84,254 → Acting as resistance 🚧.
🔄 Break & Retest Pattern → Typical for a bearish continuation 🛑📉.
🔹 Conclusion:
⚠️ Bearish Bias: If the price rejects the trendline, it could drop towards $81,386 🎯.
🚨 Invalidation: If the price breaks above $85,710, the short setup is canceled ❌.

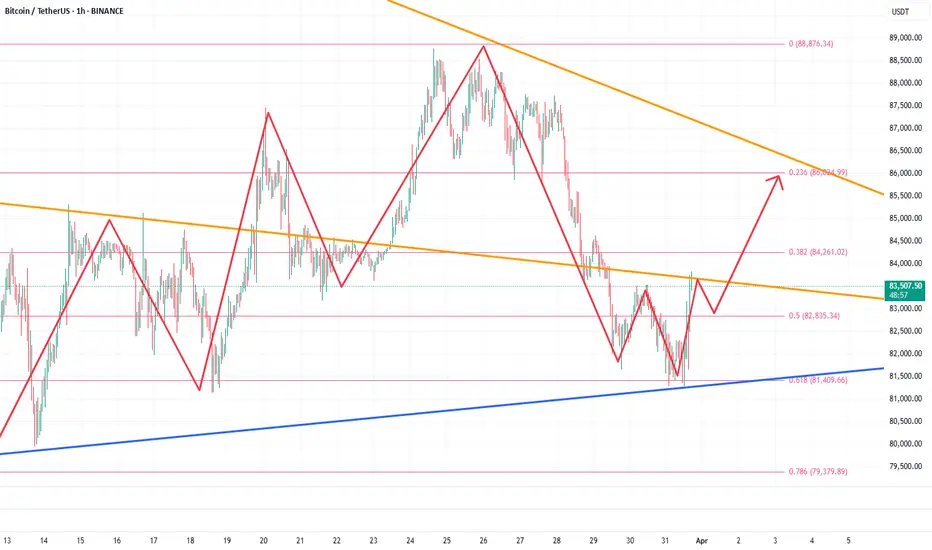
Bearish Trend Meets Bullish Momentum: Is BTC Ready for a Rebound📉 Bitcoin is currently in a strong bearish trend on higher timeframes, but 📈 the 1-hour timeframe shows a break of structure and bullish momentum. This suggests a potential short-term pullback into the previous range, aligning with the 50% Fibonacci retracement level. 🔄 Additionally, there’s a bearish imbalance above that could be rebalanced. While this presents a possible buy opportunity, ⚠️ it’s a high-risk setup due to the overall bearish trend. Always trade with caution! 🚨
Disclaimer
⚠️ This is not financial advice. Trading involves significant risk, and you should only trade with funds you can afford to lose. Always do your own research and consult a professional if needed. 💡

BTC is expected to hit 85000-86000 again, or even higherBTC has once again built a strong double bottom structural support in the 82000-81000 zone. BTC is likely to continue to rise. Once it breaks through the short-term resistance area near 83600, BTC may usher in a wave of accelerated rise and has the potential to continue to the 85000-86000 zone.
So we can still go long on BTC in the 82500-81500 zone. In addition, once BTC rises as expected, it is likely to grab the market share of gold, so it may also accelerate the decline of gold to a certain extent. This is a point we must be careful about next.
The trading strategy verification accuracy rate is more than 90%; one step ahead, exclusive access to trading strategies and real-time trading settings
Grasp the trend and analyze the full range of BTC longsTechnical analysis: Based on in-depth technical analysis, the current BTCUSD decline has slowed down, and there are signs of building double bottom support. The 50-day moving average and the 200-day moving average form a golden cross, the MACD indicator continues to strengthen and the bar chart continues to expand. As BTCUSD stops falling, market sentiment is gradually warming up, institutional funds continue to flow in, fundamental support is solid, and the upward momentum may gradually strengthen. It is the right time to go long.
BTCUSD operation strategy: Go long in the 82500-81500 area. Target 83000-84000
Trading discipline: 1. Don't blindly follow the trend: Don't be swayed by market sentiment and other people's opinions, operate according to your own operation plan, market information is complicated, and blindly following the trend is easy to fall into the dilemma of chasing ups and downs.
2. During the transaction, we will continue to pay attention to news and technical changes, inform us in time if there are changes, strictly implement trading strategies and trading disciplines, move forward steadily in the volatile market, and achieve stable asset appreciation.

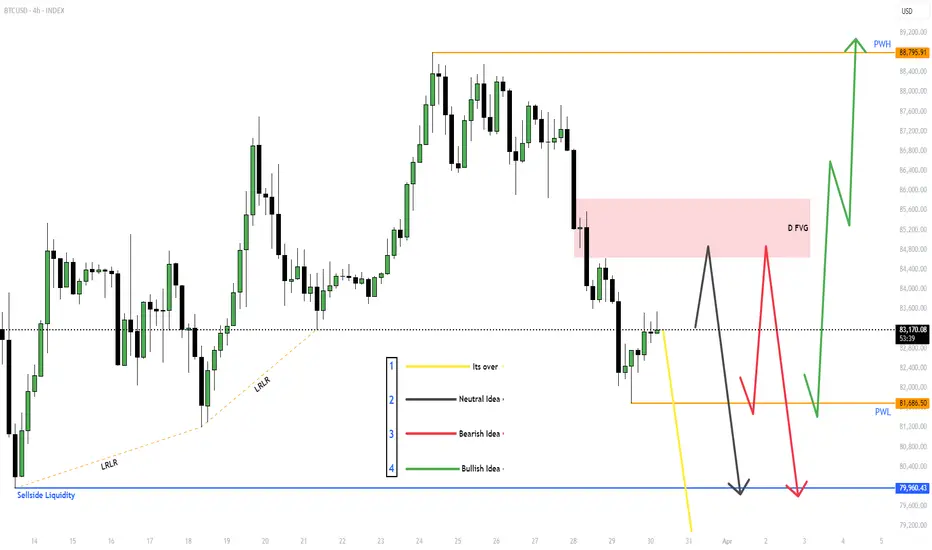
$BTC for Next week (31st March - 4th April)Given out all the ideas, Will react to the market based on which idea presents itself.
If Yellow line - Its better to stay out of the markets.
With the other wait for MSS (Market Structure Shift) and then take the trade and target the other side of the liquidity.
BITSTAMP:BTCUSD , BINANCE:BTCUSDT.P BINANCE:BTCUSDT
Overall I'm neutral on CRYPTOCAP:BTC but SEED_ALEXDRAYM_SHORTINTEREST2:NQ and NYSE:ES look bearish to me, and CRYPTOCAP:BTC could follow.
BTC-----More around 83300, target 82000 areaTechnical analysis of BTC contract on March 30: Today, the large-cycle daily level closed with a small negative line yesterday, the K-line pattern continued to be negative, the price was below the moving average, the attached indicator golden cross was running with shrinking volume, and the fast and slow lines showed signs of sticking dead cross. From this point of view, the general trend of decline is still very obvious, and what we need to pay attention to in trading is to find a good entry point, keep short-term, and do a good job of risk control. Leave the rest to me! The short-term hourly chart continued the trend of shock correction after the decline in the European session yesterday. The current K-line pattern is continuous positive, and the attached indicator is running with a golden cross. Then it is likely to be corrected first within the term. The resistance position of the MA30 moving average is near the 83,300 area.
Today's BTC short-term contract trading strategy: sell at the 83,300 area, stop loss at the 83,800 area, and target the 82,000 area;

BTC(20250329) market analysis and operationTechnical analysis of Bitcoin (BTC) contracts on March 29: Today, the large-cycle daily level closed with a medium-yin line yesterday, and the K-line pattern continued to fall. The price was below the moving average, and the attached indicator was golden cross and the volume was shrinking. The general trend is still firmly bearish; we should note that the price will still fluctuate over the weekend, and the probability of continuous decline is relatively small, but it does not mean that it will not fall, but just let everyone not expect too much of the weekend trend; the lower support position focuses on the two previous lows of 80,000 and 76,600. The short-cycle hourly chart shows that the European session fell and the US session continued to break the low position. The current K-line pattern is continuous and positive, and the attached indicator is golden cross. It is likely to be corrected first during the day.
Today's BTC short-term contract trading strategy: sell at the 85,200 area, stop loss at the 85,700 area, and target the 84,200-83,800 area;

"Bitcoin (BTC/USD) Price Analysis: Key Support Test & Potential This chart is a Bitcoin (BTC/USD) price analysis on a 1-hour timeframe from TradingView. Here are the key insights:
Technical Indicators:
Exponential Moving Averages (EMAs):
200 EMA (blue): 85,984 (indicates long-term trend support/resistance).
30 EMA (red): 85,705 (short-term trend direction).
Support & Resistance Zones:
Purple Zone (Support Area): This area has been tested multiple times and is expected to provide a strong buying zone.
Resistance/Target Levels:
Upper EA Target Point: 88,366 (potential bullish target).
Lower EA Target Point: 79,819 (potential bearish target).
Trade Setup:
Entry Point: Around 83,810 (current price near support).
Stop Loss Levels:
Conservative: Around 83,750
Aggressive: Around 83,184
Target Point: 88,366 (bullish) or 79,819 (bearish).
Market Outlook:
The price is currently testing a key support zone.
If the support holds, we may see a bullish reversal toward 88,366.
If the price breaks below the support, further downside to 79,819 is possible.

Buy BTC,it still has the potential to reboundBTC experienced a sharp short-term decline, breaking lower; however, the downward momentum has significantly slowed. Importantly, the recent pullback has not disrupted the broader upward consolidation structure, with the 84500-83500 zone continuing to provide strong support.
Once the bearish sentiment fully subsides, I anticipate a relief rally or a technical rebound. Therefore, this pullback could present an excellent opportunity to go long on BTC.
Consider entering long positions around the 84500-83500 support zone, targeting an initial upside move toward the 86000-86500 range.
The trading strategy verification accuracy rate is more than 90%; one step ahead, exclusive access to trading strategies and real-time trading settings

BTC(20250328) market analysis and operationTechnical analysis of Bitcoin (BTC) contracts on March 28: Today, the large-cycle daily level closed with a small negative line yesterday, and the K-line pattern continued to be negative, but the price did not break or continue. The attached indicator golden cross was running with a shrinking volume, but the price was relatively weak, and the overall trend was volatile, so there were not many signals in the big trend. As mentioned earlier, after the correction, wait for the second round of large price declines; the short-cycle hourly chart fell under pressure yesterday, and the European session continued to accelerate in the US session, but the price did not break. In the early morning, the correction pulled back to wipe out the decline, maintaining range fluctuations, with a high of 87,800 and a low of 85,800; the current K-line pattern continued to be negative, and the probability of a retracement trend should be observed first.
Today's BTC short-term contract trading strategy: sell directly at the current price of 87,300, stop loss at 87,800, and target at 86,000;

Bearish on Bitcoin (BTC) – Target Price: ~$70,000Technical Analysis:
The provided chart illustrates Bitcoin's (BTC/USD) current position within a descending channel, marked by red resistance and green support lines. The series of lower highs, indicated by the red arrows, reinforces the prevailing bearish momentum. A potential breakdown from the current trading level of approximately $85,079 could lead to a decline toward the green support line, aligning with a target price around $70,000.
Fundamental Analysis:
Recent developments provide additional context to this bearish outlook:
Market Sentiment: Betting markets suggest that Bitcoin has likely peaked for the year, hovering just above its January high of $109,000.
Macroeconomic Factors: Concerns over President Trump's tariff policies and broader economic conditions have contributed to Bitcoin's recent decline. Analysts warn of further downside risks due to ongoing uncertainties in global trade and inflation.
Trading Strategy:
Entry Point: Consider initiating a short position on BTC at the current price of approximately $85,079.
Target Price: Set a price target of $70,000.
Stop-Loss: Implement a stop-loss order at $88,000 to manage potential upside risk.

Bitcoin (BTC/USD) Trade Setup: Potential Reversal & Target Proje200 EMA (Blue): 86,960.21
30 EMA (Red): 86,149.39
The price is currently below both EMAs, indicating a short-term bearish trend.
Key Levels:
Stop Loss: 83,954.20 (marked in blue at the bottom)
Re-entry Level: 86,198.54 (near the 30 EMA)
Target Price: 89,056.91
Support & Resistance Zones:
Strong Support Zone: Around 83,954.20
Intermediate Resistance: Near 86,198.54
Major Resistance Zone: Close to 89,056.91
Trade Setup & Projection:
The chart suggests a potential reversal from the support zone.
The expected price movement shows a bounce from support, a breakthrough of the intermediate resistance, and a push toward the target price (89,056.91).
The expected gain is 4,509.86 points (5.34%).
Conclusion:
If BTC holds the support zone, an upside move is likely.
Breaking above 86,198.54 would confirm a bullish reversal.
Failing to hold support at 83,954.20 could lead to further downside.

Buy@85500 - 86500Presently, Bitcoin is firmly ensconced within a robust upward trajectory. Having transitioned from a sideways trading phase at 84000 last week, it has executed a remarkable rally, surging directly into the resistance corridor in the vicinity of 89000. With the current trading price hovering at 87000, the market exudes a palpable sense of bullishness.
Should BTC sustain a stable sideways oscillation between 87000 and 88000, the bulls stand to methodically amass upward momentum. Once primed, a breakthrough of the 89000 threshold by BTC appears all but inevitable.
From a technical vantage point, Bitcoin has convincingly breached the sideways trading range. Its moving averages exhibit a distinct bullish configuration, with the 85000 level solidifying as a crucial support.
On the fundamental front, a confluence of factors—including the prevailing global economic uncertainties, the buoyant market sentiment, and the relatively permissive regulatory environment—collectively conspire to propel the continued ascent of its price.
💎💎💎 BTCUSD 💎💎💎
🎁 Buy@85500 - 86000
🎁 TP 87000 88000 89000
The market has been extremely volatile lately. If you can't figure out the market's direction, you'll only be a cash dispenser for others. If you also want to succeed,Follow the link below to get my daily strategy updates

Trade Idea: BTCUSDT (15m Chart)Trade Idea: BTCUSDT (15m Chart)
Price has aggressively pushed up from the daily demand zone and is now forming a potential bullish continuation setup. A retracement into the M15 FVG zone is expected. If price respects this zone and forms a bullish reaction, a long opportunity aligns well with the context target above.
Bias: Bullish
Context: Price is targeting upside liquidity after reclaiming structure. Expecting continuation following a healthy retracement.
Trade with confirmation and risk management.

BTC-----Sell around 87000, target 86500 areaTechnical analysis of BTC on March 27: Today, the large-cycle daily level closed with a small negative line yesterday, the K-line pattern was a single negative with continuous positive, the attached indicator golden cross was running with shrinking volume, and the fast and slow lines were below the zero axis. The general trend was still bearish. The four-hour chart was under pressure near the 88,800 area after the rebound last week. The current K-line pattern was a continuous negative, and the attached indicator was dead cross running. There was an obvious retracement and decline trend. Let's take a look at the continuation and strength first; the short-cycle hourly chart yesterday's European session fell and the US session continued to break the previous day's low position, and the high position was corrected in the early morning near the 87,500 area. In this way, if we continue to see a retracement and fall and break the low today, then the rebound cannot break the pressure point position, otherwise it will be difficult to fall.
Today's BTC short-term contract trading strategy: sell at the rebound 87,000 area, stop loss at the 87,500 area, and target the 85,600 area;

Bitcoin Price Outlook: Bullish Breakout or Bearish Dip Ahead?Hey there, crypto enthusiasts! Bitcoin’s sitting at a crossroads right now. If we smash through that 87,678 resistance, we could be in for an exciting ride up to 90K or beyond—bullish vibes all the way! But, if the momentum fizzles and we keep sliding into lower lows, I’m eyeing a consolidation zone between 85,400 and 84K. What do you think—ready for a breakout, or bracing for a dip? Let’s chat about it!
Kris/Mindbloome Exchange

Bitcoin Looking Bullish on 4 hour - printing a bull FlagBitcoin is certainly looking Bullish on the lower time frames and, in my opinion, continur to fall in the Flag till we get near that lower Trend line of Ascending channel we been making since the Low around 76K
The 4 hour MACD is falling Bearish and support the idea of a continues Drop to lower Trend line
I think the Margins are too tight to do any day trading
Just Sitting, waiting.
Longer term, I am still prepared to see another Drop Lower but maybe not to the 76K range again.
The Monthly candle for March is currently Green off an expected RED.
It has Long wicks above and Below, showing a good fight between Bulls and Bears.
The Body of this candle is not Big but it would take a serious drop out of range to turn it red
So, RELAX
We should be OK

Is BTC Bitcoin Overextended? My Bias Is Bullish With Conditions!This 30-minute chart 🌟 shows Bitcoin consolidating within a descending channel after a recent bullish breakout 🚀, with a potential bullish structure forming. The price is currently testing the upper boundary of the channel near $87,500 🛡️. If the price breaks below the channel and retests the equilibrium support, it could present a strong buy opportunity 💰 . Considering the broader analysis 🌍, a break above $87,926 with strong volume 🔥 would confirm bullish momentum toward $90,000 🎯 . Not financial advice. ✨

When will BTC break through 89,000?Currently, Bitcoin is in a strong upward trend. It has soared directly from a sideways movement at 84,000 to the resistance zone near 89,000. Now, with the price at 86,000, the market sentiment remains bullish.
If BTC maintains a stable sideways movement between 87,000 and 88,000, the bulls can gradually accumulate upward momentum. Once ready, BTC will undoubtedly break through 89,000.
Technically, Bitcoin has broken through the sideways range, and its moving averages show a bullish alignment. The 85,000 level has emerged as a significant support.
Fundamentally, factors such as global economic uncertainties, exuberant market sentiment, and a relatively relaxed regulatory environment are jointly driving the continuous upward movement of its price.
💎💎💎 BTCUSD 💎💎💎
🎁 Buy@85500 - 86000
🎁 TP 87000 88000 89000
The market has been extremely volatile lately. If you can't figure out the market's direction, you'll only be a cash dispenser for others. If you also want to succeed,Follow the link below to get my daily strategy updates

BTC:BTC is expected to continue to rise to 95000BTC has built a perfect upward structure in an oscillating upward manner, and has continuously strengthened the bottom support during the oscillation process. BTC is expected to continue to rise. However, BTC is facing the 88500-89500 resistance area, so BTC needs to accumulate energy to break through this resistance area, so we should focus on the 86500-85500 area support below. Once BTC touches this area and stops falling and rebounds, BTC is bound to break through the 88500-89500 resistance area and is expected to continue to 95000.
So in terms of short-term trading, if gold pulls back to the 86500-85500 area, we can go long on BTC.I will make more detailed trading plans and trading signals every day according to the real-time market situation, which is also the testimony of every successful transaction and profit of mine; the article has a certain lag, if you want to copy the trading signals to make a profit, or master independent trading skills and thinking, you can choose to join the channel at the bottom of the article
