Trading BTC with a Solid Plan Is Crucial for Success—Here’s Mine🌟 In this video, I share a trade idea along with my detailed trading plan and we highlight why a well-structured strategy is 🔑 key to success. Discover how to trade BTC Bitcoin 🪙 using a trend continuation approach while leveraging TradingView's powerful tools and features to gain a real edge in the markets. 🖥️✨
Here’s what we’ll cover:
📊 Trend Analysis: A top-down review of market direction to identify opportunities.
📈 Market Structure & Price Action: Key insights into how price moves and behaves.
🎯 Trade Planning: Using higher timeframe support and resistance levels to set stop loss and target points.
🛠️ TradingView Features: Practical tools to refine your analysis and boost efficiency.
This video is an in-depth guide to trading effectively with a proven strategy, enhanced by TradingView's unique capabilities. 🚀 Please remember, this is not financial advice. 📜
Btctrade

Bitcoin: The Perfect Pullback Entry! 🔥 What's up, traders! Welcome to another explosive analysis! 🔥
Today, I’m entering BTC/USD with a strategy that’s on FIRE. 📈 The trend is crystal clear: Bullish! 🟢 But hold on, the Market Prediction Indicator is signaling a possible pullback before the next big move up. 😎
That’s why I’m not jumping in right away. I’ve placed a Buy Limit at $100,845.60, waiting for the price to dip and give me the perfect entry. 💸
🎯 Take Profit: set at $105,964.67
🛡️ Stop Loss: locked in at $97,576.65
I’m aiming for that perfect entry, taking advantage of the pullback to ride the bullish momentum hard. 🚀
What do you think? Will the market respect this analysis or surprise us? 🤔
Drop your thoughts in the comments and don’t forget to subscribe for more strategy-packed and action-filled analysis! 📊🔥
Let’s go all in! 💥
Disclaimer:
This content is for educational and informational purposes only and should not be considered financial advice. Always do your own research and consult with a licensed financial advisor before making any investment decisions. Trading cryptocurrencies involves significant risk and may result in the loss of your capital.

Next target for Bitcoin BTC price is $110k but there is a nuanceCRYPTOCAP:BTC price has reached $90000 - this is something incredible, considering that just 8 years ago we were trading #BTCUSD for $900) X100 is easy money if you save it)
And the coolest thing is that this is just the beginning)
However, no one on our planet has yet canceled the effect of gravity so everything that takes off will be attracted to the ground
OKX:BTCUSDT price needs a correction, at least to $77-78k. And even more so, this correction is needed for altcoins, so that the “fresh” capital that entered the cryptocurrency market through #Bitcoin CRYPTOCAP:ETH CRYPTOCAP:SOL CRYPTOCAP:DOGE CRYPTOCAP:TON can flow into low-cap #Altcoins
It may hurt a little at first, but it will be pleasant later
Use the correction period to monitor altcoins very closely to determine which ones are being redeemed, where there is strength and support, and the greatest chance of further growth
Or follow us, we regularly give tips;)

How Bitcoin’s Recent Golden Cross Could Impact Your Crypto Bitcoin has been performing strongly on the charts since hitting a low of GETTEX:89K a week ago. The cryptocurrency’s value has risen to over $105,000 at the time of writing, marking an increase of over 11% in just a week. The recent gains have sparked optimism within the crypto community, with some speculating about a potential short-term rally.
According to Burak Kesmeci from CryptoQuant, Bitcoin’s 1-7 day UTXO average has crossed above the 7-30 day UTXO average. This crossover signifies that the average cost basis for Bitcoin acquired over the past week is rising, despite recent price hikes. This positive signal indicates that the ongoing price upswing is backed by fresh capital inflows.

BTC BITCOIN- check out btc next target must read captionBTC/USD is displaying strong potential for an upward breakout, supported by market momentum and bullish sentiment. Patience is key—hold your trade as the price gears up for a significant move to the upside. The trend is setting up for a favorable run, so stay focused and confident in your position.

Key Insights from the BTC Market Analysis1. Market Overview
BTC Price: $102,624.90, up +3.83%.
Market Cap: $2.03T, with 24h Volume at $103.12B (+13.99%), signaling robust trading activity.
Dominance: 56.34% (+0.43%), showing BTC’s growing share of the market.
2. Indicators of Sentiment
Crypto Fear & Greed Index: 75, indicating strong "Greed" and bullish market sentiment.
Exchange Balances: BTC exchange balance slightly decreased (-0.06%), suggesting hodling and reduced selling pressure.
3. Derivatives Insights
Open Interest (OI): Up +5.39% to $149.62B, showing new positions are opening, potentially setting up larger moves.
Funding Rates: Positive across major exchanges, indicating more bullish positions.
Long/Short Ratio: Mixed sentiment with Binance net long (1.66) and OKX net short (0.67), which may lead to pockets of volatility.
4. Technical Indicators
Support: $101k–$101.5k, deeper support near $100k if a pullback occurs.
Resistance: $103k–$103.3k. Breaking above this could push BTC toward $105k.
RSI: Cooling slightly (~58–60), signaling consolidation or potential pullback after recent gains.
5. Short-Term Scenarios
Bullish: A reclaim of $103k could push BTC to $105k.
Neutral: Consolidation between $100k and $103k.
Bearish: Profit-taking near $103k might drop BTC to $100k or lower.
6. Confidence Level
Overall Bias: Moderately bullish.
Positives: Increasing OI, reduced exchange balances, and bullish funding rates.
Cautions: Slightly cooling RSI and large options OI increase (+45.30%) suggest potential for high volatility.
Final Thoughts
BTC remains in a strong position as long as it holds above $101k. A breakout above $103k could lead to further upside, but cautious risk management is essential given mixed sentiment across derivatives and short-term cooling indicators.

BTC long trade setup using ICC conceptsBTC is showing buyers presence by pushing price back to the resistance.
If buying volume rises on the resistance, we can zoom into low timeframes to find a bullish structure.
If price breaks above that bullish structure, we can expect the price to reach the last high, 108k, our target. It's weekend so it's low volume, RSI is overbought, I expect price to chill around 100k-103k. We just wait patiently for the price to tell us what it wants to do, could be a 1:3 or 1:4 trade.

Bitcoin - Weekly Forecast - Technical Analysis & Trading IdeasMidterm forecast:
73777.00 is a major support, while this level is not broken, the Midterm wave will be uptrend.
Technical analysis:
A trough is formed in daily chart at 88963.75 on 01/13/2025, so more gains to resistance(s) 102643.85, 108293.92, 110000.00 and more heights is expected.
Take Profits:
99607.07
102643.85
108293.92
110000.00
115000.00
118110.67
120000.00
125000.00
130000.00
134142.91
Total Profit: 5567500 point (55%)
Closed trade(s): 506200 point Profit
Open trade(s): 5061300 point Profit
Trade Setup:
We opened 11 BUY trades @ 94545.07 based on 'Hammer' entry method at 2025-01-13.
Closed Profit:
TP1 @ 99607.07 touched at 2025-01-15 with 506200 point Profit. (5%)
Open Profit:
Profit for one BUY trade is 99606.37(current price) - 94545.07(open price) = 506130 point (5%)
10 trade(s) still open, therefore total profit for open trade(s) is 506130 (5%) x 10 = 5061300 point (50%)

#BTC/USDT#BTC
The price is moving in a descending channel on the 1-hour frame upwards and is expected to continue
We have a trend to stabilize above the moving average 100 again
We have a downtrend on the RSI indicator that supports the rise by breaking it upwards
We have a support area at the lower limit of the channel at a price of
96000
Entry price 96500
First target 97270
Second target 98691
Third target 100000

BTC Bitcoin HTF Bullish Structure & Potential Trade Setup👀 👉 A detailed analysis of Bitcoin (BTC) on the weekly and daily charts highlights a bullish market structure. Further upside potential is anticipated, provided a retracement occurs as outlined in the video. In this session, we examine the trend, price action, market structure, and a possible trade opportunity. ⚠️ This video is for educational purposes only and is not intended as financial advice.

Bitcoin Updatebtc has formed:
- ascending channel in blue and broke it
- while retesting the channel btc also formed a head and shoulders setup
- descending trendline in red
we're waiting for a candle to close below the neckline an retesting it so we enter a short (sell) trade
Follow us or more ideas an updates

BTC UP OR DOWN READ CAPBitcoin is at a pivotal point, where a breakout from its current level could spark a major rally, boosting investor confidence and driving significant upward momentum. However, if it fails to hold this crucial support, it risks heightened selling pressure, which could result in a sharp and prolonged downward trend in the market.

BITCOIN BUY OR SELL READ THE CAP"Bitcoin is showing a limited buying opportunity with strong indicators leaning towards a potential sell-off; investors should proceed with caution, keeping a close eye on market trends and resistance levels."

Bitcoin (BTCUSDT) 2500% Done @ 10X Leverage!Bitcoin MASSIVE LONG Trade Caught!
The move from $27,200 to $96,100 represents an approximately 250% gain. At 10x leverage I took, this is a clear 2500% massive gain!
This large rally indicates strong bullish momentum caught using the Risological Options Trading Indicator , with consistently higher highs and higher lows on the daily chart.
Use caution if momentum slows—prolonged consolidation or reversal signals might appear around such a major milestone.
Despite short-term pullbacks, BTC’s overall trend remains firmly bullish on the daily timeframe. The uptrend is supported by strong demand and increasing volume, often associated with sustained rallies.

BTC Breaks Highs: Bullish Trend Shift Possible ContinuationBTC has broken the previous high, signaling a shift in the trend. This marks a bullish change of character, and I'm watching for a retrace on the lower timeframe with a potential continuation to the upside. Keep an eye on a Fibonacci pullback to the 50-61.8% level on the previous four-hour swing for a possible bullish entry. This is not financial advice.

Resistance Broken? BTC Aims for $96K!Falling Trendline Breakout
Bitcoin has broken above a descending trendline resistance, indicating a potential shift in momentum from bearish to bullish.
Entry Zone
The recommended buy zone is $91,500 to $90,500. Price is currently within this range, making it an ideal area for a long entry.
Stop Loss
A tight stop-loss at $89,500 helps minimize downside risk if the breakout fails.
Targets
Target 1: $92,000
Target 2: $93,000
Target 3: $94,000
Target 4: $95,000
Target 5: $96,000
Risk Management
Stop-loss placement is critical to avoid potential losses, with a strong downside risk below $89,500.
Recommendation
Watch for a sustained close above the breakout level and monitor volume confirmation for continued upside momentum. This trade aligns well with a bullish reversal structure and offers multiple profit-taking levels.

What to Expect from Bitcoin in 2025? BEARISH TREND #BTC 13-01-25Bitcoin already started BEARISH TREND, so far #BTC gave us bearish reversal signal, at the same time it is forming Bearish Trend for 2025.
Thank you and Good Luck to all traders of #BTC and crypto!

Pro Tips for Crypto Trading and ask about your coinsMy Best Tips for crypto trading :
I have been trading crypto since 2017 and here my advices for newbies and average traders :
1- Don't try to catch falling knives 🔪, it's better to let the coins fall until they finish falling, stabilize, and wait for confirmation to enter a buy setup even if it comes after the asset rises from the bottom by 20 - 30%
2- Love your profits more than your coins... If you love the asset more than profits, it will become an emotional trading , which we try to avoid
3- In a bull market: hold your coins as much as possible, do not sell early
and try to buy the trendy coins Every cycle has its trend, must have some in your portfolio
4- In a bear market: sell the weakness (the trend is your friend)
Dont hold coins in bear market no matter how good the projects, they will crash by 85-99% and many will be delisted..
5- Do not put ur 100% trust in only one exchange (ex: FTX shutdown) and do not trust any project too much (ex: LUNA crash to zero), diversify your capital and the best thing you can use are the cold wallets (ex : ledger)
6- If you make a lose and get angry, take a break from the market and come back later... Don’t do revenge trading which will lead to more losses after losses
7- Always follow the news related to your coins/assets , as they can have a big impact on their price
8- There are times when you should not do anything (no trade zones) wait for triggers
9- Finally: One of the most important advantages of the crypto market is that the opportunities in it are renewable/endless ..and one of its most important rules is that : no matter how much profits you make, you are not rich unless you transfer it to your bank account because you may lose it all
10- Do not give up

BTC Price Forecast: Will Accumulation Zones Lead to a 50% Surge?We are analyzing a BTC/USD weekly chart where the price is holding strong support above the rising trendline, marked in blue.
First Scenario:
After breaking out of the resistance trendline, the price rallied by 135%, as shown in the first green box. Notably, there was a small accumulation phase in the red-marked zone before the breakout.
Second Scenario:
Currently, the price is steadily moving upward, forming another small accumulation zone within the red-marked area. This pattern suggests a potential continuation of the bullish trend.
Outlook:
Based on these observations, the price could potentially rise an additional 50% from current levels. The Stochastic RSI supports this view, aligning well with the momentum seen in both scenarios.
Conclusion: The strong trendline support, recurring accumulation zones, and favorable momentum indicators point to further upside potential.

BTC next draw on Liquidity I'm anticipating to LONG BTC based on my bias due to the previous week been bullish and this current week didn't close below the weekly level 93563.35 , it rejected it nicely.
On the daily TF price couldn't get past the daily zone 92620.71 too and we have a break to the upside on H4
I was anticipating to buy from the H4 poi 91902.65 but it's not certain that price is coming back to my poi due to the fact that it already filled the Imbalance before it. Rather I'll be buying from 93720.05 . Till it gets to 99346.28
Please help boost this post if you find it insightful

BTCUSDT Analysis: Preparing for a Critical Zone TestThe 4-hour chart of BTCUSDT reveals a textbook retest of key levels following a sharp breakdown from the resistance near $105,268 . This move is consistent with a broader bearish structure that began forming after rejection at $108,366 . The current trajectory suggests Bitcoin may continue its downward momentum toward a high-probability liquidity zone between $85,883 and $89,510 . Here's why this area deserves close attention:
Technical Breakdown:
1. Descending Trendline Rejection:
The price recently respected the long-term yellow descending trendline, emphasizing the strength of sellers around $102,934.
2. Support Zones:
Immediate support at $96,920 has seen a weak bounce, increasing the likelihood of deeper retracements.
A stronger accumulation zone lies between $85,883 and $89,510 (highlighted in orange), which aligns with historical demand zones and Fibonacci retracement levels.
3. Bearish Momentum:
The rapid fall post-breakout indicates strong bearish momentum, confirmed by increasing sell volumes on key levels. Any short-term pullback toward $96,436 or $98,000 could serve as an opportunity to position for further declines.
4. Indicators and Risk Management:
Divergence signals suggest momentum exhaustion, and traders should anticipate potential short-term volatility. Use tight stop-loss placements and avoid overleveraging. For this setup, a stop-loss above $98,920 is recommended to limit risk.
Trade Plan:
Short Opportunity:
If BTC retraces to $96,436 or $98,000, consider entering short positions with targets in the $89,510–$85,883 range. Stay vigilant and be prepared to pivot based on price action near critical levels.
***
Final Note:
Remember, no strategy is foolproof. Always consider market risks, manage positions carefully, and align trades with your broader portfolio strategy. Let the price action guide your decisions.

Bitcoin Idea!"🌟 Welcome to Golden Candle! 🌟
We're a team of 📈 passionate traders 📉 who love sharing our 🔍 technical analysis insights 🔎 with the TradingView community. 🌎
Our goal is to provide 💡 valuable perspectives 💡 on market trends and patterns, but 🚫 please note that our analyses are not intended as buy or sell recommendations. 🚫
Instead, they reflect our own 💭 personal attitudes and thoughts. 💭
Follow along and 📚 learn 📚 from our analyses! 📊💡"

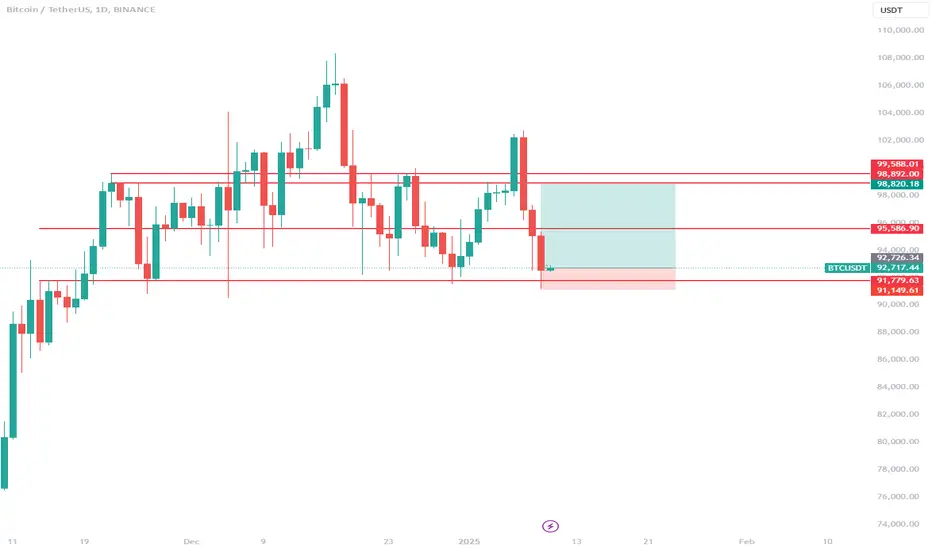
Trade Setup for BTCBTC has entered into the range after a fake breakout. Now is the ideal time to long BTC, as range lows has been swept. targeting mid range (95k) and the (98K) with stoploss below range low.