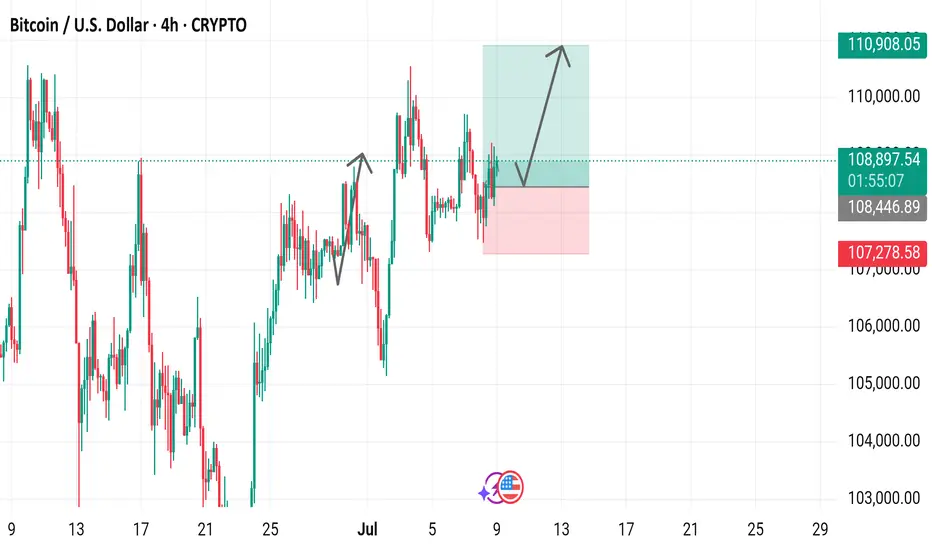
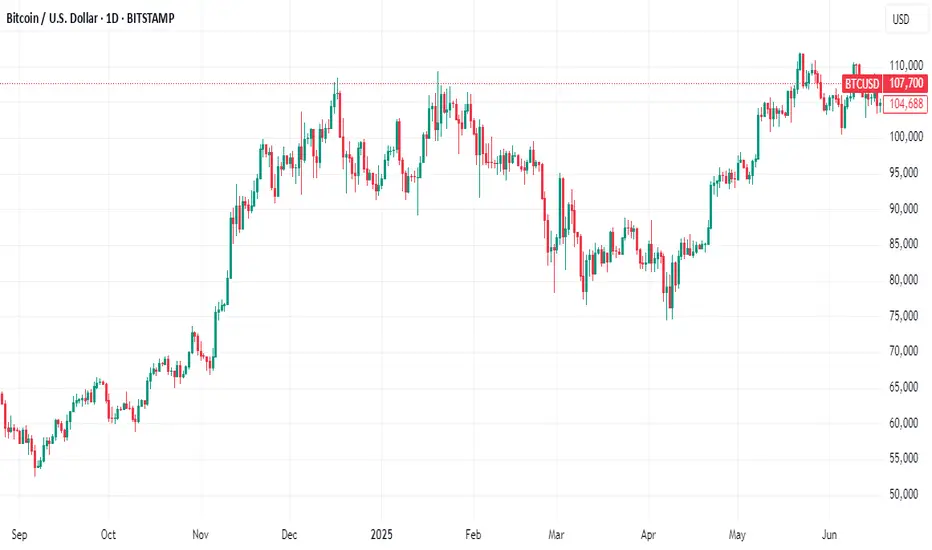
Bitcoin / U.S. Dollar 4-Hour Chart (BTCUSD)4-hour candlestick chart displays the price movement of Bitcoin (BTC) against the U.S. Dollar (USD) from late June to early July 2025. The current price is $108,895.04, with a 24-hour change of +$619.70 (+0.57%). Key levels include a support zone around $107,278.58 and a resistance near $110,908.05. The chart highlights recent price action, including a potential upward trend indicated by a green shaded area, with buy and sell signals marked at $108,895.04.
Btctrade
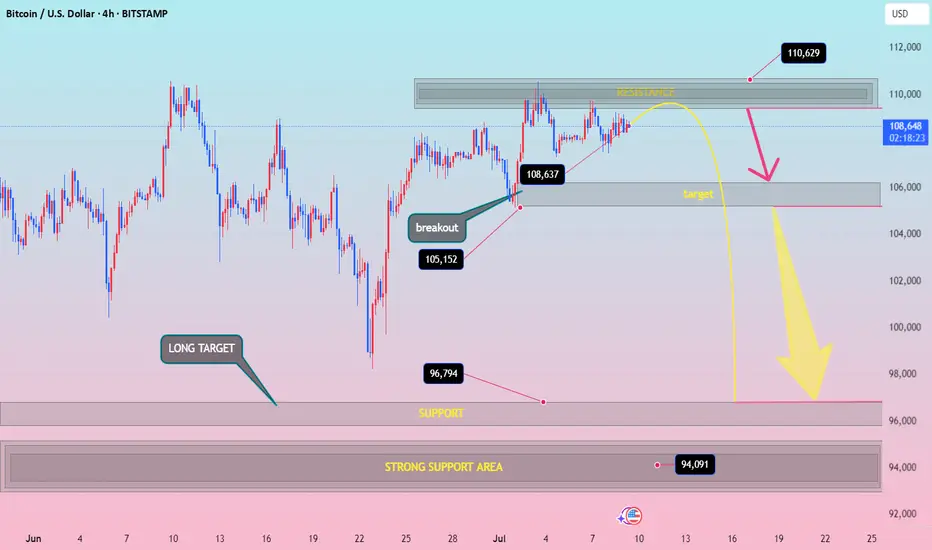
BTCUSD h4 down surelybtcusd down idia Resistance Zone: Around 110,000–111,000
Price Action Expectation:
→ Short-term push to 110,629
→ Then rejection toward 105,000, and potentially all the way down to 96,794 or even 94,091
Bearish bias after resistance is hit
⚡ Disruption Analysis (Contrarian View)
✅ 1. Resistance Flip Possibility
What if the 110,000 resistance breaks cleanly with strong volume?
Invalidates the bearish rejection arrow
Could trigger FOMO buying → Acceleration toward 112,500+
Bullish scenario: formation of a bull flag above resistance = continuation setup
✅ 2. Bear Trap Theory at 105,000 Zone
That “target” zone near 105k could be a fake breakdown zone
Market might dip there briefly, lure shorts, then reverse violently
This creates liquidity for a rapid long squeeze breakout
✅ 3. Market Structure Still Bullish on HTF
Higher lows from June 24 to July 6
Clean breakout at 105,152
Still respecting ascending structure — which is not bearish yet
🚨 Disruption Summary Chart Moves
🔼 Alternate Path 1 (Bullish Disruption):
Price consolidates under resistance → breaks above 110,629 → targets 112,500–115,000
🔄 Alternate Path 2 (Fake Breakdown Disruption):
Drops to 105,000, triggers sell-off → sharp reversal → back above 108,637
🔽 Original Path (Rejection-Based Bearish):
Still possible — but not the only high-probability path anymore
BTC/USD H4 Downfall ⚠️ Disrupted Market Perspective
🟩 False Resistance Zone
The marked resistance area (~109,000) has been breached multiple times with high volatility, suggesting weak resistance strength. Instead of rejecting price, this zone acts more like a liquidity trap — luring in sellers before price spikes higher. Expect fake-outs or bullish traps near this area.
🟨 Questionable Bearish Pattern
The projected zig-zag drop is speculative. The current market structure shows higher lows forming, hinting at potential accumulation rather than breakdown. If price consolidates above 108,000, this setup might flip bullish instead of heading to the 106,000 target.
🟥 Support Area Disruption
The labeled support zone around 106,000 may not hold if broken, but it has been respected multiple times in the past. If bulls defend it again, we might see a sharp rebound rather than a continuation downward. Therefore, the “Target” area could instead become a springboard for upward reversal.
BTC/USD SCENARIO Bitcoin is trying to break out of the 110,000
If we break out we will see a new high
If we don’t break it we could see 105k possibly 100k
BTC Storm of Consolidation, New Money, and Macro-PoliticsBitcoin at the Precipice: A Perfect Storm of Consolidation, New Money, and Macro-Political Tailwinds
In the intricate and often tempestuous world of digital assets, there are moments of frantic volatility and periods of eerie calm. Bitcoin, the undisputed king of cryptocurrencies, currently finds itself in one of these fascinating lulls—a state of high-altitude consolidation that is anything but sleepy. Trading just a whisper away from its all-time high, the asset is coiling like a spring, absorbing immense selling pressure from early adopters while simultaneously drawing in a new, powerful wave of buyers. This delicate equilibrium, however, is set against a backdrop of explosive potential catalysts. From tightening technical indicators screaming of an imminent breakout to the looming deadline of US tariffs, the vocal endorsement of tech titans, and the unprecedented entry of Bitcoin into the mainstream political arena, the stage is being meticulously set. The question on every analyst's and investor's mind is no longer if Bitcoin will make its next major move, but when, and just how monumental it will be. This is not just another market cycle; it is a convergence of forces that could propel Bitcoin toward price horizons that were once the domain of only the most fervent optimists.
The Anatomy of a Healthy Consolidation: Whales Recede as a New Foundation is Built
At first glance, a market that stalls just below its peak might seem like a sign of weakness, an indication that the bullish momentum has been exhausted. However, a deeper look into the current structure of the Bitcoin market reveals a picture of profound strength and maturity. This period of consolidation is characterized by a crucial and healthy rotation of ownership. The so-called "whales"—early investors and large-scale holders who have accumulated vast quantities of Bitcoin at much lower prices—are beginning to ease their holdings. This is not the panic-selling seen during bear market capitulations. Rather, it is a strategic and logical process of taking profits, de-risking portfolios, and realizing life-changing gains after a historic run.
Every Bitcoin sold by a whale must be bought by someone else, and the identity of these new buyers is what makes the current phase so compellingly bullish. The supply being released onto the market is not causing a price crash; instead, it is being steadily absorbed by a fresh cohort of participants. This new wave includes a diverse mix of players: retail investors who are gaining confidence as Bitcoin solidifies its mainstream status, smaller institutional players who are now more comfortable entering the market, and, most significantly, corporations that are beginning to view Bitcoin as a legitimate treasury reserve asset. This process is akin to the changing of the guard. The early pioneers are passing the baton to a new generation of holders who are establishing a new, higher cost basis. This dynamic is incredibly constructive for long-term price stability. It builds a robust and formidable wall of support at these elevated price levels, transforming what was once a speculative peak into a solid foundation for the next leg up.
Further evidence of this underlying strength can be seen in Bitcoin's recent weekly performance. The asset has managed to set another record high weekly close. In the world of technical analysis, a weekly close is considered far more significant than a brief, volatile intraday spike. An intraday high can be the result of a short-lived speculative frenzy or a liquidation cascade, but a high weekly close demonstrates sustained buying pressure and conviction over a longer duration. It signifies that, for seven straight days, buyers successfully defended higher price levels against sellers, ultimately winning the battle as the candle closed. This repeated ability to secure high weekly closes indicates that the market is systematically accepting and validating these new price territories, creating a psychological and technical launchpad for a future assault on all-time highs. Traders are now intensely focused on this dynamic, attempting to pinpoint the new, higher bottoms of this consolidation range, recognizing that these levels are likely to serve as the bedrock for the next major bull run.
The Technical Cauldron: Bollinger Bands Signal an Imminent and Violent Breakout
While the fundamental picture is one of healthy rotation, the technical charts are sending an even more urgent message: prepare for a massive move. Among the myriad of indicators used by traders, the Bollinger Bands are currently painting a particularly dramatic picture. Bollinger Bands consist of three lines plotted over a price chart. The middle band is a simple moving average, while the upper and lower bands are positioned at a set number of standard deviations away from the middle band. In essence, they are a direct measure of market volatility. When the market is volatile, the bands widen. When the market is calm and consolidating, the bands contract, or "squeeze."
Bitcoin is currently in the midst of one of the most significant Bollinger Band squeezes seen in recent history. The upper and lower bands have drawn incredibly close to one another, indicating that volatility has been wrung out of the market to an extreme degree. Historically, such periods of low volatility are the calm before the storm. A Bollinger Band squeeze is almost always resolved by a period of explosive, high volatility—a powerful breakout. The longer and tighter the squeeze, the more violent the subsequent price move tends to be. The indicator itself does not predict the direction of the breakout, but in the current context, the directional bias is overwhelmingly clear. With Bitcoin consolidating just shy of its all-time high after a powerful uptrend, and with the fundamental backdrop being so strong, the path of least resistance is overwhelmingly to the upside.
This technical setup creates a powerful psychological feedback loop. As more traders and algorithms spot the tightening bands, they begin to position themselves for the inevitable breakout. This builds a massive amount of potential energy within the market. When the price finally does break through the upper band, it can trigger a cascade of buy orders—from traders entering new long positions, to short-sellers being forced to buy back to cover their losing bets. This rush of buying pressure is what can turn a simple breakout into a parabolic, face-ripping rally.
The anticipation surrounding this move has led to some audacious price targets being discussed. Analysts are now contemplating the possibility of a "false move" to as high as $105,000. The term "false move" in this context is intriguing. It could imply a rapid, almost wick-like surge to that level, driven by extreme speculation and leverage, which might then be followed by a sharp correction to shake out the "paper hands" before a more sustainable climb resumes. Alternatively, it could simply be a way of expressing disbelief at the sheer velocity of the potential move. Whether the target is $105,000 or another figure, the underlying message from the charts is unambiguous: Bitcoin is on the verge of a big move, and the technicals strongly suggest it will be a powerful breakout to the upside, potentially ushering in a new phase of price discovery.
The Confluence of Catalysts: Tariffs, Politics, and The Musk Effect
A primed technical setup is potent on its own, but when combined with powerful external catalysts, it creates the recipe for a perfect storm. Bitcoin's next potential move is not just being driven by its internal market dynamics; it is being pulled forward by a confluence of macroeconomic and political forces that are aligning in its favor.
One of the most significant near-term catalysts is the looming US tariff deadline. Historically, periods of geopolitical tension and economic uncertainty have been incredibly bullish for Bitcoin. Tariffs, trade wars, and protectionist policies create instability in global markets and can erode the value and trust in fiat currencies. As nations engage in economic conflict, savvy investors and even central banks begin to look for non-sovereign, censorship-resistant stores of value to hedge their wealth. Bitcoin, with its decentralized nature and fixed supply, is the ultimate hedge against such fiat currency debasement and geopolitical turmoil. The impending tariff deadline is forcing a global conversation about the stability of the current financial system, and Bitcoin stands to be a primary beneficiary as capital seeks a safe haven from the storm.
Adding fuel to this fire is the upcoming "Crypto Week," a period of heightened focus on the industry through conferences, major announcements, and media coverage. These events act as a gravitational force, pulling the attention of the financial world toward the digital asset space. This concentrated attention almost always leads to increased trading volume and volatility. It creates a self-fulfilling prophecy where the expectation of big news and market moves encourages traders to participate, thereby creating the very volatility they anticipated.
Perhaps the most electrifying and unpredictable catalyst, however, is the re-emergence of Elon Musk's "love" for Bitcoin and the asset's dramatic entrance onto the main stage of American politics. Musk, with his colossal social media following, has a proven and unparalleled ability to influence market sentiment with a single post. His recent teasing of a "Pro-Bitcoin America Party" has sent shockwaves far beyond the crypto community. This move, whether serious or satirical, has injected Bitcoin directly into the heart of the US political discourse. It reframes Bitcoin not just as a financial asset, but as a political symbol—a representation of innovation, decentralization, and freedom from government control.
This has been met with a reaction from other major political figures, including Donald Trump, creating a fascinating push-and-pull. The fact that leading presidential candidates and political influencers are now debating Bitcoin's merits and role in the nation's future is a monumental step in its journey toward mainstream legitimacy. It forces the public and policymakers to take it seriously. This political theater creates an environment where assets perceived as being aligned with pro-growth, pro-innovation, and pro-freedom ideologies can thrive. The emergence of a "BTC Bull Token" or similar concepts tied to this political momentum underscores the new reality: Bitcoin is no longer just a tech story; it is a powerful political and cultural movement, and this new dimension is likely to attract a wave of capital from those who align with its burgeoning ideology.
The Institutional Stamp of Approval: A Corporate Treasury Revolution
While retail excitement and political drama provide the fuel, the institutional adoption of Bitcoin provides the solid, unshakeable foundation for its long-term trajectory. The most powerful recent example of this trend is the announcement from Genius Group, a publicly traded education technology company, that it is increasing its Bitcoin treasury target to a staggering 10,000 BTC. This is not a speculative trade; it is a profound strategic shift in corporate treasury management.
This decision signifies that corporate boards and CFOs are beginning to understand and act upon Bitcoin's value proposition as a superior treasury reserve asset. In an era of persistent inflation and low-to-negative real yields on traditional assets like government bonds, holding large amounts of cash on a balance sheet is a guaranteed way to lose purchasing power. By allocating a portion of its treasury to Bitcoin, Genius Group is taking a proactive step to protect its shareholders' value from the ravages of monetary debasement. It is a declaration of confidence in Bitcoin's long-term potential as a reliable store of value.
The importance of such a move cannot be overstated. It provides a powerful stamp of approval and a case study for thousands of other corporations around the world. When one publicly traded company makes such a bold move and outlines its rationale, it normalizes the strategy. Other CFOs, who may have been hesitant, now have a blueprint to follow and a precedent to point to when presenting the idea to their own boards. This has the potential to unlock a veritable floodgate of corporate capital. Even a small, single-digit percentage allocation from the treasuries of the S&P 500 companies would represent hundreds of billions of dollars of new, sustained buying pressure for Bitcoin. The move by Genius Group is not an isolated event; it is the leading edge of a seismic shift in how the corporate world perceives and utilizes money.
Conclusion: The Dawn of a New Epoch
Bitcoin stands at a historic inflection point. The current period of quiet consolidation is deceptive; beneath the surface, a powerful confluence of forces is converging to launch the asset into its next major chapter. The market's internal structure has never been healthier, with the holdings of early whales being patiently absorbed by a new and committed class of buyers, building a formidable price floor far above previous highs. The technical charts are screaming of an imminent and powerful breakout, with the tightening Bollinger Bands signaling a massive release of energy that heavily favors the upside.
Layered on top of this potent technical and structural setup is a perfect storm of external catalysts. The specter of global economic instability driven by tariffs, the focused attention of a "Crypto Week," the unparalleled influence of figures like Elon Musk, and the shocking but legitimizing entry of Bitcoin into the partisan political arena are all acting as powerful tailwinds. This is all underpinned by the quiet but revolutionary trend of institutional and corporate adoption, which promises to bring waves of new capital into the asset for years to come.
The consolidation will soon end. The question is not about direction, but about magnitude. The forces at play are no longer just about market cycles; they are about a fundamental repricing of a global, non-sovereign asset in a world grappling with economic and political uncertainty. The stage is set for a breakout that could not only shatter previous all-time highs but could also permanently elevate Bitcoin's status, solidifying its role as a cornerstone of the 21st-century financial and political landscape.
7.7 Analysis of the latest BTC trend and operation layout📊 Cautious wait-and-see strategy (Recommendation index ⭐️⭐️⭐️⭐️⭐️)
📰 News information:
1. Digital Market Asset Transparency Act
2. Anti-CBDC Regulation Act
3. US Stablecoin Innovation Act
📈 Technical Analysis:
At present, the price of BTC is around 109,000, and the overall narrow fluctuation pattern continues. The market as a whole lacks clear direction. However, it is worth noting that the trading volume has dropped to 30.1 billion US dollars, which has further shrunk compared with the previous day, reflecting a decline in market participation.
In my opinion, the driving factors of the market include the following:
1. The continued activity of ancient whales has attracted attention
2. The technical side shows that the momentum is weakening
3. Market sentiment has turned neutral
4. ETF fund inflows remain strong
5. The "Crypto Week" policy catalyst is coming
Currently, BTC continues to consolidate within the upward trend line, but the momentum indicator shows fatigue, the 4H Bollinger Bands shrink, and the price is running near the middle track of 108,400. Enter the market cautiously during the day and pay attention to the support of 107,000
🎯 Trading Points:
SELL 109,000-110,000
TP 107,500-107,000
In addition to investment, life also includes poetry, distant places, and Allen. Facing the market is actually facing yourself, correcting your shortcomings, facing your mistakes, and being strict with yourself. I share free trading strategies and analysis ideas every day for reference by bros. I hope my analysis can help you.
BITSTAMP:BTCUSD

Bitcoin May See Short-Term Pullback After Hitting $108,000📊 Market Overview:
Bitcoin surged to $108,000 amid renewed risk-on sentiment, a softer US dollar, and slightly declining bond yields. However, weekend trading sees lower liquidity, and some profit-taking has emerged. Traders are also cautious ahead of next week’s Fed-related news.
📉 Technical Analysis:
• Key Resistance: $108,500 – $110,000
• Nearest Support: $106,200 – $105,500
• EMA 09 (1H): Price is above EMA 09, indicating bullish momentum remains.
• Candlesticks & Volume: Doji candle and falling volume in 1H → suggests weakening upside momentum and possible retracement.
📌 Outlook:
Bitcoin may face a short-term pullback if it fails to break above $108,500 and no fresh catalysts emerge. Holding above $106,200 would keep the broader bullish structure intact.
💡 Suggested Trade Setup:
🔻 SELL BTC/USD at: 108,200 – 108,500
🎯 TP: 106,800
❌ SL: 109,300
🔺 BUY BTC/USD at: 106,200 – 105,500
🎯 TP: 107,800
❌ SL: 104,800

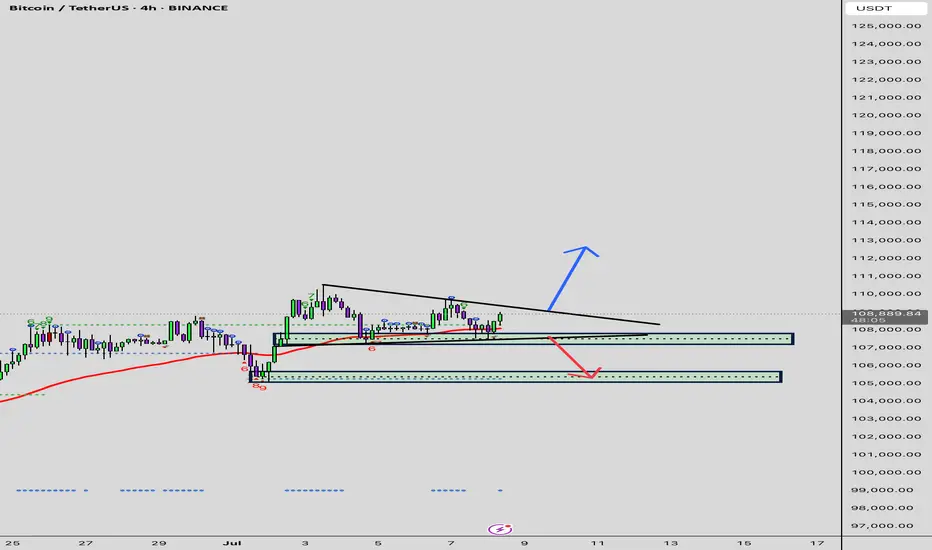
BTCUSDT – Accumulation Confirmed? Wyckoff Blueprint Playing Out Bitcoin continues to compress inside a defined range, resting above both a rising trendline and a former resistance turned support zone. This structure fits cleanly within a Wyckoff-style Accumulation Phase (B-C).
We’re now at a critical moment where smart money may be absorbing supply, preparing for the next phase.
🔍 Key Observations:
Range-bound price action with higher lows and muted volume
Spring-like wick and recovery from the bottom of the range
Support holding at prior breakout zone and ascending trendline
Structure shows signs of stealth accumulation with a possible breakout ahead
Sideways movement with fading volatility
Gradual compression within the range
Strong support defended multiple times (might make the support weaker as well !)
A potential spring/retest event may already be in play
You’ll see fakeouts, wicks, and hesitation in this phase — designed to trap weak hands. But the underlying behavior points to preparation, not distribution.
The quiet before the markup. Let the market reveal its hand. 📈


BTC SCALP Tradeas long as BTC doesn't closes below the mentioned area on 1hr tf, it will bounce and hit the fresh sellers SL. Once we have a closing below the area it can take correction upto 98-97K area.

BTC shorting opportunity comes againBTC climbed above 108000 again, and the short-term bullish power was slightly stronger. According to the current strength, BTC still has room for growth, but it is still under pressure in the 109000-110000 area in the short term; if there is no major positive news, BTC may find it difficult to break through the resistance area in the short term under the current conditions, and may even experience stagflation and retreat again after approaching the resistance area.
Therefore, I think shorting BTC with the help of the resistance area is still the first choice for short-term trading. We can boldly short BTC in the 108500-109500 area and look towards the target area around 106000 again.

BTC Bulls Target $111,653, Is This the Next Explosive BreakoutThe BTCUSDT 4-hour chart is showing a clearly bullish structure. After consolidating below the $108,664–$107,800 resistance for several weeks, Bitcoin finally broke above this area with a strong impulsive move, confirming the zone as a new support. This breakout coincides with improving market sentiment, especially after Metaplanet’s $108 million purchase of BTC and a surge in ETF inflows, which have been helping Bitcoin reclaim levels above $109,000. The price is currently consolidating just above the breakout area, indicating that buyers are defending this zone aggressively.
Resistance Level 1, around $110,254, is the first significant barrier and aligns with the area that rejected price several times in late May. If this level is broken, the next target sits at Resistance Level 2 near $111,653, which was the major swing high established in early May. Holding above the current support is critical, as a decisive 4-hour close below $107,440 would invalidate this bullish scenario and likely trigger a deeper retracement.
The recent price behavior suggests a potential ascending triangle breakout retest, a classic continuation pattern where buyers step in on each dip. Momentum remains strong, and the risk/reward profile favors long setups as long as the higher-low structure is preserved.
Trade Setup (Bullish Idea)
Entry Zone: $108,700–$109,000 (on a confirmed retest of support)
Stop Loss: $107,440 (beneath the invalidation zone)
Take Profit Targets
o TP1: $110,254
o TP2: $111,653
The setup offers an estimated 2.4–2.7 risk/reward ratio, depending on precise entry and execution. As always, it’s recommended to wait for confirmation candles or wicks rejecting the support zone before entering.
If the breakout holds and volume expands on the push through TP1, Bitcoin could quickly revisit the $112,000 area in line with broader market optimism and institutional buying. Just be aware of the invalidation level, as any breakdown below $107,440 could trigger a fast move back to prior range lows.

BITCOIN Short From Resistance!
HI,Traders !
#BITCION went up sharply
Made a retest of the
Horizontal resistance level
Of 110026.5 from where we
Are already seeing a local
Bearish reaction so we
Are locally bearish biased
And we will be expecting
A local bearish correction !
Comment and subscribe to help us grow !

Bitcoin Eyes Breakout if Clears $114,000📊 Market Overview:
• Bitcoin trades around $109,350, with an intraday high near $109,610
• Rosenberg Research notes BTC could rally ~6% to clear $114,000, potentially triggering a 25% rise to $143,000 on the back of ETF inflows, a weaker dollar, and Fed rate cut expectations
📉 Technical Analysis:
•Key Resistance: ~$114,000; followed by the psychological $112,000 zone .
•Nearest Support: $107,000 (prior highs/descending channel bottom) and key floor at $100,000
•EMA Levels:
o Price consolidates near 50-day EMA ($105,800), a crucial confluence zone
•Candlestick/Momentum:
o RSI near 50 (neutral),
o Flag pattern breakout suggests continuation potential
📌 Viewpoint:
Bitcoin may extend its rally if it breaks above $114,000, targeting $137,000–$143,000. If rejected, a pullback toward $107,000 is likely before bouncing.
💡 Suggested Trading Strategy
SELL BTC/USD at: $113,500–$114,000
🎯 TP: $110,000–$110,500
❌ SL: $114,500
BUY BTC/USD at: $107,000–$108,000
🎯 TP: $112,000–$113,000
❌ SL: $106,000

break, BTC soon reaches new ATH💎 Update Plan BTC after NFP (July 3)
Notable news about BTC:
Bitcoin (BTC) recovered to $ 109,000 on Wednesday when the US agreement with Vietnam and the increase in global M2 supply of M2 money has promoted an increase in open interest rates (OI), soaring to 689.78 thousand BTC worth about $ 75 billion. The cryptocurrency market in general has increased the price along with BTC, with leading altcoins, Ethereum (ETH), XRP and Solana (SOL) increased by 7%, 3%and 4%respectively.
Bitcoin, the market cryptocurrency market increased by the trade agreement with Vietnam and M2 money supply soared
The cryptocurrency market has recovered on Wednesday, an increase of 2% to regain the market capitalization of $ 3.5 trillion.
Technical analysis angle
First, congratulate the investors who follow the plan when we previously traded according to the model and had a short signal at 108k and took profit and then Long in the 106k area.
Currently, BTC is in wave 5 and is trapped in the Fibonanci area of 2,618 golden ratio around the price of 109k, this is also the threshold of the price of investors who are under pressure before the price area goes to 112k
The 112k region is a psychological area of profit and will appear on the 109k sales situation before the BTC price may rise further in the last 6 months of the year.
Please follow the channel to receive accurate scenarios about gold and BTC /-Teart /-heart
==> Comments for trend reference. Wishing investors successfully trading

Breaking: Bitcoin Just Broke the $110k Resistant Next Top $115kThe price of the first crypto currency ever created saw a noteworthy uptick to reclaim the $110k price point however, the move was short-lived as the asset retraced to $109k mark but present price chart depicts a move to the $115k resistant point in the short term.
With the Relative strength index (RSI) at 63, Bitcoin might be inches away from claiming the $115k pivot amidst build up momentum and institutional adoption. further bullish metrics include the asset trading above the 50, 100 and 200-day Moving Averages (MA) respectfully.
Bitcoin Supply Shock Is No Longer a Theory, But a Reality
In the intricate and often frenetic world of digital assets, the market is constantly sending signals. Some are loud, ephemeral flashes of volatility that capture headlines for a day. Others are quiet, seismic shifts that build slowly beneath the surface, unnoticed by the masses until they erupt with earth-shattering force. Today, the Bitcoin network is broadcasting one of these profound, underlying signals. It speaks of a disappearance, a vanishing act on a scale never before seen, pointing toward a supply shock so significant that it threatens to redefine the very concept of price discovery for the world’s premier cryptocurrency.
The paradox currently facing market observers is the disconnect between Bitcoin’s somewhat range-bound price, which has struggled to decisively conquer the territory above $120,000, and the tectonic movements occurring in its fundamental market structure. While the price action might suggest a market in equilibrium, a state of indecisive calm, the data tells a story of immense and growing tension. It is a story of a collision course between two unprecedented forces: a relentless, programmatic wave of institutional demand and a rapidly dwindling, fiercely guarded supply.
The central piece of evidence, the smoking gun for this impending crisis, is the state of Bitcoin reserves on cryptocurrency exchanges. These platforms, the bustling marketplaces where buyers and sellers meet, have seen their Bitcoin inventories plummet to a seven-year low. Less than 15% of the total circulating Bitcoin supply now resides on these exchanges, a figure that is as statistically stark as it is historically significant. This isn’t merely a data point; it is a profound statement of intent from the global cohort of Bitcoin holders. It signifies a monumental shift from short-term speculation to long-term conviction, a collective decision to withdraw assets from the realm of immediate liquidity and into the deep, fortified vaults of cold storage. This great disappearance is the quiet prelude to a very loud event, and to understand its implications, one must dissect the powerful forces of both supply and demand that are pulling the market to its breaking point.
The Vanishing Act: Where Has All the Bitcoin Gone?
To grasp the gravity of the dwindling exchange reserves, one must first understand the role of an exchange in the life cycle of a Bitcoin. An exchange is a trading floor. Assets held there are, by their very nature, liquid and available for sale. A holder who moves their Bitcoin onto an exchange is signaling an intent to trade or sell, either immediately or in the near future. Conversely, moving Bitcoin off an exchange and into a personal, self-custodied wallet—often called cold storage—is a deliberate act of preservation. It is a declaration that the owner has no immediate intention of selling. They are choosing to become a long-term holder, a saver, effectively removing their coins from the active, tradeable supply.
For years, the flow of Bitcoin onto and off of exchanges has served as a reliable barometer of market sentiment. During the euphoric peaks of past bull markets, a predictable pattern emerged: as prices soared, a flood of Bitcoin would move onto exchanges as long-term holders finally decided to take profits. This influx of supply would help to satisfy the frenzied buying demand, eventually capping the rally and leading to a market correction.
This cycle, however, is fundamentally different. The opposite is happening. Despite prices reaching new all-time highs, the flow has been overwhelmingly outward. Coins are leaving exchanges at a historic pace, creating a supply-side vacuum. This exodus is not a new phenomenon, but the acceleration over the past 18 months has been breathtaking. It reflects a maturing market and a hardened investor base that has learned the lessons of previous cycles. They have witnessed Bitcoin’s resilience, its ability to weather brutal bear markets and emerge stronger each time. They are no longer content with selling for a 5x or 10x profit, only to watch the asset climb another tenfold in the subsequent years. They have transitioned from treating Bitcoin as a speculative trade to embracing it as a long-term savings technology, a digital store of value in an increasingly uncertain macroeconomic world. The coins are not lost; they have simply gone home, locked away by owners who have no interest in selling at today’s prices.
The Wall Street Leviathan: A New and Insatiable Source of Demand
While the available supply of Bitcoin has been quietly disappearing into private wallets, a new and powerful predator has entered the ecosystem, armed with an insatiable appetite. The launch of spot Bitcoin Exchange-Traded Funds (ETFs) in the United States marked the single most significant structural change in the history of the Bitcoin market. These regulated financial products, offered by the largest asset managers in the world, have constructed a permanent, one-way bridge connecting the traditional financial system to the digital asset space.
This bridge is not for casual tourism; it is a superhighway for capital. The ETFs, led by BlackRock’s behemoth iShares Bitcoin Trust (IBIT), have unleashed a torrent of institutional and retail money that is systematically draining the remaining available supply. The mechanics of these ETFs are crucial to understand. Unlike futures-based products, a spot ETF must acquire and hold the underlying asset—in this case, real Bitcoin—to back the shares it issues to investors. This means that for every dollar that flows into an ETF like IBIT, its managers must go into the open market and buy a corresponding amount of Bitcoin.
The scale of this operation is staggering. In a stunning testament to the demand for this new product, BlackRock’s Bitcoin ETF has, in its short 18-month existence, begun to generate more revenue from annual fees than its long-established and immensely popular S&P 500 fund. This is not a niche product for crypto enthusiasts; it is a mainstream financial blockbuster, attracting billions from investors seeking a simple, regulated way to gain exposure to Bitcoin.
This creates a relentless, programmatic buying pressure that the market has never before had to absorb. Every single trading day, the ETFs collectively purchase a significant amount of Bitcoin. This demand is constant and largely price-agnostic. It is driven by asset allocation decisions, not short-term market timing. This programmatic buying acts like a giant hydraulic pump, sucking up any loose supply available on exchanges. The daily demand from these Wall Street giants often outstrips the new supply of Bitcoin created by miners, creating a structural deficit that can only be filled by one source: the existing coins held by others. And as we’ve seen, those holders are increasingly unwilling to part with their assets.
The Diamond-Handed Super-Majority: A Trillion-Dollar Standoff
The collision between the insatiable demand of the ETFs and the shrinking available supply raises a critical question: why aren't the existing holders selling? With so much new money flooding into the market, basic economics would suggest that the rising price should entice current owners to sell and realize their gains. Yet, the data reveals a fascinating psychological standoff.
According to research from the on-chain analytics firm Glassnode, a "super-majority" of Bitcoin holders are currently sitting on a colossal $1.2 trillion in unrealized profits. This means that a vast portion of the network acquired their coins at prices far below the current level and are deep in the green. In any other market, such a massive overhang of profit would be seen as a significant risk, a powder keg of potential sell pressure waiting to be ignited.
But in the world of Bitcoin, it has become a fortress of conviction. Glassnode’s analysis concludes that the current price, even in the six-figure range, "is not compelling enough for investors to continue selling." This is a revolutionary insight into the mindset of the modern Bitcoin investor. Their price targets have shifted dramatically. They are not looking to sell at $120,000 or even $140,000. For many, these levels are seen as mere stepping stones on the path to a much higher valuation, one that properly reflects Bitcoin’s role as a global, non-sovereign store of value.
Further research into profit-taking behavior confirms this trend. The amount of realized profit—that is, coins being sold at a gain—in the current cycle has yet to match the levels seen during the peak of the 2024 rally. This suggests that the holders who were willing to sell at those prices have already done so. The remaining cohort is composed of the most steadfast believers, the "diamond hands," who are holding out for a much more significant repricing. Some analyses suggest that the Bitcoin price would notionally need to rise another 30%, toward the $140,000 mark, just to reach a point where this cohort even begins to feel tempted to part with their holdings in a meaningful way. This creates a powerful reflexive loop: the less they sell, the less supply is available, and the more explosive the potential price move when demand continues to pour in.
The Macroeconomic Perfect Storm
The conviction of Bitcoin holders and the flood of institutional capital are not occurring in a vacuum. They are a direct response to a global macroeconomic environment that is creating a perfect storm for a hard, scarce asset. The primary driver of this is the unprecedented expansion of the global money supply. The M2 money supply—a broad measure of currency that includes cash, checking and savings deposits, and money market funds—has reached a record high.
Governments and central banks around the world have engaged in years of quantitative easing and fiscal stimulus, effectively printing trillions of dollars to prop up their economies. While often necessary in the short term, this relentless monetary expansion has a corrosive long-term effect: it debases the value of fiat currencies. As the supply of dollars, euros, and yen increases, the purchasing power of each individual unit decreases.
In this environment, rational economic actors begin to search for a safe harbor, a place to protect their wealth from the slow-motion erosion of inflation. Historically, this role was filled by assets like gold. Today, a growing number of individuals, corporations, and even nation-states are turning to Bitcoin. Its mathematically enforced scarcity—a hard cap of 21 million coins that can never be altered—stands in stark contrast to the infinite printability of government-issued money.
This narrative has been supercharged by the recent performance of the US dollar itself. The world’s reserve currency experienced a dramatic 10.8% drop in its worst first-half performance since 1973, signaling a potential shift in global currency dynamics. As the dollar weakens, assets priced in dollars become cheaper for foreign investors, and the appeal of a non-sovereign alternative like Bitcoin grows. This macroeconomic backdrop provides the fundamental "why" behind the Bitcoin trade. It is no longer just a technological curiosity or a speculative bet; it is increasingly viewed as an essential component of a diversified portfolio, a hedge against the very real risks of monetary debasement and geopolitical instability. It is this understanding that underpins bullish price targets that sit around $170,000 and beyond.
Navigating the Uncomfortable Calm
With such a powerfully bullish confluence of factors, the question remains: why has Bitcoin been seemingly stuck in a consolidation pattern, unable to break out and sustain a move into the higher price ranges? Why did the market see a wobble that brought the price down to $105,000, causing anxiety among newer entrants?
The answer lies in the nature of market equilibrium. Even in the most ferocious bull market, there are always sellers. Miners, who must sell some of their newly minted Bitcoin to cover their operational costs, represent a constant source of supply. Early investors may take some profits to diversify their wealth. Short-term traders will try to play the ranges, and even some of the capital in the ETFs will inevitably be redeemed, forcing the funds to sell a corresponding amount of Bitcoin.
The current price range below $120,000 represents the battleground where the relentless, programmatic buying from the ETF leviathan is meeting and absorbing this natural, daily sell pressure. The market is in a state of accumulation and consolidation, building a strong base of support before its next major move. The fact that crypto market sentiment has held steady, even during price dips and the start of the third quarter—a period historically known for its weak seasonality—is a testament to the market's newfound maturity. The "weak hands," or investors with low conviction, have likely been shaken out, leaving a stronger, more resilient base of holders.
This period of sideways price action is likely to be deceptive. The historical seasonality of Bitcoin suggests that summer can often be a period of lackluster performance, lulling market participants into a state of complacency. The idea that Summer 2025 will "catch everyone off guard" stems from this dynamic. While the price chart may look boring, the underlying supply and demand forces are becoming ever more tightly coiled. The pressure is building, and the longer the market consolidates, the more violent the eventual breakout is likely to be.
The Inevitable Collision
The story of Bitcoin in 2025 is the story of an inevitable collision. On one side, you have the most powerful force of demand the asset has ever known: a fleet of Wall Street ETFs, led by the world's largest asset manager, programmatically buying Bitcoin every single day. This demand is structural, relentless, and here to stay.
On the other side, you have the most convicted group of holders in Bitcoin’s history. They are a super-majority, sitting on over a trillion dollars in profit, who have explicitly signaled through their actions and on-chain data that they have no intention of selling at these prices. They are withdrawing their coins from the market at a historic rate, creating a supply desert.
The dwindling reserve of Bitcoin on exchanges is the ticking clock in this grand drama. It is the visible measure of the supply shock in progress. Each day, the ETFs arrive in the market to fill their orders, only to find the shelves are increasingly bare. The deficit they create must be filled by prying coins from the diamond hands of long-term holders. But those holders have made their price clear, and it is not $120,000.
Therefore, the current market is not in a state of calm, but in a state of profound tension. It is the quiet moment before the lightning strike. The forces of an institutional-grade demand shock and a historic holder-induced supply squeeze are on a direct and unavoidable collision course. The question is no longer if this tension will resolve, but when and with what magnitude. The great disappearance of Bitcoin from the open market is the final signal that the supply problem is no longer a distant forecast. It is here, and it is about to change everything.
Long positions have achieved profits, BTC market outlook📰 News information:
1. Pay attention to the trend of gold and US bonds
📈 Technical Analysis:
At present, BTC has rebounded and profited, and rebounded to around 108,000 again. 109,000 is also the upper track of the Bollinger Band. There is a certain suppression in the short term. Before the suppression fails to break through effectively, BTC may still fall into a weak and volatile market. If BTC hits resistance and pressure above 108,000-109,000 during the day, you can consider shorting. In view of the current volatile market, everyone must strictly control their positions, use leverage prudently, and do a good job of risk management to cope with market uncertainties.
🎯 Trading Points:
SELL 108,000-109,000
TP 107,000-106,000-105,000
In addition to investment, life also includes poetry, distant places, and Allen. Facing the market is actually facing yourself, correcting your shortcomings, confronting your mistakes, and strictly disciplining yourself. I hope my analysis can help you🌐.
TVC:GOLD OANDA:XAUUSD FX:XAUUSD FOREXCOM:XAUUSD PEPPERSTONE:XAUUSD FXOPEN:XAUUSD

BTC - Daily Chart - Bull flag route 7/1/2025July 1st, 2025
BTC - Daily Chart
A bull flag route = Two Scenarios
1. Breakout - UP
- Retrace before the $105k area
- Consolidate
- Break out the top line
SL $104k
TP1 @ 108k
TP2 @ 111k
Final TP @ 113k NEW ATH
2. Fail support - DOWN
- 105k fail to support
- Aim for the button of the flag for support
SL $106k
TP @100k
Final TP @96k

Short BTC, it is about to retrace and test 100000 again!As BTC gradually fell back, the rebound did not stand above 110,000 in the short term, proving that there is strong selling pressure above, and the trend line formed by the technical high point 111,000 and the second high point 110,000 formed an important resistance area, which limited the rebound space of BTC and strengthened the demand for BTC's short-term retracement.
According to the current trend, the short-term oscillation bottom area of 106,000 may be broken at any time. Once it falls below the oscillation area, it may arouse a certain degree of profit-taking chips and stimulate BTC to accelerate its decline. I think BTC will at least test the 105,000-104,000 area again during the retracement, and may even test the 100,000 integer mark again.
Therefore, shorting BTC is still the preferred option for current short-term trading.
Consider shorting BTC in the 108,000-109,000 area, and the target area in the short term is 104,500-103,500. After breaking this area, the target can be extended to 101,000-100,000.
BINANCE:BTCUSDT BINANCE:BTCUSDT BITSTAMP:BTCUSD

BITCOIN - Price can continue grow inside flat to $107933 level#BTC
The price is moving within a descending channel on the 1-hour frame and is expected to break and continue upward.
We have a trend to stabilize above the 100 moving average once again.
We have a downtrend on the RSI indicator that supports the upward move with a breakout.
We have a support area at the lower boundary of the channel at 106500, acting as strong support from which the price can rebound.
We have a major support area in green that pushed the price upward at 106000.
Entry price: 106736
First target: 106996
Second target: 107434
Third target: 107933
To manage risk, don't forget stop loss and capital management.
When you reach the first target, save some profits and then change your stop order to an entry order.
For inquiries, please comment.
Thank you.

BTCUSDT SHORT SIGNAL Setup Type: Liquidity Trap & Distribution
Trade Idea (SHORT):
Entry Zone: $108,000 – $110000
Stop Loss: Above $113000
Take Profit Targets:
TP1: $104,000
TP2: $100,000
TP3: 98000
TP4: 74000
This analysis is for educational purposes only and does not constitute financial advice.
Always do your own research and apply proper risk management.
Trading involves risk, and you are solely responsible for your decisions.
Use this information as a guide — not a guaranteed outcome.
Wait for clear confirmation before executing any trade.

BTCUSD Trade Setup - 28/Jun/2025Hi Traders,
I expect this pair to go Down after finishing the correction.
1) Need to wait for market to show changing of the direction.
2) The first reaction zone foe me will be at 95000 level followed by 89000 level.
3) Need to observe the characteristic of the move coming down in order to understand if market is planning to go up without coming to those levels.
Current expectation for investing is to see market dropping to 89000 level and then start to look for entry.
I only invest in BTC so no shorts for me but market shows potential to give a reversal soon and give a decent down move.
