FUNUSDT Forming Falling WedgeFUNUSDT is currently forming a classic falling wedge pattern, which is widely recognized in technical analysis as a bullish reversal signal. As the price continues to compress within the wedge while holding higher volume on green candles, it suggests growing accumulation by investors. A breakout from this pattern could signal a significant price reversal, with an anticipated gain of 140% to 150%+ based on historical wedge breakout projections. The setup is becoming increasingly favorable for swing traders and mid-term holders.
FUNToken is drawing renewed investor attention due to its integration in blockchain gaming and online entertainment sectors. As demand for decentralized platforms and provably fair gaming continues to grow, FUNToken offers a well-positioned use case. The token has a history of sharp rallies following prolonged consolidation, and the current chart formation indicates that another major move may be imminent. Moreover, sentiment across social and community platforms around FUNToken is turning positive, boosting its speculative momentum.
The technical structure of the chart aligns with increasing trading volume and consistent support holding at key levels, signaling strong underlying demand. The falling wedge is narrowing, suggesting a potential imminent breakout. Once the upper resistance of the wedge is breached with strong volume, price could accelerate rapidly toward upper Fibonacci extension levels, aligning well with the projected 140% to 150% upside potential.
Given these factors, FUNUSDT stands out as a promising opportunity in the altcoin market. Traders and investors watching for strong technical breakouts with real use-case utility will likely find FUN appealing at current levels. Keep an eye on volume spikes and confirmation closes above the wedge for potential entry points.
✅ Show your support by hitting the like button and
✅ Leaving a comment below! (What is You opinion about this Coin)
Your feedback and engagement keep me inspired to share more insightful market analysis with you!
Btctrade

AXLUSDT Forming Descending Wedge bullishAXLUSDT is currently showing strong bullish signals after consolidating at a significant support level, with a notable uptick in trading volume. This renewed volume interest often precedes a breakout move, and the technical structure is shaping up for a potential surge. With momentum building and price action tightening, a projected gain of 60% to 70% is realistically within reach in the short to mid-term. This aligns well with historical price behavior and upcoming support-to-resistance flips.
Axelar (AXL) continues to attract investor interest due to its foundational role in cross-chain communication and interoperability. As more blockchains develop in silos, the need for protocols like Axelar grows. Its ability to facilitate seamless transfers across multiple chains makes it a strong contender in the next wave of infrastructure-focused crypto projects. Market participants are increasingly positioning themselves in utility-driven tokens like AXL that solve real scalability and connectivity problems in DeFi and the broader crypto ecosystem.
From a technical perspective, AXLUSDT is forming a bullish continuation pattern, suggesting that the recent consolidation is simply a pause before another impulsive leg to the upside. The presence of strong support zones, combined with increased volume and investor sentiment, makes this a high-probability setup for breakout traders and swing investors alike. If bullish momentum continues, the upside targets fall well within the 60% to 70% projected gain range.
Traders should keep a close watch on breakout confirmation signals and volume spikes, which could mark the start of a sustained bullish rally. As adoption and attention around cross-chain solutions grow, AXL is likely to see further market traction and price appreciation.
✅ Show your support by hitting the like button and
✅ Leaving a comment below! (What is You opinion about this Coin)
Your feedback and engagement keep me inspired to share more insightful market analysis with you!

AVAXUSDT Forming Bullish reversalsAVAXUSDT is currently positioned at a major demand zone that has acted as strong support multiple times in the past. This area between $17 and $20 has historically triggered bullish reversals, and recent price action shows a potential bottoming pattern forming within this zone. The market has responded positively with a slight uptick in volume, indicating renewed buying interest from both retail and institutional investors. This setup could be the beginning of a sharp bullish rally, especially if the price holds above the support and breaks the near-term resistance levels.
Avalanche (AVAX) continues to attract investor attention due to its rapidly growing ecosystem and increasing adoption across DeFi, NFTs, and Web3 projects. As blockchain infrastructure becomes more critical, AVAX stands out with its high throughput and low-cost transactions, making it a competitive choice for developers and users. The network has seen consistent upgrades and ecosystem expansion, which boosts long-term investor confidence. From a technical standpoint, the current structure resembles a classic accumulation range with a breakout potential pointing toward a 90% to 100% gain in the coming weeks.
If AVAX can reclaim and hold above the $22–$23 level, it would likely trigger a strong impulsive move toward the $42–$45 target range. The risk-reward ratio remains highly favorable for swing traders and position traders aiming to capitalize on this potential reversal. The expected upside is clearly illustrated on the chart, and with broader market sentiment slowly shifting bullish again, AVAX could be one of the top performers in this cycle.
With confluence from strong technical support, solid fundamentals, and increasing investor interest, AVAXUSDT is setting up for what could be a major bullish leg. Traders should keep a close eye on breakout confirmation and volume expansion for entry signals.
✅ Show your support by hitting the like button and
✅ Leaving a comment below! (What is You opinion about this Coin)
Your feedback and engagement keep me inspired to share more insightful market analysis with you!

Pay close attention to LMACD in the weekly!Once we cross LMACD in the weekly it would be dangerous to stay in. Make sure to take some profits once we are getting close to October and before LMACD crosses to the downside

Technical analysis of BTC contracts (outlook for next week)Technical analysis of BTC contract on June 7 (next week outlook):
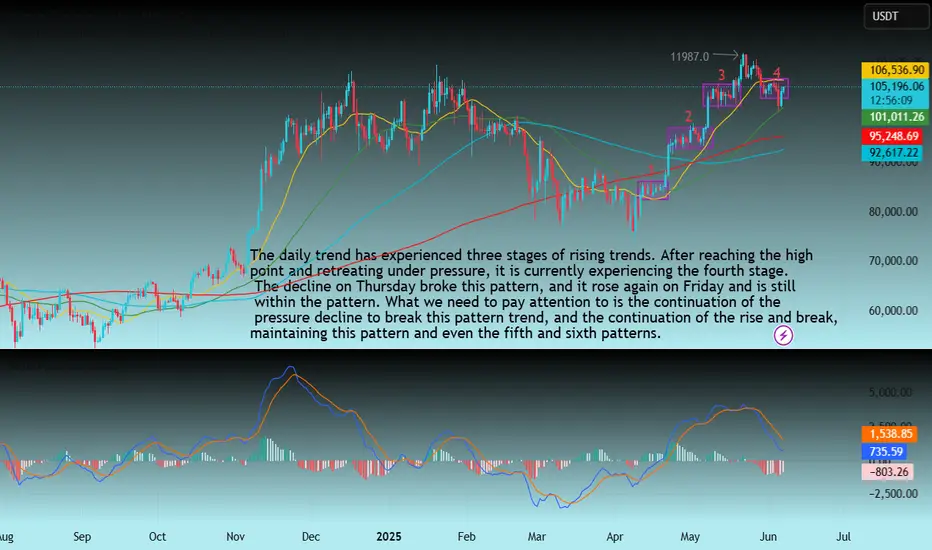
The weekly trend, after the price hit the high point of 112000 area, it retreated under pressure. The current K-line pattern is negative, but the price is still at a high level, which also exacerbates the overall trend of volatility. The daily price was fluctuating downward before Friday. The impact of yesterday's data caused the price to rise, which seemed to break this trend, and it also became contradictory. The technical indicators of the four-hour chart and the hourly chart changed very quickly, and there was no reference signal for the medium and long term; in general, the current trend will continue the oscillating pattern, with the upper pressure position in the 107000 area and the low point support position in the 100600 area;
EDUUSDT Forming Descending TriangleEDUUSDT has recently broken out of a descending triangle pattern on the daily timeframe, which is typically a bullish signal when confirmed with volume. The breakout has occurred with notable strength and solid green candle momentum, indicating a potential trend reversal and the beginning of a strong upward move. With price currently trading near $0.1499, this technical breakout opens the door for a projected gain of 60% to 70%+ in the coming days or weeks.
EDU, the native token of the Open Campus project, is gaining attention as the Web3 education narrative grows stronger. As traditional sectors like education integrate blockchain, EDU stands out as a project with real-world utility and adoption potential. The fundamentals are aligning well with the technical picture, and the increased investor interest is starting to reflect in both volume spikes and social media chatter.
If EDUUSDT maintains support above the breakout trendline, traders could see a continuation toward the $0.25 to $0.27 region — aligning with the chart projection of nearly 80% upside. This setup is further supported by increasing market sentiment, and EDU’s strategic partnerships in the education sector make this move fundamentally sound.
This is a high-potential setup for traders looking to ride breakout momentum in trending altcoins. EDU is not just riding the wave of hype but is backed by utility, strong technical structure, and market interest — making it a standout in the current altcoin rotation.
✅ Show your support by hitting the like button and
✅ Leaving a comment below! (What is You opinion about this Coin)
Your feedback and engagement keep me inspired to share more insightful market analysis with you!

Bitcoin Prediction - WARNING - Short Set-up Looming? We are spectating something serious on Bitcoin looming right now! Confirmations explained in the video!

BTC-----Sell around 104000, target 102000 areaTechnical analysis of BTC contract on June 6:
Today, the large-cycle daily level closed with a big negative line yesterday, the K-line pattern continued to fall, the price was below the moving average, and the attached indicator was dead cross. The large trend of falling again appeared to be advantageous. The price continued to break the previous low position, and the upward stage trend was also broken, so the market outlook will also fluctuate downward; the short-cycle hourly chart of the US market fell sharply, and the low point touched the 100300 area. The price supported the rebound in the morning. The current K-line pattern continued to rise, and the attached indicator was golden cross, but the price was already close to the moving average resistance of the four-hour chart. Today, the decline continued to break the low, and the rebound strength could not be large. This is a rule.
BTC short-term contract trading strategy:
Sell at the 104000 area, stop loss at the 104500 area, and target the 102000 area;

BTC-----Buy around 104800, target 106000 areaTechnical analysis of BTC contract on June 5:
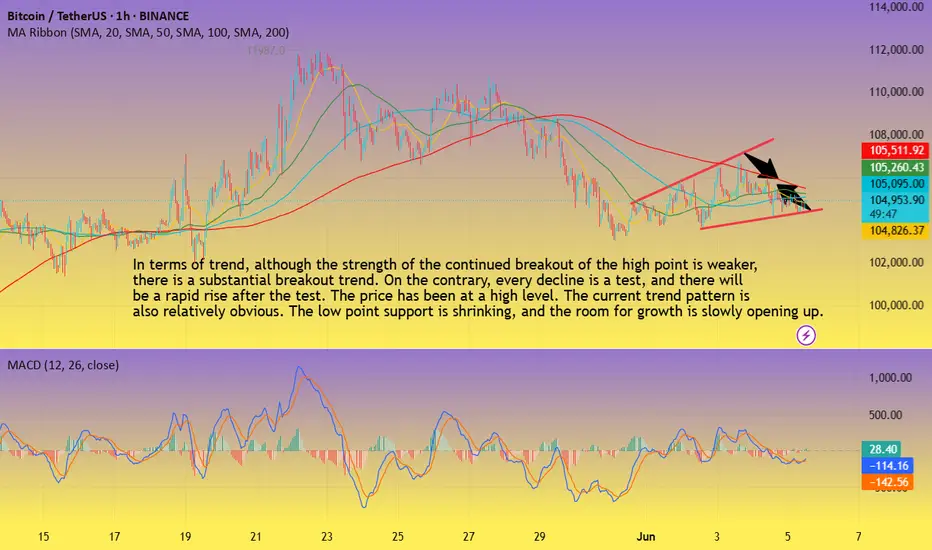
Today, the large-cycle daily line level closed with a small positive line yesterday. The K-line pattern has continuous positive and negative lines, but if we look carefully, we will find that the price has been at a high level, and every retracement trend is testing support, and the rise is breaking the high, although it has not continued, so in this case, it is still very easy to pull up and break; the short-cycle hourly chart price is oscillating in a small range, and the upward channel is slowly opening in the trend pattern, and the support for the decline is moving up. This is relatively clear. The current K-line pattern is continuous positive, and the attached indicator is golden fork, so there is a high probability of rising during the day. Whether the European session can break the high is to focus on.
BTC short-term contract trading strategy:
The current price is more in the 1048000 area, the stop loss is in the 1043000 area, and the target is in the 106000 area;
$BTC UpdateCRYPTOCAP:BTC #BTC $104,987 support in effect, previous weekly closed with bearish engulfing, 4h closed with bullish engulfing - current 4H trying to follow thru. $107,461 support needed to push for $110,423 resistance, and then the new ATH. $103,093 current support, $99,361 key support from here. Watch given S/R

Price tapped the low — but didn’t break structure. That’s all I BTC delivered a clean sweep into the 15M low, filled the imbalance, and now it’s reclaiming. If you’re still wondering whether it’s valid — you’re not reading structure. You’re chasing candles.
Here’s the setup:
Price swept a key low at 104,870.98, tapping into a precision FVG
That move also kissed the edge of a lower BPR — institutional order flow at work
Now we’re rotating back toward the 15M OB near 106,438.94, with the first real reaction zone at 105,779.08
Above that, fib confluence and the OB offer a decision point: either distribute from 106.4 or break higher into premium inefficiency zones.
If price stalls at 0.5 (105,831) and rejects hard, I’ll expect a revisit to the low. If we blow through with displacement — we’re heading higher.
Execution bias:
Longs are valid as long as price holds above 104,870
TP1: 105,779
TP2: 106,438
Failure to reclaim FVG = scenario invalid, stand down
This isn’t a “setup.” It’s a replay of logic. The market does this every day — if you know how to listen.
More trades like this? No noise, just precision — check the profile description.

BTC Bitcoin Warning: No Clear Setup — Don’t Get Trapped!🚨 BTC Market Outlook: Analysis & Key Warning for Traders 🧠💡
Currently keeping a close eye on Bitcoin (BTC) 🔍. Previously, we saw strong bullish momentum propelling price upward 📈. However, that momentum is now under pressure — especially when you zoom into the 4-hour timeframe. We've seen a clear break in market structure, with lower highs and lower lows forming 🔻.
Right now, there’s no clean trade setup on the table. Price has pulled back, and we’re at a key inflection point — either we see a bullish breakout, or further downside could unfold 📉.
This video is more of a technical warning ⚠️ for traders feeling the urge to jump in early. The current structure is risky, and taking impulsive trades here could do more harm than good.
In the video, I also cover how to identify the highest-probability setups — particularly when price consolidates in a range and then breaks out in the direction of the prevailing trend. These continuation setups offer far better odds than guessing mid-range.
📌 Be patient. Let the setup come to you. Don’t force trades when conditions are unclear.
💬 If you’ve watched the analysis or have thoughts on BTC’s next move, comment below — I’d love to hear your view.
❗️Disclaimer: This is not financial advice. Everything shared is for educational purposes only. Always do your own analysis and trade responsibly. Risk management is key.

Price is coiled. Expansion is near. The setup is clean — if you BINANCE:BTCUSDT has reclaimed its 4H range low and is now driving into the midpoint of a prior leg. This isn’t random — it’s the prelude to a move Smart Money has been framing for days.
Here’s the breakdown:
Price respected the 0.618 (105,780) and rotated upward — that level is now the line between structure and noise
First objective: OB 4H at 107,839, aligning with 0.5 → 0.382 retracement
If that gets cleared with displacement, we extend into 109,621 — final premium zone before HTF liquidity is satisfied
The upper wick at 111,897 is still untouched — a long-term draw that only unlocks if we break 109k with intent
But if price fails and flips below 105,780, that signals fading momentum — and opens the door for a sweep toward the 4H OB at 104,116 or even the FVG 4H down near 101,998
Execution mindset:
Longs are valid above 105,780
Targeting: 107.8 → 109.6 → possibly 111.9
Invalidation: Daily close below 104,116
Liquidity lies above — Smart Money is already positioned
You don’t need signals when structure tells the story. You just need precision.
More entries, levels, and logic? They’re in the profile description — not in the crowd.

Price isn’t reacting — it’s delivering.BTC just tapped into the 4H FVG with surgical precision.
If you’ve been watching price the way Smart Money does, this wasn’t a surprise. It was the setup.
Here's the structure:
After reclaiming the 4H OB below, price expanded upward into the Fair Value Gap (FVG 4H)
That delivery aligns with the 0.0 fib at 106,770.4 — a premium zone engineered for liquidity harvesting
The next level above is the RB — Reversal Block — where I expect displacement to either fade or accelerate
What matters now is how price reacts on the pullback into the 0.382 → 0.618 fib range (105,338.9 to 104,454.6).
If we see structure hold, I’ll target 107,082.6 next.
If that zone fails — all eyes go back to the OB 4H at 103,023.2.
Execution clarity:
Holding above 104,454 → Long bias continues
Breaking 103,825 with follow-through? Reversal confirmed
Clean invalidation, clean targets — no guessing
The chart’s not lying. It's just speaking in algorithm.
Want trades like this before they hit the box? Check the profile description. Clarity doesn’t need noise. Just rules.

btc on sell#BTC on bullish retracment but price won't hold long, possible we await for decline around the rectangle before selling.
Between 107200-106900 sell, TP 104642, SL 108175.
Bullish range can be consider on multiple breakout at 108300.

BTCUSDT – Ready for the next downward move🚀 Trade Setup Details:
🕯 #BTC/USDT 🔽 Sell | Short 🔽
⌛️ TimeFrame: 15m
--------------------
🛡 Risk Management:
🛡 If Your Account Balance: $1000
🛡 If Your Loss-Limit: 1%
🛡 Then Your Signal Margin: $1369.86
--------------------
☄️ En1: 104838.38 (Amount: $136.99)
☄️ En2: 105096.3 (Amount: $479.45)
☄️ En3: 105280.29 (Amount: $616.44)
☄️ En4: 105464.61 (Amount: $136.99)
--------------------
☄️ If All Entries Are Activated, Then:
☄️ Average.En: 105190.14 ($1369.86)
--------------------
☑️ TP1: 104215.87 (+0.93%) (RR:1.27)
☑️ TP2: 103752.49 (+1.37%) (RR:1.88)
☑️ TP3: 103166.5 (+1.92%) (RR:2.63)
☑️ TP4: 102425.86 (+2.63%) (RR:3.6)
☑️ TP5: 101614.34 (+3.4%) (RR:4.66)
--------------------
❌ SL: 105957.69 (-0.73%) (-$10)
--------------------
💯 Maximum.Lev: 75X
⌛️ Trading Type: Swing Trading
‼️ Signal Risk: ⚠️ High-Risk! ⚠️
🔎 Technical Analysis Breakdown:
This technical analysis is based on Price Action, Elliott waves, SMC (Smart Money Concepts), and ICT (Inner Circle Trader) concepts. All entry points, Target Points, and Stop Losses are calculated using professional mathematical formulas. As a result, you can have an optimal trade setup based on great risk management.
⚠️ Disclaimer:
Trading involves significant risk, and past performance does not guarantee future results. This analysis is for informational purposes only and should not be considered financial advice. Always conduct your research and trade responsibly.
💡 Stay Updated:
Like this technical analysis? Follow me for more in-depth insights, technical setups, and market updates. Let's trade smarter together!

Liquidity was the excuse. Expansion was the goal.This BINANCE:BTCUSDT.P move was written before it happened — clean sweep, BPR fill, and now the setup is primed. You either knew where price was going, or you reacted late.
Price expanded aggressively into a clear 1H IFVG. That wasn’t just a push — it was a calculated run into a premium imbalance.
Now? We're retracing. Right into the EQ of the breaker block and the 0.5 fib (105,039). Exactly where the market wants you uncertain. I’m not.
Here’s the logic:
1H IFVG is filled. That’s done.
Price retraced directly into the 0.382 and 0.5 fib zone.
We have a defined BPR, and price is now hovering around its midpoint — ideal zone for reaccumulation.
As long as 104,999–105,039 holds, I expect a continuation back into 105,891 → 106,478.
If that range breaks clean, the low-hanging liquidity below 104,359 becomes a magnet.
But the narrative right now? HTF is still aligned bullish. We're in the phase where most traders get shaken out before the real move starts.
Trade idea: If I’m in, my invalidation is clean — under 104,699. Target is north of 106,000. I’ll scale partials at 105,799 and let the rest ride.
You want more trades like this? Check the account description. I don’t just post setups — I build conviction.
Let the influencers scream. I prefer precision.

BTC SHORT TP:103,100Alright, let’s talk real — this might be the Sunday fakeout special 🍿
I’m eyeing a SHORT between 104,500 – 104,800, aiming for 103,000 – 103,350 with a 4RR.
We’re riding the 1H to 3H charts and expecting the move within 15 hours.
Looks like a clean bearish continuation — but with the recent manipulations, anything can happen. Set your stop smart based on your strategy.
If it doesn’t happen in time, toss it. Trade’s invalid.
We don’t use indicators, we’re not out here drawing lines or cute little shapes — I just give you a clean trade.
#BTC #Short #PriceAction

BTC Analysis, Next Possible move!Btc is still bullish unless it breaks it structure (masked level) upon which I will swing short it. So far Monthly and Weekly still needs to close above previous local top otherwise this can turn into a top for BTC here. Will trade upon confirmation.

BTC 4H Setup – OB Rejection or Launchpad? Bitcoin is currently ranging below a 4H Order Block (OB) and forming a potential higher low. With price holding above the key 0.618 fib zone (104.1k), this could act as a springboard for continuation — or a trap.
Key Levels:
Support: 104.1k–103.6k (fib cluster & mid-volume node)
Immediate Resistance: 105.1k (OB 4H)
Breakout Target: 107.1k
Fail-safe: 103.0k
Scenarios:
🟩 Bullish Path:
Hold 104k zone
Reclaim 105.1k OB = confirmation
Push toward 107.1k & higher liquidity sweep
🟥 Bearish Path:
Rejection from OB + break below 104k
Eyes on 103.0k as next bounce zone
Plan:
Long scalp above 104.2k if volume sustains
TP1: 105.1k (retest OB)
TP2: 107.1k
SL: Below 103.6k (tight invalidation)
📌 “OB rejection or flip? Market’s next impulse hinges on this 104k–105k squeeze.”

FVG re-entry or fail – this level decides the tone.Bitcoin tapped the 0.618 fib at ~$104,100 and front-ran the 1H demand zone. Now it's hovering at a decision point just beneath the 1H Fair Value Gap.
What to watch:
→ Price is pressing into FVG (104.4k–104.7k), aiming for acceptance.
→ Value area high sits at 104,275 – acting as pivot.
→ Break + hold above 104.7k? Clean path to 105.8k.
Plan:
Entry: 104.1k–104.3k
SL: below 103.6k
TP1: 104.9k
TP2: 105.8k (liquidity sweep)
Invalidation: Rejection from 104.7k = probable retest of 103k
Narrative flip potential:
Buyers are defending the mid-range + FVG. Breakout would shift market structure bullish on the lower timeframes.
"Acceptance above the gap = momentum reclaim."

btc on sell#BTCUSD price is now on retracment, next possible zone is below 102900 which can reform again for buy.
Below 103800 will sell, Target 102900, Stop loss 104500.
The bullish range is below 102900-104750 with longer candle closing above there.

BTC didn’t dump — it tapped.BTC reached into the 1H FVG and wicked just above the OB at 104,204 — delivering premium liquidity and then reversing.
Most are staring at red candles, but the real story is the reaction zone:
Price tagged the 0.618 level (104,559) with precision and reversed with displacement.
Now what?
We're mid-delivery. If BTC can reclaim 104,800–105,000 (mid OB/FVG confluence), a strong move into 105,865 is likely — potentially sweeping for external liquidity near 106k.
Execution Plan:
Entry: 104,600–104,700 range
SL: 104,200 or beneath 103,752 swing
TP1: 105,365
TP2: 106,000+
Key invalidation: clean break below 104,200 with volume
Bias: Bullish while above 104,200
Why: Fair Value Gap fill + OB + 0.618 convergence + responsive wick
This wasn’t a sell-off.
This was a setup.
