BTCUSDT TradeWe will see a liquidity sweep towards the block order zone plus we will see a downtrend towards the demand zone this remains an idea
Btctrading

Hi, I see A very good Swing tradeHi, I see A very good Swing trade opportunity
Risk Reward is very good Risk to reward is almost 7 times
good luck every one

Exciting Opportunity: Get Ready to Load Up on BTC as RSI Hits 30I want to share an incredible opportunity that awaits us all when the Relative Strength Index (RSI) hits the magical number of 30. Get ready to buckle up because this will be a thrilling ride!
As seasoned Bitcoin enthusiasts, we know that timing is everything in investments. So, let me cut to the chase and reveal the secret I've been bursting to share with you. When the RSI indicator drops to 30, it's a strong signal that Bitcoin is potentially oversold and undervalued. This is the perfect time for investors like us to take action, seize the moment, and load up on BTC!
You may be wondering, "Why should I invest when the RSI hits 30?" History has shown us that these moments often mark significant turning points in Bitcoin's price trajectory. It's a golden opportunity to scoop up more Bitcoin at a potentially discounted price before the market realizes its value. By purchasing Bitcoin during this period, we align ourselves with the potential for substantial gains in the future.
So, here's your call to action: Be prepared to take full advantage of this exciting scenario when the RSI indicator flashes 30! Don't let this opportunity pass you by. Allocate a portion of your investment portfolio to Bitcoin and join us in embracing the potential for immense growth and financial prosperity. Remember, fortune favors the bold!
To assist you in making informed decisions, I encourage you to stay updated on the market trends and closely monitor the RSI indicator. Please familiarize yourself with the concept of RSI and its implications for Bitcoin's price movements. This knowledge will empower you to make confident investment choices when the time is right.
In conclusion, my fellow Bitcoin enthusiasts, let's approach this opportunity with enthusiasm, positivity, and a happy tone of voice! The potential rewards that await us when the RSI hits 30 are exhilarating. Let's embrace this chance to bolster our Bitcoin holdings and set ourselves up for a prosperous future.
Please do not hesitate to reach out if you have any questions via the comments.
I am wishing you abundant success and happiness in your Bitcoin ventures!

Bitcoin's Bullish Inverse Head and Shoulders PatternToday, I bring exciting news about Bitcoin that might ignite your trading instincts. Bitcoin has recently formed a bullish inverse head and shoulders pattern, indicating a potential upward trend that could lead to significant gains. This pattern has caught the attention of many seasoned traders eagerly positioning themselves for potential profits.
Let me briefly explain its significance for those unfamiliar with the inverse head and shoulders pattern. This technical pattern is formed when a cryptocurrency's price experiences three distinct lows, with the middle low (the "head") being lower than the surrounding two lows (the "shoulders"). The formation resembles a head placed between two shoulders, hence the name. When the price breaks above the neckline, which connects the highs of the shoulders, it often signals a bullish reversal and a potential uptrend.
Now, why should you be excited about this pattern? Historically, inverse head and shoulders patterns have proven to be reliable indicators of upward price movements. They have signaled significant rallies, and many traders consider them strong buy signals. While past performance does not indicate future results, it's worth noting that this pattern has often provided traders with profitable opportunities.
Considering the current market sentiment and the growing interest in cryptocurrencies, now might be the perfect time to set up your Bitcoin positions. By capitalizing on this bullish inverse head and shoulders pattern, you can ride the wave of a significant price surge. However, as with any investment, conducting research and making informed decisions that align with your risk tolerance and trading strategy is crucial.
To help you take advantage of this exciting opportunity, I encourage you to explore various trading platforms that allow you to establish Bitcoin positions quickly. Whether you prefer traditional exchanges or user-friendly mobile apps, numerous options are available to suit your needs. Take the time to analyze the features, security measures, and fees associated with each platform, ensuring you select one that aligns with your requirements.
Successful trading requires discipline, patience, and a thorough market understanding. Stay informed, watch the latest news and developments, and never invest more than you can afford to lose. The crypto market can be volatile, but it can also be advantageous with careful analysis and strategic decision-making.
So, dear Bitcoin traders, seize this opportunity to profit from the bullish inverse head and shoulders pattern. Set up your Bitcoin positions confidently and embark on this exciting trading journey. May the markets be in your favor!

Is SMA 100 the Ultimate Indicator for Bitcoin Traders?Are you tired of constantly searching for the perfect indicator to time your orders? Look no further because SMA 100 might be the answer you've been searching for!
SMA 100 is a simple moving average that calculates the average price of Bitcoin over the past 100 days. It is a powerful tool that can help you identify trends and make informed decisions about when to buy or sell Bitcoin.
What makes SMA 100 so reliable is its ability to filter out short-term price fluctuations and focus on long-term trends. This means it can help you avoid making impulsive trades based on temporary market movements and make more strategic decisions based on the overall trend.
Not only is SMA 100 reliable, but it is also straightforward to use. All you need to do is add the indicator to your chart and watch for crossovers between the Bitcoin price and the SMA 100 line. When the price crosses above the SMA 100 line, it could signal to buy, and when it crosses below, it could be a signal to sell.
So, are you ready to take your Bitcoin trading to the next level? Consider watching SMA 100 for Bitcoin timing of orders and see how reliable and straightforward it can be. Take advantage of this opportunity to improve your trading strategy.

Bitcoin stagnatesIs there a sense of concern regarding the current state of the BTC market? As you may have noticed, BTC has stagnated while the RSI remains above 50, and the MACD has declined into negative territory.
These indicators suggest that we may be entering a bearish phase and need to act accordingly. While it can be tempting to hold onto our BTC in the hopes of a rebound, it is crucial to consider the potential risks.
That is why I am encouraging you to consider selling your BTC now. We can minimize our potential losses and protect our investments by taking action now.
Of course, the decision to sell is ultimately up to each trader. However, I strongly urge you to look closely at the current market conditions and make an informed decision based on your risk tolerance.

Good news for BTC traders - Declining MACD and rising MA 50 crosAs you might already know, the MACD (Moving Average Convergence Divergence) is a popular technical indicator traders use to identify potential trend reversals and momentum shifts in the market. Recently, we have seen a decline in the MACD for BTC, which is a positive sign for traders.
Moreover, the MA 50 (50-day moving average) has crossed over the MA 200 (200-day moving average), another encouraging sign for BTC traders. This crossover indicates that the short-term trend is moving higher, and the long-term trend is bullish.
All of this is exciting news for BTC traders, and it might be a good time to consider trading BTC. With the declining MACD and the rising MA 50 crossing over MA 200, the market is showing signs of potential growth.
So, if you're looking for an opportunity to trade BTC, now might be the time to take action. Don't miss out on this potential growth opportunity.

BTC Breakout Alert! Blackrock ETF Speculation Sparks Bullish RSIThere is some exciting news to share with you today. Bitcoin has broken out of its recent range and shows bullish solid momentum. This is due to the speculation of Blackrock ETF, which has caused the RSI and MACD to turn bullish.
As you know, Blackrock is one of the world's largest asset managers, and if they launch a Bitcoin ETF could be a game-changer for the cryptocurrency market. This news has already caused a surge in Bitcoin's price, and the momentum will continue.
If you haven't invested in Bitcoin, now is the time to consider it. The market shows bullish solid signals, and the potential for significant gains is high. Bitcoin has proven to be a resilient asset, and with the backing of a company like Blackrock, it could soar to new heights.
So, what are you waiting for? Don't miss out on this opportunity to invest in Bitcoin. The time is now with the Blackrock ETF speculation and bullish RSI and MACD.

BTC update...CRYPTOCAP:BTC moves like a b*tch... The structure broke, So I will flip my bias...
Will long if it breaks the structure on the upside...
Be alert

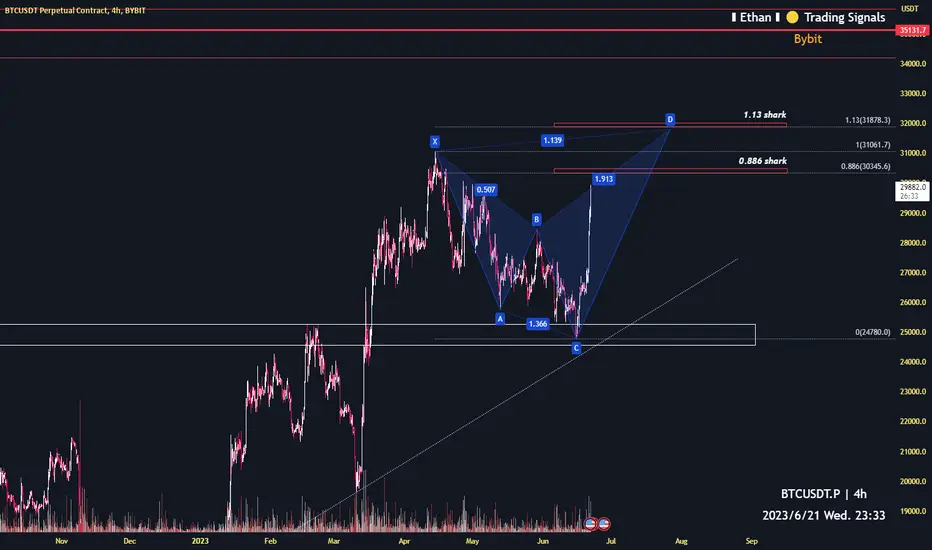
Bitcoin potential reversal price $318784h time frame
-
Bitocoin creating a potential harmonic structure(shark).
Reversal price is 30345 and 31878, depend on small or big shark.
We can have great RRR if open short at these prices.
Stay prepared for it!
Bitcoin Breaks Out of Its Ichimoku Cloud - Time to Trade BTC!Are you ready for some exciting news? Bitcoin has broken out of its Ichimoku cloud and is moving towards $29,000! This clearly indicates that the bulls are in control and the cryptocurrency is on a bullish trend. As a result, it's time to consider trading BTC.
Bitcoin has been on a rollercoaster ride this year, fluctuating wildly. But with this recent breakout, we believe the cryptocurrency is on its way to new heights. The Ichimoku cloud is a powerful technical indicator that shows the trend of an asset, and when Bitcoin breaks out of it, it's a strong signal to buy.
If you're not already trading BTC, now is the time to start. Don't miss out on this opportunity to profit from the cryptocurrency market. Bitcoin is the most popular and widely traded cryptocurrency, showing no signs of slowing down. With its strong fundamentals and growing adoption, we believe that Bitcoin is the future of money.
In conclusion, Bitcoin is breaking out of its Ichimoku cloud and heading towards $29,000.

Target reached as predicted date (go back 27k before June 20)4h time frame
-
Despite we suffered some big vibration from many news.
We still successfully reached 27k with very exact time prediction as analysis on June 6th.

BTC ready to go back 27k in next 2weeks4h time frame
-
BTC still creating a falling wedge.
With this time structure.
We will see 27000 around June 20th.
Then can judge breakout wedge to 32000 or get rejection again.


50d 200d Moving Cross just happened for BitcoinAs you might have noticed, Bitcoin has had a popular 50d 200d moving average cross, establishing a new support level. This strongly indicates that the market trend is moving upward, and it's an excellent opportunity for traders to consider positions.
Additionally, the RSI is at an optimal time for entry, meaning it's a great time to buy Bitcoin. With the combination of the moving average cross and the RSI, we can confidently say that the market is in an excellent position for traders to make a profit.
As a fellow trader, I encourage you to consider taking a position in Bitcoin. The market trend looks favorable, and it's an excellent opportunity to profit. Don't miss out on this chance to increase your trading portfolio.

$BTC SHORT TERMUPDATE FOR CRYPTOCAP:BTC CHART FOR SHORT TERM
CHART 4H
(It is not financial advice, And don't enter before see PRICE ACTION)
GOOD LUCK

BTC momentum builds as it goes beyond 27000 targetToday, the Relative Strength Index (RSI) for Bitcoin is at a healthy 53.7, indicating that the cryptocurrency is in a strong position to continue its upward trend. Bitcoin is already strengthening and moving towards rising Fibonacci levels, breaking through its target of $26303 and heading towards its upper next level of the target at $27037.
This is fantastic news for those of you who are interested in short-term investing in Bitcoin. With the cryptocurrency showing such promising signs of growth, now is the perfect time to consider taking advantage of this opportunity.
So, if you're a Bitcoin Maxi Trader looking to make some quick gains, I encourage you to take a closer look at Bitcoin and consider investing in it today.
Thank you for your time and attention, and I hope you have a wonderful day!

Potential Bitcoin Price IncreaseI wanted to bring to your attention a potential increase in Bitcoin's price. Currently, the relative strength index (RSI) of 14 days is hovering around a ceiling of its own at 50.00. As of now, the index is tracking at 49, and BTC is attempting to break into the $26,000 mark.
If the bulls manage to move beyond the obstacle on the RSI, there is a strong chance that the price will climb past $26,300 with relative ease. This could be a great opportunity for those interested in investing in Bitcoin.
Please let me know if you have any questions in your comments.

Could BTC double market dominance according to Michael Saylor?For those who may not know, Michael Saylor of MicroStrategy, a business intelligence company, recently made headlines for investing over $1 billion into Bitcoin. He's been a vocal supporter of Bitcoin for years and has even written a book about the topic.
So, what did Michael Saylor say that has us so excited? In a recent interview, he stated that he believes:
"Stablecoins, crypto derivatives, and tokens will become less popular, according to Saylor, who claims that Bitcoin is the only widely accepted digital good that regulators are prepared to accept. His prediction is based on the idea that as regulators tighten their control over the cryptocurrency market, many crypto-assets will either be outlawed or lose their relevance, leaving Bitcoin to command attention."
cryptonewmedia.press/heres-why-bitcoin-will-double-its-market-share-according-to-michael-saylor
This is incredible news for those of us who have already invested in Bitcoin, but it's also a call to action for those who haven't yet. If you're on the fence about investing in Bitcoin long-term, now is the time to consider it seriously.
Of course, as with any investment, there are risks involved. But with Bitcoin's track record of growth and adoption and the support of industry leaders like Michael Saylor, the potential rewards far outweigh the risks.
So, let's take this opportunity to celebrate Bitcoin's success and look forward to an even brighter future. And if you haven't already, consider investing in Bitcoin long term.

BTC broke through 50 day moving average for continue drive up I wanted to bring to your attention the recent Bitcoin (BTC) movement after today's inflation report in the United States. BTC has moved back above the $26,000 level, following a low of $25,686.04 at the beginning of the week. Today, BTC/USD reached of $25800.
It is worth noting that the 50-day moving average will need to shift course and divert away from its current downward path in order to maintain this positive trend. The current price has been achieved.
I thought this information may be of interest to you and wanted to keep you informed.

BTCBy breaking the midline of the channel and pulling back to it, Bitcoin can slow down to the bottom of the channel
Similarly, RSA should also decrease

BTC is poised for more losses shortly.
As you may already know, BTC has recently struggled to maintain its value. The price has been fluctuating wildly, and the bears seem to be in control of the market. Unfortunately, this trend will likely continue, and we may see even more losses in the coming days.
Unfortunately, BTC seems to have fallen below its 50-day SMA and is currently facing resistance at 26k. Monitoring these trends and adjusting your strategy is essential as a Bitcoin trader. Check out the current BTC price below the 50-day SMA and consider your next move.
It seems that Bitcoin has fallen below the 0 Fibonacci level. As a result, it may take a lot of work for bitcoin traders. However, I suggest keeping an eye on BTC below 0 Fibonacci level for those interested in potentially buying at a lower price.
This news is difficult to hear, especially for those who have invested heavily in BTC. However, it is essential to remember that the market is constantly changing, and there will be opportunities to make up for these losses in the future.
In the meantime, I encourage you to oversee your BTC trading. Keep a close eye on the market and be prepared to make quick decisions if necessary. Remember, it is always better to be safe than sorry when trading.

Next week - High Potential buying zone on BTC BINANCE:BTCUSD CRYPTO:BTCUSD
I'm continuing my analysis on the Bitcoin BTC/USD market, I'm expecting this high setup buying zone mentioned on the chart.
As you can see, we're in the liquidity zone (trend channel), so I expect this channel to be broken and after filling the imbalance below, then the price will tap on the order block to go higher.
I'd just like to mention that the market is expecting some big news this week (CPI, PPI, FOMC).
Trade at your own risk.
Follow for more
