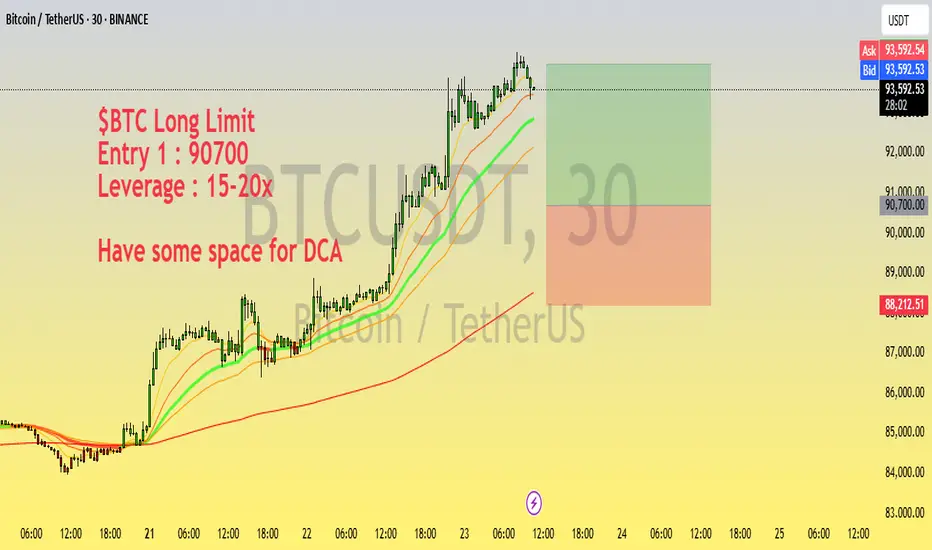
$BTC Long Setup | Entry @ 90700 | 15-20x Leverage | DCA FriendlyLooking to long BTC from the 90,700 zone with a high-conviction setup on support.
Trade Plan:
Entry 1: 90,700
Leverage: 15-20x
Setup: Price holding above key support with bullish structure forming on lower timeframes
Note: Leave room for DCA if price dips further
Monitor closely for reaction around support — tight SL recommended for capital protection.
Disclaimer: Not financial advice. DYOR and manage your risk accordingly.
Btctrading
BTC/USD 1H – Bullish Breakout with FVG Entry & $91K TargetChart Breakdown:
📈 Trend Structure:
BTC is moving in an ascending channel with:
🔵 Resistance Line on top
🟢 Support Line below
🔁 Recently, it broke out above the resistance with a bullish move!
Key Zones & Levels:
🟦 Fair Value Gap (FVG)
This is your potential buy zone:
✅ Entry Point: $86,135
❌ Stop Loss: $85,098
🎯 Target: $91,000
📌 Plan:
Wait for price to retrace into the FVG zone
Look for a bullish bounce ✅
Enter long at $86,135
Set your SL and target accordingly
Risk-Reward Setup:
Risk: Small (below FVG zone) ❗
Reward: Big upside toward $91,000 🚀
Gain Potential: +5.74% ($4,948 per BTC)
Visual Flow:
1️⃣ Price breaks resistance 🔼
2️⃣ Pullback expected to FVG 🔽
3️⃣ Entry triggers around $86,135
4️⃣ Targeting moon shot to $91K 🌕
Conclusion:
This setup shows a bullish continuation with solid RR.
If BTC holds the FVG on a retest, the move to $91K looks likely!

$BTC: Last 2 months pump before the bear market starts.On the chart, you can clearly see the similarities between the last cycle and the current one.
First, this cycle is already longer, so I don’t expect another top in 2026, as some are suggesting.
Based on my analysis, we are currently in the equivalent stage of the last cycle where two strong monthly candles appeared before the market dropped into a bear phase.
Why is this happening?
We are resetting the weekly MACD — it's at the bottom and needs to push into overbought territory before it can turn down alongside the monthly MACD.
As shown in the chart, the monthly MACD is close to turning bearish. If the weekly MACD also flips bearish, that could mark the end of the bull market.
Additionally, volume is dropping, and the RSI supports this scenario. It looks like we’re setting up for one last pump, just like last time — likely followed by a rejection in 2 months.
📊 Check the chart — I’ve laid it out as clearly as possible.
💬 If you agree or disagree, let’s discuss in the comments!
🧠 DYOR — Do Your Own Research!
#Bitcoin #CryptoAnalysis #MACD #RSI #CryptoCycle #BullMarket #BearMarket #BTC #CryptoTrading #TechnicalAnalysis #DYOR #Altcoins #MarketUpdate #CryptoCommunity #Cryptocurrency

BTCHello friends
We tried to make everything clear on the chart, I hope you like it.
Good luck.
*Trade safely with us*

Next BTC Peak in Dec 2025?#Bitcoin Duration of Expansion Phases Above Previous All-Time Highs (ATH)
Historically, the time Bitcoin spends above its previous ATH increases with each cycle.
> In 2017, the expansion phase lasted 211 days.
> In 2021, it extended to 285 days, a 74-day increase (+29%).
If this trend continues, the current cycle’s expansion phase (starting Oct 2024) could last 425 days (+29% from 2021), projecting an end in Dec 2025.

BITCOIN WEEKLY ANALYSIS - April 18th, 2025BTC/USD is currently hovering just below a major descending trendline and key horizontal resistance near the 91,500 level. 🧱
🔍 What We’re Watching:
- Price has tested the downtrend line multiple times — the structure is weakening.
- A breakout above 87,500 could trigger a strong bullish move.
- Until then, "Wait for the Breakout" remains the strategy. No confirmed long entries yet.
📉 Current Price: $84,500
📈 Breakout Confirmation: Clean close above resistance zone + volume spike = 🔥🔥 potential rally.
🧠 Pro Tip: False breakouts are common. Watch for confirmation — not just a wick!
Stay sharp, stay patient. Breakouts give the best reward-risk trades! 💹

$BTC Update - Sideways Movement AheadCRYPTOCAP:BTC #BTC at $84,221 support and testing, Next key resistances at $88,674 and $91,357, $81,614 current key support area, Ranging between $86,305-$82,833. Low volume on 4H, put bullish engulfing on previous 4H close but no follow up on current 4H, Last weekly close looks good with a bullish engulfing, but current weekly not looking promising for a follow thru yet. Previous daily closed bearish, RSI remains neutral on 4H, 1D and 1W. Expecting more sideways movement until $91,357 resistance is taken as support.

#BTC/USDT#BTC
The price is moving within a descending channel on the 1-hour frame, adhering well to it, and is on its way to breaking it strongly upwards and retesting it.
We are seeing a rebound from the lower boundary of the descending channel, which is support at 82900.
We have a downtrend on the RSI indicator that is about to break and retest, which supports the upward trend.
We are looking for stability above the 100 moving average.
Entry price: 83240
First target: 85150
Second target: 86435
Third target: 87858

#BTC/USDT#BTC
The price is moving within a descending channel on the 1-hour frame, adhering well to it, and is on its way to breaking it strongly upwards and retesting it.
We are experiencing a rebound from the lower boundary of the descending channel, which is support at 74,300
We are experiencing a downtrend on the RSI indicator, which is about to break and retest, supporting the upward trend.
We are looking for stability above the 100 Moving Average.
Entry price: 79,056
First target: 80,422
Second target: 81,950
Third target: 84,000

BTC/USD Daily Technical Outlook – Approaching Cycle Top?Bitcoin is currently trading around $85,500, maintaining short-term bullish momentum within a well-formed ascending structure on the daily chart. The price is now entering a mid-phase rally, with a clear target of $98,000, a key resistance level that coincides with the upper boundary of a rising wedge formation and historical trend extension zones.
Key Technical Levels:
Immediate Resistance: $88,800 (local supply zone)
Major Target Zone: $97,000–$98,000 (macro resistance + psychological round number)
Short-Term Support: $82,000
Key Breakdown Level: $78,500
While the momentum suggests BTC may continue to push higher in the near term, the $98,000 resistance is likely to act as a distribution zone, where buying may slow and profit-taking increases. This level could falsely signal a breakout, leading to a spike in retail long positions before the market enters a longer-term correction phase.
If rejection occurs at or near $98,000, BTC could begin a multi-month correction, with the primary downside target set at $49,000 by July 2025. This level aligns with previous weekly support, volume profile lows, and would represent a typical deep retracement following a major cycle top.
Outlook:
Near-term bias: Bullish toward $98,000
Macro bias: Bearish reversal expected from resistance zone
Cycle correction target: $49,000 (Q3 2025)

"Bitcoin Bearish Reversal Setup: Supply Zone Short Strategy"🔵 SUPPLY ZONE (Resistance Area)
💥 Strong selling area around 85,800 - 87,800 USD
Historically, price got rejected here
Expect sellers to step in again
✍️ ENTRY POINT
📍 Just below the supply zone (~85,889.89)
Ideal for short position setup
Watch for bearish candlestick patterns for confirmation
🛑 STOP LOSS
❌ Placed above the supply zone at 87,796.97
Keeps risk under control if breakout happens
🎯 TARGET POINT (Support Area)
📉 Around 78,000 USD
Marked by previous support and structure
Great Risk-to-Reward ratio
📐 PATTERN WATCH
Looks like a harmonic pattern (maybe Gartley or Bat) 🦇
Suggests reversal from point D
Also resembles a rising wedge, which is bearish
📊 EMA (9-period)
🧭 Price hovering above the 9 EMA (84,704)
A break below it = bearish confirmation
Summary
🔻 Bearish bias
🛒 Short near supply zone
❌ SL above 87,800
🎯 TP around 78,000

"BTC/USD Short Setup: Supply Zone Rejection & 5% Drop Target!"BTC/USD 15-Min Chart Analysis
Trade Setup by EA_GOLD_MAN_COPY_TRADE
---
🔼 SUPPLY ZONE (Resistance)
🟣 Price Area: $83,427.80 – $84,313.06
This is where sellers might step in
Price is expected to reverse or slow down here
🔽 ENTRY POINT
🔵 Sell Entry: $83,427.80
Entering short trade just below the supply zone
Aiming to catch a reversal move down
⛔ STOP LOSS
🔴 Stop: $84,313.06
Placed above the supply zone
Limits risk in case of breakout upward
❗ Protects the trade from loss beyond this point
🎯 TARGET / TAKE PROFIT
🟣 Target: $79,071.05
Major support zone / demand area
Potential Drop: -$4,434.27 (-5.31%)
Big reward zone if price dumps from supply
📈 Trendline & Moving Averages
🔵 Blue = Likely 50 EMA
🔴 Red = Likely 200 EMA
Bullish momentum leading into the supply zone
Trendline supports the prior uptrend, now testing reversal
💡 Conclusion
✅ Trade Bias: Bearish (short)
⚖️ Risk-to-Reward: ~1:5 (Great!)
If price reacts at supply, this setup could pay big
But if it breaks up, stop loss keeps you safe

Bitcoin Trade Setup: Bullish Breakout Targeting $87K!🔹 Key Levels Identified:
📌 Target Point: 87,008.21 USD 🏁🔵
👉 Expected price move (+9.07%) 🚀
📌 Entry Point: 79,719.00 USD ✅
👉 Suggested buying level in demand zone 🏦
📌 Stop Loss: 78,213.25 USD ❌🔻
👉 Risk management level 📉
📊 Technical Analysis:
📈 Trendline Support:
🔵 The price bounced off the trendline 📊, confirming an uptrend 📈
🔵 Demand Zone:
🟦 Marked blue area = Buyer interest 📊
💰 Expected reversal zone if price retests
📊 Moving Average (DEMA 9):
🔸 82,343.85 USD (current level)
🔺 Price slightly below DEMA ➝ possible bullish reversal 🚀
⚡ Trade Setup:
✔️ Risk-to-Reward Ratio:
🟢 Potential profit: +7,220.76 USD
🔴 Risk: -1,500 USD
📊 Favorable trade setup with high reward vs low risk ✅
✔️ Momentum Confirmation:
🟢 Above 79,719 USD = 🚀 Bullish breakout
🔴 Below 78,213.25 USD = ❌ Stop Loss triggered
🔮 Conclusion:
🔥 Bullish setup if price holds demand zone!
🚀 Target: 87,008 USD
⚠️ Manage risk with stop loss! 📉

Bitcoin (BTC/USD) Technical Analysis – Bullish Setup🔵 Key Levels:
🎯 Target Point: 87,050.22 (🔼 Expected upward move)
🔵 Support Zone: 79,833.82 (🛡️ Strong demand area)
🔴 Current Price: 82,254.27
📊 Analysis:
🔵 RBS + RBR Zone (🔄 Role Reversal Support & Rally Base Rally) - Possible entry point for a long position.
🟠 Stop Loss: Below 79,833.82 (🚨 Risk Management)
🟣 Resistance Zone: Near 83,000 (🔄 Possible short-term pullback)
📈 Strategy:
1️⃣ Price might retrace to the blue zone (support) before continuing upward.
2️⃣ If it holds, 🚀 potential rally towards 87,050.22 🎯
3️⃣ If it breaks below support, ⚠️ possible downside risk.
✅ Conclusion:
A bullish setup with a 7.45% profit target 📊
Risk managed with a stop loss below support ⚠️

BTC/USD Long Setup – Bounce from Demand Zone Towards $80K TargetKey Zones
Demand Zone (Buy Zone)
🔵 $74,250 – $75,000
Strong support area
Buyers previously stepped in here
Marked for potential entry
Resistance Zone
🟣 $77,300 – $77,600
Mid-level resistance
Could cause a short pullback
Watch for breakout or rejection
Target Point
🎯 $80,273.49
Potential upside: +6.68% gain
Previous supply/structure zone
Take Profit (TP) zone
Stop Loss
⛔ $74,247.07
Just below the demand zone
Protects against invalid setup
Trade Idea
1. 🔽 Price expected to drop into demand zone
2. 🔄 Wait for bullish confirmation (e.g. bounce or engulfing candle)
3. 📈 Enter long position near $75,000
4. ⬆️ Ride it up through resistance
5. ✅ Target = $80,273 | ❌ Stop = $74,247

BTC/USD 1H Chart Analysis – Bearish Setup with SBR Rejection🔵 Key Zones & Levels:
🔷 SBR Zone (Support ➡ Resistance):
Price Range: ~$81,000–$83,000
🛑 Stop Loss: $83,002.31 (Just above resistance)
Expecting sellers to step in here if price retests this level
🟠 Mid-Range Zone:
Current price is consolidating just below SBR zone
Could form a lower high before dropping
🟦 Target Zone (Support Area):
🎯 Target Price: ~$75,000
Previous demand area – price bounced hard from here before
🔁 Trade Plan:
📉 Bias: Bearish
📍 Entry: Near current price or after retest of SBR zone
🛑 Stop Loss: $83,002.31
🎯 Target: $75,000 (approx -8.33%)
✅ Summary:
Risk-Reward: Appears solid (R:R > 2:1)
🕵️♂️ Watch for: Fakeouts or rejections in the SBR zone
🔻 Potential Move: -6,804 points if plan plays out

BTC-----Sell around 80700, target 79000 areaTechnical analysis of BTC contract on April 8: Today, the large-cycle daily level closed with a small positive line yesterday, and the K-line pattern was a single negative and a single positive. The main reason for the decline was the stimulation of the news, so there was no continuous negative pattern, but the price was below the moving average, and the attached indicator was dead cross and running downward. The decline in the general trend was very obvious. The current moving average pressure position was near the 81000 area. Although the current trend is very clear, we still need to remind everyone to pay attention to the risk of retracement. Risk control must be strictly done, because many friends have gambling nature and do it with large positions. Once the risk is not controlled, there will be a situation of liquidation; the short-cycle hourly chart has been continuously rebounding since yesterday's day. The current K-line pattern is the same, and the attached indicator is running in a golden cross. There is no signal of pressure, so we have to wait during the day, and use the daily moving average pressure as a defensive position.
Therefore, today's BTC short-term contract trading strategy: sell at the rebound 80700 area, stop loss at the 81200 area, and target the 79000 area;

BTC Possible buying opportunity Possible buying opportunity if Weekly 50 SMA and Fib level 61.80% hold the price.

Bitcoin BTC - Buy The News, Correction Is Almost Over Hello, Skyrexians!
The anticipated move has happened, BINANCE:BTCUSDT has retested the recent low and its dominance continues growing, alts are bleeding. When this nightmare will be finished and do we have any chance to see the reversal now?
Let's take a look at the daily time frame. As we pointed out earlier Bitcoin has printed wave 1 inside larger degree wave 3 and after that dropped in the wave 2. We have already told you 2 times that correction is over when price was next to $77-78, but multiple retests are not forbidden. 0.61 Fibonacci zone is the place where correction can be finished, so it can dump up to $73k. Two facts we need to rely on to find the correction bottom are: bullish divergent bar and the first green column on Awesome oscillator in conjunction with the divergence.
Best regards,
Skyrexio Team
___________________________________________________________
Please, boost this article and subscribe our page if you like analysis!

Bitcoin (BTC/USD) Price Analysis: Bearish Breakdown Ahead?🔥 Bitcoin (BTC/USD) 1-Hour Chart Analysis 🔥
🔹 Trend Analysis:
🟡 Price was moving in an ascending channel 📈 but has broken below the trendline.
🟠 A retest of the broken trendline is happening, suggesting a potential drop 📉.
🔹 Trade Setup:
🔽 Short Entry: Expected rejection from the trendline.
❌ Stop Loss: $85,671 - $85,710 (Above resistance).
✅ Take Profit Target: $81,386 - $81,347 (Bearish target 🎯).
🔹 Indicators & Confirmation:
📊 EMA (9) at $84,254 → Acting as resistance 🚧.
🔄 Break & Retest Pattern → Typical for a bearish continuation 🛑📉.
🔹 Conclusion:
⚠️ Bearish Bias: If the price rejects the trendline, it could drop towards $81,386 🎯.
🚨 Invalidation: If the price breaks above $85,710, the short setup is canceled ❌.

Bearish Trend Meets Bullish Momentum: Is BTC Ready for a Rebound📉 Bitcoin is currently in a strong bearish trend on higher timeframes, but 📈 the 1-hour timeframe shows a break of structure and bullish momentum. This suggests a potential short-term pullback into the previous range, aligning with the 50% Fibonacci retracement level. 🔄 Additionally, there’s a bearish imbalance above that could be rebalanced. While this presents a possible buy opportunity, ⚠️ it’s a high-risk setup due to the overall bearish trend. Always trade with caution! 🚨
Disclaimer
⚠️ This is not financial advice. Trading involves significant risk, and you should only trade with funds you can afford to lose. Always do your own research and consult a professional if needed. 💡

Grasp the trend and analyze the full range of BTC longsTechnical analysis: Based on in-depth technical analysis, the current BTCUSD decline has slowed down, and there are signs of building double bottom support. The 50-day moving average and the 200-day moving average form a golden cross, the MACD indicator continues to strengthen and the bar chart continues to expand. As BTCUSD stops falling, market sentiment is gradually warming up, institutional funds continue to flow in, fundamental support is solid, and the upward momentum may gradually strengthen. It is the right time to go long.
BTCUSD operation strategy: Go long in the 82500-81500 area. Target 83000-84000
Trading discipline: 1. Don't blindly follow the trend: Don't be swayed by market sentiment and other people's opinions, operate according to your own operation plan, market information is complicated, and blindly following the trend is easy to fall into the dilemma of chasing ups and downs.
2. During the transaction, we will continue to pay attention to news and technical changes, inform us in time if there are changes, strictly implement trading strategies and trading disciplines, move forward steadily in the volatile market, and achieve stable asset appreciation.
