Buy BTC,it still has the potential to reboundBTC experienced a sharp short-term decline, breaking lower; however, the downward momentum has significantly slowed. Importantly, the recent pullback has not disrupted the broader upward consolidation structure, with the 84500-83500 zone continuing to provide strong support.
Once the bearish sentiment fully subsides, I anticipate a relief rally or a technical rebound. Therefore, this pullback could present an excellent opportunity to go long on BTC.
Consider entering long positions around the 84500-83500 support zone, targeting an initial upside move toward the 86000-86500 range.
The trading strategy verification accuracy rate is more than 90%; one step ahead, exclusive access to trading strategies and real-time trading settings
Btctrading

Buy@85500 - 86500Presently, Bitcoin is firmly ensconced within a robust upward trajectory. Having transitioned from a sideways trading phase at 84000 last week, it has executed a remarkable rally, surging directly into the resistance corridor in the vicinity of 89000. With the current trading price hovering at 87000, the market exudes a palpable sense of bullishness.
Should BTC sustain a stable sideways oscillation between 87000 and 88000, the bulls stand to methodically amass upward momentum. Once primed, a breakthrough of the 89000 threshold by BTC appears all but inevitable.
From a technical vantage point, Bitcoin has convincingly breached the sideways trading range. Its moving averages exhibit a distinct bullish configuration, with the 85000 level solidifying as a crucial support.
On the fundamental front, a confluence of factors—including the prevailing global economic uncertainties, the buoyant market sentiment, and the relatively permissive regulatory environment—collectively conspire to propel the continued ascent of its price.
💎💎💎 BTCUSD 💎💎💎
🎁 Buy@85500 - 86000
🎁 TP 87000 88000 89000
The market has been extremely volatile lately. If you can't figure out the market's direction, you'll only be a cash dispenser for others. If you also want to succeed,Follow the link below to get my daily strategy updates

#BTC/USDT Update! This is the only Bullish trigger point!#BTC has reached our key resistance zone, the exact area I've been highlighting since last week.
So far, we've seen a clear rejection from this level.
Bitcoin still needs more momentum to break above this zone convincingly.
As long as we remain below this range, it won’t be smooth sailing for BTC or altcoins.
📊 I’ll be sharing some important altcoin charts later today.
Stay tuned!
Please hit the like button to support my content and share your views in the comment section.
Thank you
#PEACE

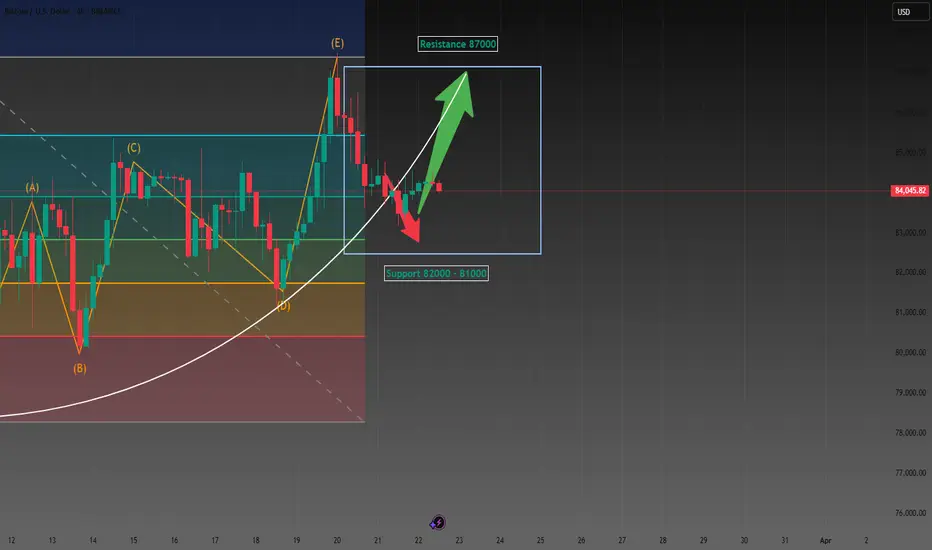
Bitcoin (BTC/USD) 4H Chart Analysis: Bullish Breakout Ahead?📈 Ascending Channel:
🔹 The price is moving upward within a parallel trend channel.
🔹 Blue arrows (🔵) indicate resistance points where the price struggled.
🔹 Red circles (🔴) highlight support areas where the price bounced.
🟦 Fair Value Gap (FVG) Zone:
🔸 The blue-shaded area (FVG zone) suggests a possible retracement before a bullish move.
🔸 If the price dips into this zone, it may find liquidity and bounce back up.
📊 Projected Price Movement:
⚡ Expected pullback → into FVG zone (🔽), then a bullish push (🚀) towards $90,686.72 🎯.
🟡 Yellow arrow shows the anticipated price path.
📉 Support & Resistance Levels:
✅ Support: Around $86,000 - $86,500 (FVG zone).
🚀 Target: $90,686.72 (next major resistance).
📌 Exponential Moving Average (DEMA - 9):
🔹 The blue line (DEMA 9) at $87,414.57 is acting as dynamic resistance.
🔹 A break above this could confirm further upside movement.
💡 Conclusion:
🔸 Bullish bias remains strong 📈.
🔸 Watch for a dip into the FVG zone before a potential rally 🚀.
🔸 If Bitcoin holds support, it may reach $90K+ soon 🎯🔥.

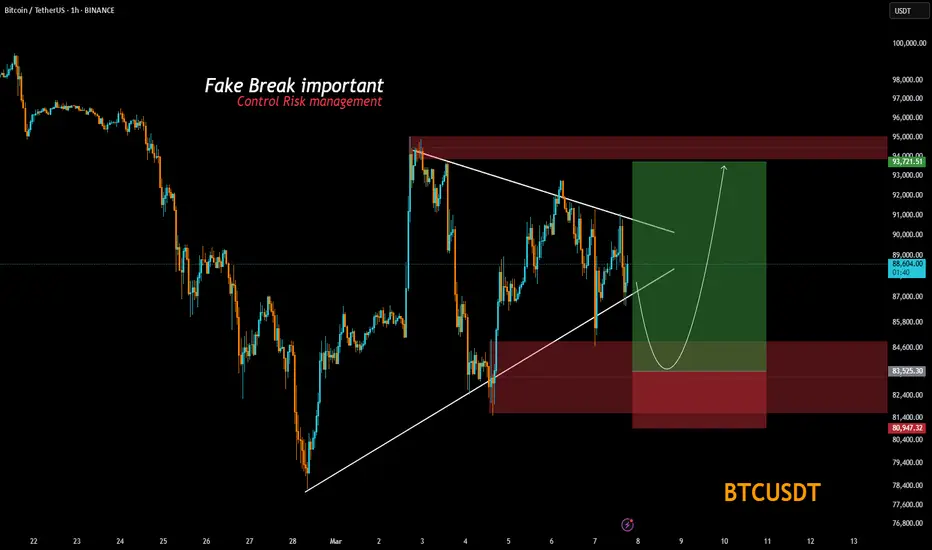
Bitcoin (BTC/USD) 4H Analysis: Bullish Breakout or Pullback?🔍 Key Observations:
🔹 📈 Trendline Breakout: The descending trendline (white) has been broken, signaling a potential uptrend.
🔹 📍 Support & Resistance Zones:
🟢 Strong Support (~$80,349 - $82,000): 📉 If price drops, this zone could act as a bounce area. 🛑 Stop-loss is placed below.
🟡 Resistance (~$86,000 - $88,000): 🔄 Currently testing this level—either a breakout or a rejection could follow.
🔵 Next Target (~$94,000): 🚀 If Bitcoin pushes above resistance, this could be the next stop.
📊 Possible Price Action Scenarios:
✅ Bullish Path:
🟢 Breaks Above $86,000 → Targets $94,000 🚀
🔄 Small retest of support before continuing up 📈
❌ Bearish Path:
❌ Rejected at $86,000 → Pullback to $82,000 🔽
📉 If support fails, price may drop further
🎯 Conclusion:
🔥 Bullish Bias: 🟢 A breakout above $86,000 increases the chance of hitting $94,000+.
⚠️ Watch for retests! 🔄 A pullback before an upward move is possible.
🚀 Final Thought: If BTC **

BTC Today's analysisDuring the recent continuous and close tracking of the cryptocurrency market dynamics, I have always maintained an optimistic view on the price trend of BTC.
As it turns out, this prediction has been strongly validated by the market. Since the last market analysis, the price of BTC has shown a strong upward momentum, steadily climbing from an initial price of around 84,000 to the current remarkable 85,200.
💎💎💎 BTC 💎💎💎
🎁 Buy@83500 - 84000
🎁 TP 86000 - 87000
The market has been extremely volatile lately. If you can't figure out the market's direction, you'll only be a cash dispenser for others. If you also want to succeed,Follow the link below to get my daily strategy updates

Bitcoin at a Critical Juncture – Breakout or Breakdown? 📉 BTC is at a key decision point! After pulling back from recent highs, it's now consolidating within a range, sitting right in the middle of the previous price swing. I'm keeping a close eye on this zone—if price breaks out, a high-probability trade opportunity could emerge.
🎯 In this video, we dive deep into price action and market structure, breaking down a potential trade setup—if the market aligns with our strategy.
🚨 Trade smart, manage risk—this isn’t financial advice! 🚀🔥

BITCOIN HAS TO BREAK LONG TERM TREND by DEC - SQUEEZE APEX DECI have posted this before and I post it again now, just months away from a CRUCIAL point for Bitcoin PA
As with any time scale trading chart, An Apex is a point of reaction. PA usualy reacts BEFORE the Apex is met.
This Giant Apex is in DEC 2025
Every single ATH in the life span of Bitcoin has been rejected by the Arc of Resistance that is overhead.
We can also see how from the ATH in 2011, a trend line was formed that has acted as Support ever since 2012. PA has never dropped below this line.
So, as you can see, PA has been in a diminishing "Sandwich" and Now, we are coming to the Crunch
We can see how the ATH's have been a reducing % Rise ever since this point also.
And you will notice how this number on the chart reduces each time, even though the real value is increasing.
Low to ATH A ( ATH 2011) - 3,465,178%
Low to ATH B ( ATH 2013) - 49,670 %
Low to ATH C ( ATH 2017) - 9,865 %
Low to ATH D ( ATH 2021) - 2,148 %
E is not over yet but coing on current ATH we have
Low to ATH E ( ATH 2025) - 575 %
So, you see the reduction of % rise, held back all along by the ARC Of RESISTANCE
What is interesting, is that since PA has been in the chanel formed in 2011, when comapred to each other, we have been seeing a rise of 20% of the previous rise ( on average )
This closer chart shows you this in more detail
I will ignoew the A - B as thia is out of channel
C-B = 19.6 %
D-C = 21.77 %
Currently E-D = 26.7 %
As you can see, we are currently OVER that average % Rise.
And we are also heading into a tight APEX in Dec.
The expected 200K ATH this cycle will take us out of the pattern, out of the Apex and out of the 20 % average rise of previousl
This really is CRUNCH TIME for Bitcoin
The REALLY interesting thing is, What would be Next ?
This would break the Cycle routine.
We may already have broken that as described in previous charts of mine from years ago
But what IS Certain is that something HAS to happen.
This Cycle ATH will reveal a HUGE amount but we have yto Wait and see what will happen

Let's always put our trust in BTC, mate.Bitcoin Market Analysis
BTC price hovers around 84,000 in consolidation. Bulls and bears battle at this price.
Support Level
Support is in 81,000 - 82,000. Strong buying emerges there. It stopped drops in past corrections. Dense holdings mean many cost - bases are in this range, propping up support.
Resistance Level
Resistance at 87,000. K - lines show heavy selling near it. Past break - throughs failed. Trapped or profit - taking positions sell as price nears, creating resistance.
Bullish Outlook
I'm bullish. Global recovery raises risk appetite for BTC. More institutions hold BTC, boosting price. Positive sentiment on long - term prospects, due to blockchain growth, helps. Upward - diverging moving averages show uptrend. Lower volume in consolidation, but activity stays. New positives may push price to resistance.
💎💎💎 BTC 💎💎💎
🎁 Buy@83500 - 84000
🎁 TP 86000 - 87000
The market has been extremely volatile lately. If you can't figure out the market's direction, you'll only be a cash dispenser for others. If you also want to succeed,Follow the link below to get my daily strategy updates
BTCPossible triangle or channel formation on BTC here. Looks more corrective than impulsive after analyzing for 2 years since the bull market started.

Bitcoin long-term holder behavior shift signalsBitcoin long-term holder behavior shift signals 'unique market dynamic' — Research BITSTAMP:BTCUSD
Bitcoin’s corrective phase set a four-month low at $76,600 on March 11. Despite this decline, long-term holders have continued to hold large amounts of BTC, suggesting a “unique market dynamic moving forward,” new research says.
“Long-Term Holder activity remains largely subdued, with a notable decline in their sell-side pressure,” Glassnode said in a March 18 markets report.
Long-term holders show signs of bullishness
Bitcoin’s recovery comes as selling pressure among Long-Term Holders (LTHs) — wallets that have held Bitcoin for at least 155 days — begins to wane.
The Binary Spending Indicator, a metric used to determine when LTHs are spending a significant proportion of their holdings in a sustained manner, shows a slowdown (see chart below) while the LTH supply is also beginning to rebound after several months of decline.
“This suggests that there is a greater willingness to hold than to spend coins among this cohort,” Glassnode noted, adding:
“This perhaps represents a shift in sentiment, with Long-Term Holder behavior moving away from sell-side distribution."
Bull market tops are often marked by intense sell-side pressure and strong profit-taking among LTHs, which signals a complete shift to bearish behavior.
However, despite Bitcoin's drawdown in recent weeks, this investor cohort continues to hold a large portion of their profits, especially for this later stage of the cycle, Glassnode said.
This could suggest that long-term holders may still be expecting more BTC price upside later in the year.
“This interesting observation may indicate a more unique market dynamic moving forward.”
New Bitcoin whale accumulation reshapes markets
New Bitcoin whales, addresses holding at least 1,000 BTC, where each coin has an average acquisition age of less than six months, are aggressively accumulating, according to CryptoQuant data.
This signals strong conviction in Bitcoin’s long-term outlook among the new large investors.
These wallets have collectively acquired over 1 million BTC since November 2024, “positioning themselves as one of the most influential market participants,” said CryptoQuant independent analyst Onchained in a March 7 analysis.
The chart below shows that their pace has accelerated notably in recent weeks, “accumulating more than 200,000 BTC just this month.”
“This sustained inflow highlights a shift in market dynamics, suggesting increased institutional or high-net-worth participation. ”
Meanwhile, several crypto executives have told Cointelegraph that Bitcoin’s recent price drop was a “normal correction,” with the market just waiting for a new narrative and a cycle top yet to come.
But not everyone agrees. For instance, CryptoQuant founder and CEO Ki Young Ju said that the Bitcoin bull cycle is over. He added:
“Expecting 6-12 months of bearish or sideways price action.”
This article does not contain investment advice or recommendations. Every investment and trading move involves risk, and readers should conduct their own research when making a decision.

BTCUSD Analysis StrategyToday's Bitcoin market shows the dual characteristics of technical correction and cautious market sentiment. The short - term risk is inclined to the downside, but there is still rebound potential in the medium - and long - term.
The fact that the price of Bitcoin has fallen below $84,000 does not mean the end of Bitcoin. Instead, it is just a part of the market operation. For investors, the key to success lies in understanding the underlying factors of the market and correctly assessing the risks and opportunities. In a market full of uncertainties, only by staying calm and conducting rational analysis can one seize the future opportunities.
Bitcoin Trading Strategy
sell @ 90000
buy @ 78000
Finally, I'd like to remind every investor that the cryptocurrency market is inherently highly volatile, and every decision you make may have an impact on your investment returns. In this rapidly changing market, what we need is not just luck, but also a keen mind. You are all welcome to follow me. Let's discuss the future of Bitcoin together. Perhaps it is through the collision of ideas between you and me that we can gain a clearer understanding of this market.

Bitcoin (BTC/USD) Short Trade Setup – March 15, 2025This is a Bitcoin (BTC/USD) trading setup on a 30-minute timeframe from TradingView. Here's a breakdown of the analysis:
📌 Entry Price: 84,375
📌 Stop Loss: 85,500 (Red Zone - Risk Area 🚨)
📌 Take Profit Levels:
TP1: 83,429
TP2: 82,640
Final Target: 81,259
🔍 Analysis:
The trader is setting up a short position (expecting BTC to decline).
Risk-to-Reward Ratio (RRR) seems favorable, as the target is much lower than the stop loss.
If BTC drops below 83,429, further declines toward 81,259 are expected.
If BTC breaks above 85,500, the trade is invalidated.
🛑 Conclusion:
A bearish trade setup looking for BTC to decline. 📉
Watch for confirmation of downward movement before entering.

Bitcoin's market share rises despite decline in active usersThe data shows that Bitcoin's dominance has been rising steadily since 2022. It also highlights that Bitcoin's market share of active users has fallen over time. The data shows that on-chain activity in Ethereum and other layer 1 (L1) networks has increased.
OnChain data shows that Bitcoin's dominance has increased since 2022, and the upward trend is the longest in history. The data also shows that Bitcoin's active user market share has fallen as on-chain activity on the Ethereum network has increased.
Amid declining users, Bitcoin dominance has increased;
Matrixport shows that Bitcoin dominance has increased to a new high of over 61%. The analytics platform put the dominance higher, which was stronger than expected in the US jobs report. It said that the increased job rate indicates that the economy is recovering. COINBASE:BTCUSD BITSTAMP:BTCUSD BYBIT:BTCUSDT.P BINANCE:BTCUSDT

Bitcoin at $80,000. A Defining Crossroads: $65,000 or $120,000?Bitcoin stands at a critical juncture at $80,000, where market participants are engaged in a decisive battle between bullish momentum and bearish resistance. The outcome of this struggle will shape the next major move, with two distinct scenarios emerging.
Scenario 1: A Retracement Toward $65,000
If Bitcoin fails to maintain its current momentum, profit-taking and increased selling pressure could lead to a decline toward $65,000. This level serves as a crucial support zone, where demand may re-emerge to stabilize the price before any potential recovery. A break below this threshold would signal a deeper correction, potentially delaying any further upside in the near term.
Scenario 2: A Breakout Toward $120,000
For Bitcoin to sustain a move toward $120,000 by late March or early April, the market must see uninterrupted buying pressure over the next 10 days. There can be no hesitation—buyers need to absorb selling liquidity consistently, preventing any major pullbacks. The key level to watch in this scenario is $109,000, a major resistance zone that has the potential to act as the final barrier before BTC enters price discovery. A clean break and consolidation above this level would significantly increase the probability of an accelerated move toward $120,000.
At this stage, Bitcoin is at a make-or-break point, and the direction it takes from here will set the tone for the coming weeks. Whether it experiences a healthy correction or an explosive rally depends entirely on how market participants respond at these critical price levels.

BTC LOWBTC New Low month of March & April, new low is 68000 $ if its hold then going more down side .

Cold thinking on Bitcoin's "pullback moment"This morning, Bitcoin prices fluctuated again, falling below the $77,000 mark and currently fluctuating around $80,000. The market seems to have entered the "pullback moment" again. Faced with price fluctuations, I believe many friends are thinking about the same question:
Is it "getting off the train to avoid risks" or "entering the market at a low point" now?
This question seems simple, but it is actually complicated. Especially in the cryptocurrency market, short-term fluctuations are drastic, and various information noises are intertwined, which can easily make people lose their way. When we are in the "pullback moment", we need a calm thinking, and we should take our eyes off the price fluctuations in front of us and put them into the larger "trend" and "cycle" framework to examine.
Let's take a closer look at what a trend is and what a cycle is.
1. What are trends and cycles?
To understand any market, we should first distinguish between the two key concepts of "trend" and "cycle", and the crypto market is no exception.
Trend: Trend is the long-term direction of the development of things and a grand and lasting force. It represents the most essential and core trend of things, just like a surging river, once formed, it is difficult to reverse.
Cycle: The cycle is the short-term fluctuation in the development of things, and it is the rhythmic change of swinging around the trend line.
Simply put, the cycle is in the trend. However, simple inclusion is not enough to express the complex relationship between them. If the "trend" is compared to the trunk of a tree, the "cycle" is like the rings on the trunk.
When 96% of the world's population does not yet hold Bitcoin, when sovereign funds begin to include crypto assets in their balance sheets, and when blockchain technology becomes a new battlefield for the game between major powers - this galloping "digital ark" has just sailed out of the dock where it was built. COINBASE:BTCUSD BITSTAMP:BTCUSD BYBIT:BTCUSDT.P PEPPERSTONE:XAUUSD BINANCE:BTCUSDT

Tips to make a profit of 5000+ on BTCUSDShort-term accurate signal analysis shows support near 76300. The current price rebounded to a maximum of 82000, with a profit margin of 5000+. The current price has rebounded to a maximum of 82,000, and the profit margin has reached 5,000+. There is no chance or luck in the transaction, and only strength can lead to victory.
If you don’t know when to buy or sell, please pay close attention to the real-time signal release of the trading center or leave me a message, so that you can quickly realize the joy of profit. COINBASE:BTCUSD BITSTAMP:BTCUSD BYBIT:BTCUSDT.P BINANCE:BTCUSDT

BTC New Low 68,000 $ BTC as per my view going till 68,000 $ then its going up side , on this chart i m goiving my thought , its take bit time .

BTCUSD latest important newsThe U.S. government recently announced that it will not sell nearly 200,000 Bitcoins obtained from the Silk Road case. Instead, these holdings will be included in the strategic reserve.
The decision eased concerns about a potential large-scale sell-off that could add further pressure to the market. Meanwhile, large investors, often referred to as “whales,” continue to accumulate Bitcoin despite the market’s continued volatility.
Some market observers believe this may be a sign of confidence in the asset’s long-term potential. However, the continued volatility shows that uncertainty remains a key factor in the current crypto landscape. COINBASE:BTCUSD COINBASE:BTCUSD BINANCE:BTCUSDT BYBIT:BTCUSDT.P

El Salvador Increases Bitcoin Reserves Despite IMF RestrictionsDespite IMF restrictions, El Salvador Bitcoin Investment continues to grow and expand, demonstrating President Nayib Bukele’s current strong commitment to cryptocurrency policy. At the time of writing, the Central American country has managed to increase its Bitcoin holdings to 6,111.18 BTC, worth approximately $504 million in current markets, while also engaging in complex relationships with various major international financial institutions.
El Salvador’s government has persisted and even accelerated its Bitcoin accumulation strategy despite an agreement with the International Monetary Fund, which has significantly restricted its cryptocurrency activities. The December 2022 deal, which was established after lengthy negotiations, involves a $1.4 billion loan as part of a broader financial package of more than $3.5 billion. ]
At the time of writing, El Salvador Bitcoin Investment has catalyzed and spearheaded an increase from 6,072 BTC in February to 6,111.18 BTC in March 2025. This strategic acquisition, such as it is, demonstrates the government’s unwavering resolve to maintain and optimize its cryptocurrency policy despite external pressure from various major financial institutions as well as a number of key regulators that have implemented several restrictions in the current market environment. BITSTAMP:BTCUSD COINBASE:BTCUSD BYBIT:BTCUSDT.P BINANCE:BTCUSDT

Bitcoin crash to $80K is normal, not the start of a major declinData confirms that the latest Bitcoin crash may be the result of a natural correction, rather than the start of a major downtrend.
Bitcoin has once again fallen below $80,000 for the second time this year, sparking investor panic. As fear spreads, many are questioning whether this drop marks the end of the Bitcoin bull run or if it is just a natural correction in the ongoing uptrend. The decline in peak losses shows Bitcoin in a natural correction; in recent analysis, even though Bitcoin has revisited the $80K range, the extent of realized losses is still significantly lower than previous corrections.
While CRYPTOCAP:BTC has revisited the $8.0K range, peak losses are still significantly lower than the late February to early March correction.
Total peak losses:
February 25: $933M
February 26: $897M
February 28: $933M
BITSTAMP:BTCUSD BINANCE:BTCUSDT COINBASE:BTCUSD BYBIT:BTCUSDT.P