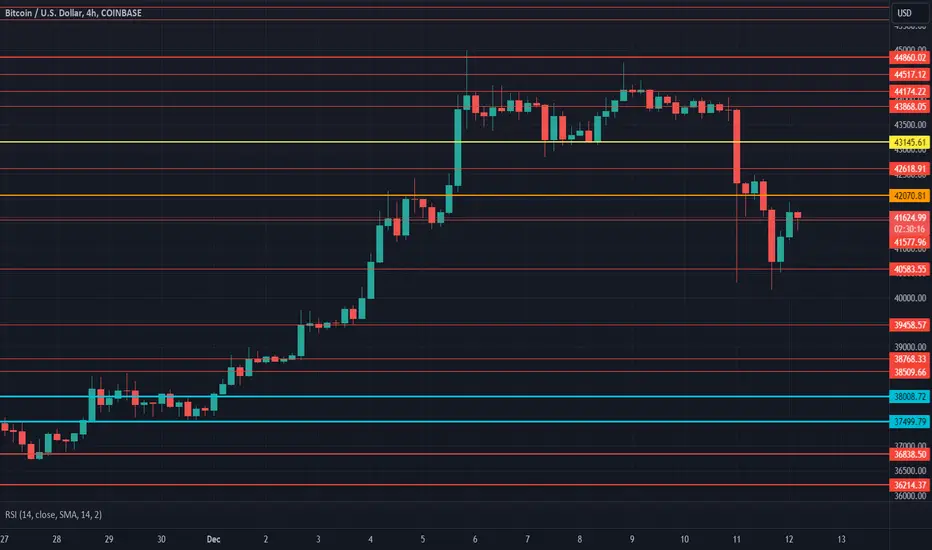
BTC RISKY SHORT SETUPHere's my Idea about Short term for BTC Short Position. Expecting an Dump
Entry Would be Around 43.6-43.7k
Stoploss Will be around 43868
Target will be 42.6k or 41.8k
The Trade is Risky So if you are degen then go for it or Use low levrage While Trading.
Follow For more Such good ideas & Don't Forget Share my ideas.
Btctrend

$BTC Daily UpdateCRYPTOCAP:BTC #BTC moving in tight range $44,174-$43,522, bearish engulfing forming on 4h currently, $43,145 support could test. RSI on 1D and 4H looking good, 3rd weekly close approaching with $43,868 resistance. Watch given S/R

$BTC Daily UpdateCRYPTOCAP:BTC #BTC Beautiful break of triangle here, $43,868 resisting, Previous 4H close looks fine, Bullish engulfing on previous 1D close as expected, RSI on 4h and 1d looking great. $44,174 resisted yesterday. $43,145 support looks good, needs to follow up on bullish engulfing.

$BTC Daily UpdateCRYPTOCAP:BTC #BTC $42,070 support in effect, current daily with potential to put bullish engulfing on. Eying $43,145 test. RSI looking good, Low on volume as of now, Green days ahead 🤩🤩! $40,583 key support, $44,174 and $44,860 key resistance areas.

BitcoinMost Altcoins have been in the red since the weekend and the past 24 hours have been no different. Ethereum is currently down 2% and below $2,200. Binance Coin (-1.5%) has dropped below $240.
Even larger daily drops come from Ripple, Dogecoin, Polkadot, and Polygon. Solana has lost 5% on the day and is down to just under $70.
Cardano and Avalanche have dropped the most compared to larger-cap Altcoins. ADA is down 6%, while AVAX is down 9% and trading below $40.
The cumulative market capitalization of all crypto assets has fallen by $50 billion since yesterday's peak of $1.6 trillion and dropped to $1,550 on CMC.

$BTC Daily UpdateCRYPTOCAP:BTC #BTC Testing $43,145 resistance at the top of the triangle, Amazing reversal followed by bullish pin bar 4h close at the bottom testing $40,583 support. Bullish engulfing on last 1D close, current daily moving for follow up. RSI on 4H and 1D looking good, Watch given S/R

Bitcoin BTC price moves according to fractal from the past v.2As we wrote in our previous idea, the Bitcoin price has been in a critical zone in recent days.
Tonight, sellers decided to step up and activated the red fractal from this idea:
At this idea depicted another fractal that was already on the BTCUSDT price chart. The logic of this fractal, and therefore the behavior of buyers/sellers, is similar to the fractal from the previous idea. However, there are slightly deeper drops here, but they have a chance to cover most of the CME GAPs that were formed during the current growth wave.
1. GAP $39310 - 40480, touched, but not yet completely filled.
2. Gap $34100 - 34400, not filled
3. GAP $27000 - 27300, not filled
Now you need to closely monitor the indicators of USDT.D and BTC.D, because now there is a redistribution of capital: part of it goes to usdt, and the other part hastily goes to the "selected" altcoins that did not have time to reach the desired target at this bull run.
Therefore, the next 1-3 days will be quite volatile, and we recommend that you refrain from trading with leverage.
Two events will also "add fuel to the fire" of position breakouts:
- 12.12.2023 - the announcement of the latest CPI
- 12/13/2023 - the announcement of a new FED rate, the last in 2023, and the speech of Mr. Powell's speech on the outlook for the economy and financial markets in 2024
If you are interested in reading our thoughts and experience, please be active: like and comment on the idea. And we, in turn, will update this idea as events unfold.

$BTC Daily UpdateCRYPTOCAP:BTC CRYPTOCAP:BTC Descending Triangle forming on 1D and 4H, let's see in what direction this breaks, $40,583 support in effect followed by a bearish engulfing on 4H, if 4h shoots closing above $42,070 the Descending Triangle will break bullish, previous daily close with bearish engulfing

BTCUSD H1, SHORT ENTRY UNTIL 38700, SEE WHY .... Hello Traders!
In this stage, I see BTCUSD H1 falling until the level of 38700 (even lower), because it has to close a liquidity gap, and also, hit the level of 38400, a very important level of resistance.
At the moment, I see BTC under bearish dominance and I consider it a good moment to enter short.
Keep in touch!
Follow me for more ideas/trade perspectives!
www.tradingview.com

$BTC Daily UpdateCRYPTOCAP:BTC #BTC $42,070 resisted and $43,145 resisting as expected, $42,070 current support, RSI on 4h and 1d looks fine, Previous daily close bullish, $44,174 retest likely then $44,860 key resistance to break, Continue watching given S/R

BTCUSD H1 Future Scenario, looking for a Long entry 📈✅Hello Traders!
This is my perspective for BTCUSD H1, interesting reaction from the level of 43300. I expect a retracement until the level of 38700, and after that I will search for a long position.
At the moment, liquidity was closed and also, we can see a reaction from the OB.
Good opportunity to entry short.
Keep in touch.
P.s. Follow me for more analysis: www.tradingview.com

Bitcoin Price Hovers Above $40,000 Ahead of FOMCBitcoin (BTC) is showing weakness ahead of the Federal Open Market Committee (FOMC) meeting scheduled for December 13. Federal Reserve Chairman Jerome Powell is expected to provide an economic forecast summary after the release of the Consumer Price Index (CPI) data, indicating that inflation in the U.S. has decreased to 3.1%, aligning with market expectations.
Bitcoin Price Prepares for Increased Volatility Before FOMC
Investors have shown caution and reduced risk ahead of the FOMC meeting, evident in a 40% decrease in trading volume over the past 24 hours. After the announcement of the U.S. CPI data for November, the Bitcoin price briefly surged to $42,000 before retracing. Looking ahead, the prevailing view is that the Fed will maintain interest rates at the target range of 5.25-5.50%. In the latest meeting in November, the FOMC kept interest rates steady, as in the September meeting, signaling that rates may remain unchanged in the near future but are still open to change based on economic conditions.
The decision to pause interest rate hikes is widely anticipated, providing the Fed with additional time to determine whether the current interest rates effectively curb inflation's impact on economic growth.
The range of 5.25% to 5.50% was raised in the July meeting, marking the 11th interest rate hike in the 2022/2023 cycle, all aimed at managing inflation. This explains the observed unease in the Bitcoin price.
Implications for Bitcoin Price
The increase in interest rates makes investors more cautious, negatively impacting risk-based assets like cryptocurrencies. According to the CME FedWatch tool, there is a 97.1% chance that the Fed will keep the Federal Funds Rate target at 5.25% to 5.50% in the upcoming FOMC meeting, while 2.9% of opinion polls predict a change to 5.50-5.75%.

$BTC Daily UpdateCRYPTOCAP:BTC #BTC current daily and 4h candle not looking good as of now as a bearish engulfing forms, $40,583 support testing, avoided bearish engulfing follow up yesterday with previous daily closing above current support. Watch given S/R

#BTC/USDT#BTC
Bitcoin price is still moving in the Side channel it is expected to walk through.
Price now 38088 $
The price is expected to bounce to the lower border of that channel at the price of 28,329 and bounce from it in the channel's income for a period of time
before completing the rise by breaking that occasional channel to the level of 68,000
What I expect next Between Jan to March 2024
Until then, the price is expected to respect those accidental powers.
Place buy and sell orders with Stop Loss
Take advantage of rebound zones, whether up or down
I wish you a happy trade.

BTC 4 Year Cycle with TA giving 40k @ Xmas 2023 - 220k Sep 2024Before I start a couple of Historical Teasers:
BTC is Finite in Volume - 21,000,000.
BTC has transitioned from a little known FAD, scam, criminal entity with no value to one of a globally recognised and trusted P2P currency with with huge potential for storage of value (Digital Gold).
Everything is going Digital and that includes all currencies.
This chart speaks volumes from a technical analysis point of view with the following indicators being highlighted:
1 - "The Trend is your Friend" - Light Blue ATH & ATL Trend Lines.
2 - Four Year Cycle between Peaks. Light Grey Sine Wave.
3 - Trend Crossing Channels (Trends). Lime Green Lines with angle of ascent in Blue.
The ATH & ATL Trend Lines are important as to break through one indicates serious change. Whilst this may seem obvious it is important to note that the longer a trend line the greater its strength. For BTC to go below the ATL Trend Line would require a very serious (Global?) event to occur.
On a long term basis, successful quoted instruments will often traverse from the ATL Trend Line to the ATH Trend Line in rapid steps followed by a lengthy period of horizontal steps until it reaches the next ATL Trend Line point. (There are obviously fluctuations during this period).
BTC IMO is starting it's 3rd Cycle (Transition) from the ATL Trend Line to the ATH Trend Line. If correct we will see 40K by Christmas this year (23) and 220k by 9th September 2024.
And if the above TA isn't enough just look at where we are outside of TA?
We're talking Inflation, Wars, Spot ETFs and so on.
40k by Xmas 220k by Sep 2024 - Love to All and Peace on Earth.

$BTC Daily UpdateCRYPTOCAP:BTC #BTC dropped to $40,583 support Currently struggling at $41,577 support area. $43,145 support required to reattempt at $44,174 resistance. Bearish engulfing on last daily close, should avoid follow up today. Current key support $39,458, expect resistance at $42,070 & $43,145
Bitcoin Traders Cautioned as Whales Trigger Sharp Price DropContent: Bitcoin is experiencing its most significant drop in nearly a month, catching the market off guard on Monday, shattering the optimism, also known as "hopium," for continued price growth until the SEC approves the BTC spot ETF in January 2024. However, the sudden market downturn has left investors surprised, leading to this optimism being shattered, attributed to the "whale panic" caused by significant whale selling.
Daily Market Momentum Report: Bitcoin Whales Trigger Market Plunge
Bitcoin's price has nearly dropped below $40,000 in the last 24 hours, with contracts worth over $340 million liquidated in just a few minutes. Although the exact reason behind this collapse is uncertain, the primary cause seems to be whale selling. This is evidenced by the Coinbase Premium Gap (CPG) registering a sharp decrease to -250. Simply put, CPG is an indicator that tracks the difference between the Bitcoin price listed on Coinbase (USD pair) and Binance (USDT pair). It provides an idea of whether US-dominant investors (Coinbase) or global users (Binance) are buying or selling more than the other. Whenever this premium gap is positive, US investors are considered to be driving buying pressure, while negative values point to global users, creating selling pressure.
However, the significant drop in this index on Monday indicates whale intervention. This was further confirmed by the decline in reserves on the Binance exchange, noting the sale of around 16,000 BTC worth over $671 million accumulated over the past week.
This sell-off has caused panic among users, resulting in a 7% intraday trading drop, pushing BTC to a low of $40,654. Cryptocurrency has since recovered, trading at $41,839 at the time of writing.
Since the beginning of December, traders have been limiting exposure to high leverage in the derivatives market. The collapse on Monday may heighten this skepticism, causing traders to be cautious until January.

BTC Pivot point for next yearBTC Pivot For next year
The market will start to rise around May and will see new prices of 110K 120K and 180K
The above pivots were placed for guidance and use for support and resistance

Active BTC.USD $BTC.X Weekly outlook. 2nd WK DEC 2023Active BTC.USD BITSTAMP:BTCUSD
Weekly outlook. 2nd WK DEC 2023 (SAMPLE)
> BULLISH 📈
Closed Price: 43,352
Target Price: 45,324
Upper Range: 48,188
Lower Range: 42,460

My BTC trendlineCircle is where i bought.
Now have no money to buy more.
In April 2024 BTC will have halving again so until then main major trend is Uptrend.

#BTC/USDT
#BTC
Bitcoin is trading in an upward trend to the 37000 $ level.
After the price broke the 27,800 $ level, which is a strong resistance level.
Once it was breached, the price went up after the bearish flag breached the major one.
We expect the price to rebound to test the 27,800 $ level to 31,000 $ again and proceed sideways at those levels until the beginning of 2024.
It is expected to break the 37,000 $ level, heading to the 68,000 $ levels, in the period from April 2024 to June 2024.
All of this is supported by significant momentum on Bitcoin.
A lot of positive news in the coming period
I hope the analysis helped you.

Bitcoin: "Gold on Steroids" with Institutional InfluxBitcoin has frequently been compared to Gold over the years. Initially deemed a "safe haven" similar to Gold, analysts are currently evaluating these two investments to determine if Bitcoin meets the criteria as "Gold on steroids." Relative returns are adjusted for the risk of Bitcoin compared to Gold.
Over the past 5 years, up to November, Bitcoin's Sharpe Ratio has competed favorably when compared to Gold and other proven asset classes in the market. The Sharpe Ratio is defined as the difference between the return of an investment and the risk-free rate divided by the standard deviation of the investment. Simply put, the Sharpe Ratio adjusts performance for risk beyond what investors would bear for a specific asset. Jurrien Timmer, Global Macro Economic Director at Fidelity, notes that Bitcoin's correlation with the S&P 500 (+40%) is higher than that of Gold (+14%) over a 5-year period. However, the correlation between BTC and the US stock market has decreased over the years and is lower than most asset classes.
Over the past 12 months, the correlation between BTC and the S&P 500 has decreased from 40% to 25%. Timmer argues that Bitcoin is more volatile than most other assets, but the volatility impacts both ways, and BTC investments have their own risk-reward characteristics, as seen in the past decade.
According to a CoinShares report, institutional investors continue to pour money into Bitcoin funds, with a weekly inflow of $132.8 million as of December 4th. At the time of writing, the price of Bitcoin is $44,162 on Binance.

Might be last chance,43-44 kI believe it is again last chance to buy long. All bulish over a week, I want to go green 💚. It's my first idea. Let's see how it goes.
