Bitcoin Price Targets Upside MomentumBitcoin's price is currently in an upward trend, starting in November 2022. The asset has surged from $15,700 to its local high of $37,991 on November 15, 2023. BTC may encounter resistance around the psychological level of $40,000 in its ongoing bullish trend.
The Exponential Moving Averages (EMA) at 10, 50, and 200 days stand at $36,918, $33,848, and $29,590, respectively, potentially serving as support levels for the asset's pullback. In case of a downturn, Bitcoin's price could retreat to the 38.2% Fibonacci retracement level at $35,861, measured from the high of $69,121 in November 2021 to the local low of $15,396 in November 2022.
Btctrend

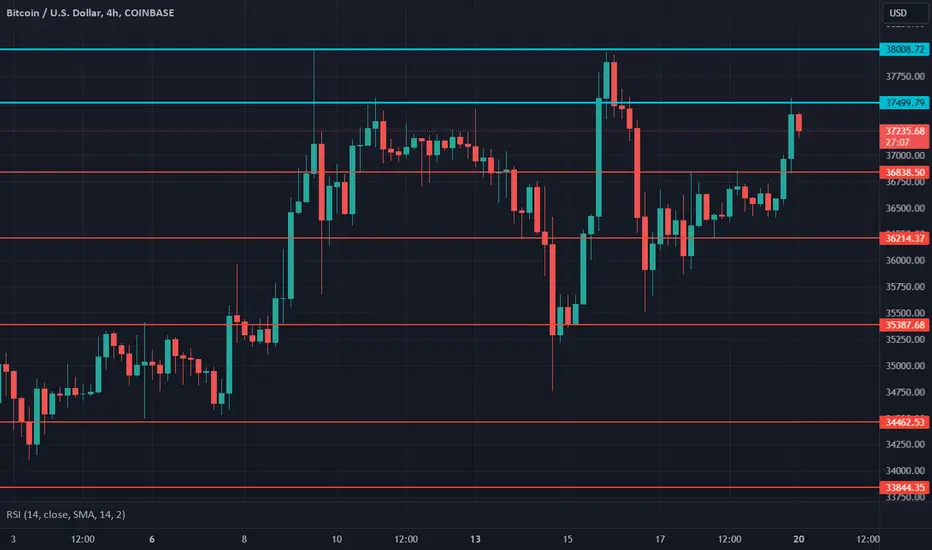
$BTC Daily UpdateCRYPTOCAP:BTC #BTC $36,214 support held good, testing $37,499-$38,008 resistance range now, 4th attempt here, Previous 1D closed hella bullish! RSI on 1d and 4h looking good, $36,838 support not yet tested

$BTC Daily updateCRYPTOCAP:BTC #BTC broke $36,868 support, back above $36,214 - yet to be tested for support, Binance's Cz stepping down news hit with bearish engulfing on 1D, jumping back up good, must hold above $36,214 to avoid follow thru. Expect resistance at $36,868.

Bitcoin (BTC) Outlook Amid Regulatory ShiftsBitcoin's price continues to decline, but there's optimism following recent US Department of Justice actions that may pave the way for approving Bitcoin spot exchange-traded funds (ETFs). Analysts point out that one obstacle to approval is the dominance of the Binance exchange in the Bitcoin market, which has shown weakness, recording a 3% decrease for the day, particularly after news related to Binance. Testing a critical support level at $36,788, and with the Relative Strength Index (RSI) indicating weakening momentum, BTC may face a decline. Increasing selling pressure below the $36,788 support within the extended range from $36,276 to $37,301 could present an opportunity for an extended price drop, with experts predicting it could reach the psychological level of $30,000.
Currently, the Awesome Oscillator (AO) bars have turned red and are inching towards the daily midpoint, suggesting a gradual bearish takeover. Conversely, rising buying pressure from investors looking to capitalize on the retest of the $36,788 level may push Bitcoin's price higher. Initially surpassing the local peak at $37,972, it could then test the higher range at $37,980 and ultimately achieve the psychological milestone of $40,000, representing a 10% increase from current levels.

Bitcoin (BTC) Short SetupOKX:BTCUSDT.P Short 1W
Rising wedge
+
Entrance 31745
=
Exit 18475
I am interested in your opinion on this algorithm of actions
deposit 20% of asset
order 20% of deposit
leverage ×20
cross margin
take profit 25+-% of order
stop loss 5+-% of order
day loss 1% of deposit
RR 1 to 5
Entry on negative news background
+
At negative mood of trendsetters
+
No nearby reports, speeches
+
Bearish chart and candlestick patterns
+
A pool of indicators signalling a downtrend
#DYOR

Expired BTC.USD Weekly outlook. 4th WK NOV 2023Expired BTC.USD Weekly outlook. 4th WK NOV 2023
> BULLISH 📈 CORRECT
Closed Price: 36,115
Target Price: 37,225 | Strike Price: 37,769 NOV20
Upper Range: 41,276
Lower Range: 33,175

$BTC Daily UpdateCRYPTOCAP:BTC #BTC $37,499 resistance holding strong, $36,838 support tested and held beautifully, current support at $36,868. Previous daily closed with bullish pin bar, RSI on 1D & 4H looking good, struggling to gain $37,499 as a support, currently testing. Continue watching given S/R

Bitcoin Price Trend: Potential Upside Faces Resistance at 37,972Bitcoin is currently hovering near crucial support at $36,788 after breaking into an extended supply zone from $36,276 to $37,301. To sustain the upward trend, prices need a decisive move above this level and surpass the resistance at $37,972.
Until then, Bitcoin's upward potential is under threat, with the Relative Strength Index (RSI) showing no change. The Awesome Oscillator (AO) also supports a subdued outlook, with its histogram bars in red, trending towards the middle line. If this continues, the AO might soon turn bearish.
Increasing selling pressure could push Bitcoin below the $36,788 support, potentially testing the rising trendline support at $35,410. In a more severe scenario, the decline might extend to the psychological level of $34,000, while the Buyers' Strength Level (BSL on the chart) remains below.
However, to confirm an extended downward trend, Bitcoin must break and close below the midline at $30,824 of the supply zone (currently acting as a trend-breaking tool) extending from $30,126 to $31,524. If this level fails to hold as support, BTC could slide towards $29,753.

$BTC Daily UpdateCRYPTOCAP:BTC #BTC testing $37,499 resistance, last 1D closed with bullish engulfing, needs a follow thru today to take $38,008 support. RSI on 1D and 4H looking good, 3rd attempt on key resistance range underway, $36,868 support not yet tested
BTC rising wedgeBTC UPDATE: BTC is currently forming rising wedge on 4hrs TF which is bullish channel and still in uptrend on 4hrs TF in as much we are holding 35.6k 4hrs bullish OB strongly…..
In as much BTC holding the support at 35.6k strongly on 4hrs TF we are good but any break of the bullish channel and break of previous lower low at 34458 will trigger the price to daily support at 31857.8 where the imbalance is so be careful and watch the BTC PA here…..
Expected price if 31.8k can’t hold after break of the bullish channel will be 28.8k, 26.4k and 25k but if we bounce with good volume from 31.8k means 40-45k should be expected…
Stay safe and watch the PA before making new move
Follow for more market update

$BTC Daily UpdateMIL:BTC #BTC failed to follow thru bullish engulfing on 1D, $36,214 support testing, failed to gain $37,499, like I said expect some struggle in this key resistance range $37,499-$38,008. 4H and 1D both RSi looking goods, Current support at $35,387.

#BTCUSDT Urgent Udpate.#Bitcoin Update: Didn't take much time for the retest.
Continuation is highly likely. However, if things go south, this is what am doing:
Made some insane gains in the last few days, I am happy and I'll just keep it.
Minimizing my exposure to futures and I am ready to DCA on the spot for my alt bags if that scenario comes out.
DYOR, NFA.
#Crypto
Follow me for more updates, I will be posting more altcoins in the next few days to buy in the dips.

$BTC Daily UpdateCRYPTOCAP:BTC #BTC Given resistance at $38,008 tested, as expected struggle is normal in this range, bearish engulfing on last 4h close, $37,499 testing for support, RSI on 4H looking good, beautiful bullish engulfing on 1D, let's see if follows thru, next resistances $38,768, $39,458,

Expired BTC.USD Weekly outlook. 3rd WK NOV 2023Expired BTC.USD Weekly outlook. 3rd WK NOV 2023
> BULLISH 📈 CORRECT
Closed Price: 36,670.78
Target Price: 37,428.80 | Strike Price: 37,769 NOV15
Upper Range: 40,218.28
Lower Range: 34,639.32

ADA to start growing faster than BTCCRYPTOCAP:ADA & BITSTAMP:BTCUSD
The recent performance of ADA (Cardano) suggests it is a promising buy for investors. After a strong recovery from a support level of $0.23 on October 19, ADA experienced a significant rally, soaring by 65% to reach $0.40 by November 11. Although it's trading slightly below this peak, ADA is maintaining an upward trajectory, indicating potential for further growth. The currency seems poised to reach or even surpass its upper range near $0.42, which could represent a gain of around 16% from its current value. This pattern of recovery and growth makes ADA an attractive option for those looking to invest in the cryptocurrency market.
COINBASE:BTCUSD

Bitcoin Price Nears $35,000 Support Amidst Market Correction"The current Bitcoin price is trading at $35,536, officially confirming a correction in the downward trend. The convergence of Moving Average Convergence Divergence (MACD) indicators shows bars extending below the 0 line, and the MACD line moving below the signal line, signaling the intersection in the official downtrend. The intensifying downward trend causes altcoins to nearly drop below $35,500 before bouncing back above the crucial support level.
However, this recovery may not be sustained in the upcoming trading sessions, potentially leading to a further decline in BTC value. The next major support level is the local support line at $33,901, which could push the Bitcoin price down to $31,507.
Yet, if broader market signals attempt to bring optimism to the cryptocurrency space, BTC may escape the $33,901 support level to avert a crisis. Reclaiming $35,000 as support would weaken the bearish stance, propelling the cryptocurrency above $35,500 and targeting $40,000.

$BTC Daily UpdateMIL:BTC #BTC dropped to $35,387 support following a bearish engulfing on 4h, Currently testing the support, previous daily close above the support looks great, RSI on 4h and 1D looking good back to normal from overbought region, some consolidation here in short-term before next 🚀

Bitcoin to continue moving downwards until tomorrow eveningthere was a significant drop in the price of Bitcoin as it experienced a sudden decline of $1000, bringing it down to $35,344 by the evening. This downward movement caught the attention of traders and market observers. The Relative Strength Index (RSI), a commonly used technical analysis indicator, also signaled a bearish trend, further supporting the notion of a potential price decrease.
During this period, Bitcoin exhibited a rapid decline, with the price falling by approximately $75 every 15 minutes. This swift descent created an atmosphere of heightened volatility and uncertainty within the cryptocurrency market. Traders and investors closely monitored the situation, considering various factors that could have contributed to this particular market movement.
Events like these serve as reminders of the dynamic nature of cryptocurrency markets and the importance of closely monitoring price trends and utilizing technical indicators such as RSI to aid in decision-making. It's crucial to conduct thorough research, stay informed about market developments, and exercise caution when engaging in cryptocurrency trading or investment activities.

BTC Surges to $37,900 on Optimism Over U.S. Regulatory Approval"Bitcoin hits $37,900 for the first time in a year and a half, driven by expectations of U.S. regulatory approval for a Bitcoin spot exchange-traded fund (ETF). Trader sentiment improves as the U.S. Securities and Exchange Commission (SEC) reviews 12 Bitcoin ETF applications.
At the time of writing, Bitcoin is trading at $36,683 on Binance. The market-leading cryptocurrency has seen a nearly 5% increase in value over the past week.

BTC Weekly Analysis - Will the price fall to $25,000?BTC has made contact with the top of the Weekly Bull Channel and has come up against some resistance. In my previous 4HR analysis, I showed the potential for a measured move from the 4HR Bull Channel to the Weekly Bull Channel Resistance, we have reached that price of about $38,000. Where do we go from here?
Key Points
1. Bull Channel means we should always be Long.
2. Bitcoin has touched Weekly Channel Resistance
3. Wait for the weekly candle to close below the channel top
4. There is a gap between the current price and 30EMA/200EMA
5. RSI is overbought. A weak indicator on its own but supports #2-#4.
Before trading this chart, the weekly candle needs to close tomorrow to confirm whether or not we are breaking out of the bull channel. I remain neutral until we see that result; however, I am slightly more bearish on the price given #2-#5 of the key points. Also refer to my BTC lifetime analysis where I argue that before every new all-time high, BTC touches lifetime support. We have not yet made contact with lifetime support and believe we have one more fall to $20,000-$25,000 before new all-time highs.
As always, trade at your own risk, you are responsible for your trades. I hope this analysis was insightful and useful.
Trade wisely and let us know what you think in the comment section below!

Hovers at $37,000 – A Call to Pause Trading for Your BenefitBTC has recently been hovering around the $37,000 mark, displaying a level of volatility that demands our immediate attention.
In times like these, it is crucial to take a step back and evaluate the situation objectively. The rapid rise and fall of BTC's value can be overwhelming, and it is our responsibility to protect our investments and ensure the stability of our trading practices.
Therefore, I strongly urge you to consider pausing your BTC trading activities temporarily. This pause will allow you to reassess your strategies, analyze the market trends, and gain a clearer understanding of the factors influencing BTC's current volatility. By doing so, you will be better equipped to make informed decisions that align with your long-term trading goals.
Here are a few reasons why taking a pause in BTC trading is in your best interest:
1. Minimize potential losses: Volatile periods often lead to unexpected price fluctuations, making it challenging to predict market movements accurately. By temporarily stepping away from BTC trading, you can avoid making impulsive decisions that may result in substantial financial losses.
2. Gain perspective: Taking a break from trading provides an opportunity to reflect on your overall trading approach. Use this time to analyze your past trades, identify patterns, and refine your strategies accordingly. Remember, successful trading requires continuous learning and adaptation.
3. Reduce emotional stress: The constant ups and downs of the crypto market can take a toll on your mental and emotional well-being. Pausing BTC trading allows you to alleviate the stress associated with monitoring price movements, enabling you to approach future trades with a clear and focused mind.
4. Seek expert advice: During this pause, consider consulting with trusted experts or financial advisors who can provide valuable insights into the current market conditions. Their guidance can help you gain a broader perspective and make more informed decisions when you resume trading.
I implore you to prioritize your financial well-being and take this opportunity to reevaluate your trading strategies. By pausing BTC trading temporarily, you can safeguard your investments and position yourself for long-term success in this dynamic market.
Remember, the crypto market is ever-evolving, and it is crucial to adapt and stay informed. Use this time wisely to educate yourself, stay updated with market news, and explore new investment opportunities that align with your risk appetite.
If you have any questions or need further guidance, please feel free to reach out to by commenting below.
Thank you for your attention, and I urge you to make a responsible decision for your financial well-being. Let us approach this volatile period with caution and emerge stronger as traders.

$BTC Daily UpdateCRYPTOCAP:BTC #BTC gained $36,214 support! beautiful wick testing $37,499-$38,008 (key resistance range), currently testing $36,868, Support at $36,214 looking good, RSI on 4h looks good, previous daily closed with some sell pressure, $35,387 should be key support here, watch given S/R

Unpublished Idea of Bitcoin Price Prediction {09/Nov/2023}Some trade ideas if I am not sure will go Unpublished and it will be left out alone for a long time.
The next idea coming soon of price prediction on bitcoin.
Thank you for your support.
Happy Trading,
Fx Dollars.
