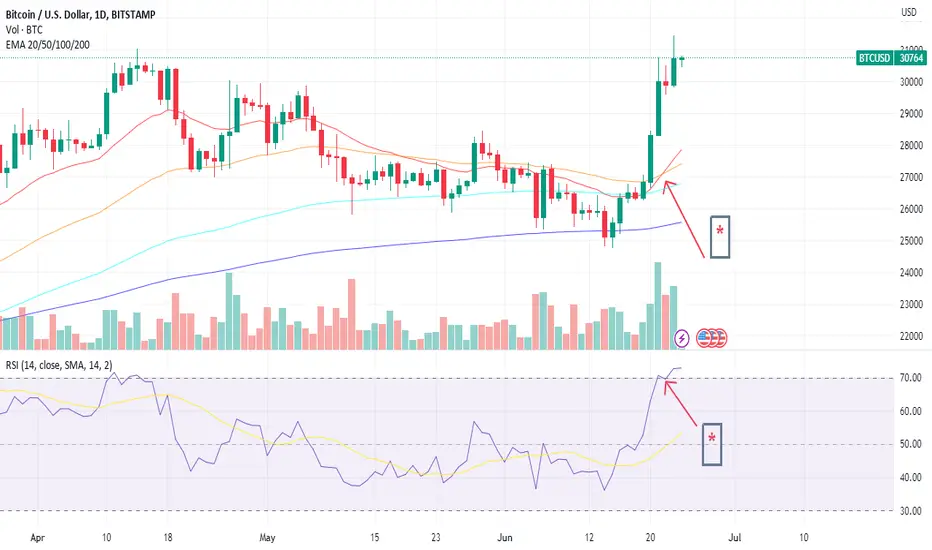
BTC Moving Average Remains Flatline with RSI Below 60Over the past few weeks, we have witnessed a rather unsettling trend in the BTC market. The moving average, a key indicator used to assess the overall direction of an asset's price, has been alarmingly flatlined. This lack of movement indicates a potential stagnation or absence of significant price momentum.
Furthermore, the relative strength index (RSI), a widely used oscillator that measures the speed and change of price movements, has dropped below the critical level of 60. This drop below 60 suggests the market sentiment has weakened, and BTC may be losing its upward momentum.
Given these indicators, we must cautiously approach the current BTC price action. While the cryptocurrency market is volatile, the prolonged flatline in the moving average and the declining RSI should not be taken lightly. This situation demands carefully evaluating our trading strategies and risk management techniques.
Therefore, I urge you to reassess your positions, review your stop-loss orders, and consider implementing tighter risk management measures. As traders, we are responsible for adapting and responding to changing market conditions, and this moment calls for heightened vigilance.
Please remember that no single indicator can predict the future with absolute certainty. However, considering the current BTC price action with the flatline moving average and the dropping RSI, we can make more informed decisions and navigate the market more cautiously.
Stay informed, stay vigilant, and remain focused on protecting your capital. Together, we can weather these challenging times and emerge stronger.
If you have any questions or need further guidance, please comment away.
Btctrend

Urgent Notice: Bitcoin Price Dips Below SMA 50 and SMA 100As you may be aware, the Bitcoin price has recently dropped both the Simple Moving Average (SMA) 50 and SMA 100 below, indicating a potential shift in market sentiment.
The current state of the Bitcoin market demands our utmost attention and prudence. Acknowledging the significance of these indicators is crucial, as they often serve as reliable signals for assessing market trends. While we cannot predict the future with certainty, it is essential to exercise caution and evaluate the potential implications of these technical indicators.
In light of the Bitcoin price dipping below the SMA 50 and SMA 100, we strongly advise you to pause your trading activities temporarily. Taking a step back during uncertain market conditions can help protect your investments and minimize potential losses. By refraining from trading now, you can gain a clearer perspective on the market's direction and make informed decisions based on a more comprehensive analysis.
We understand that pausing trading can be challenging, especially when the market is filled with excitement and opportunities. However, it is crucial to prioritize risk management and the preservation of your capital. By temporarily halting your trading activities, you can avoid making rushed decisions driven by emotions and ensure you are well-positioned to capitalize on future opportunities.
As seasoned traders, we know that patience and discipline are the key ingredients to success in cryptocurrency trading. Taking a cautious approach during uncertain times demonstrates your commitment to long-term profitability and sustainability.
Please remember that this email serves as a friendly reminder, not as financial advice. It is always recommended to consult with a qualified financial advisor before making any trading decisions.
In conclusion, we urge you to take a moment to reassess your trading strategies and consider pausing your Bitcoin trading activities temporarily. Doing so can protect your investments and navigate the market with a clearer perspective. Remember, during challenging times, the most successful traders rise above the rest.

Bitcoin Opportunities: Identifying the Next Entry for PositionAs passionate advocates of Bitcoin's potential, we must stay informed and seize opportunities when they arise. Today, I would like to discuss an essential technical indicator that can help us make informed trading decisions and maximize our Bitcoin positions.
Recently, Bitcoin's Relative Strength Index (RSI) has been a topic of interest among traders. The RSI is a widely used momentum oscillator that measures the speed and change of price movements. It provides insights into whether an asset is overbought or oversold, allowing us to identify potential entry points for trading.
Bitcoin's RSI has reached a value of 55, indicating a relatively neutral position. While this may not signify an immediate buying or selling signal, it is a valuable indicator for future movements. As cautious traders, we can leverage this information to our advantage.
Considering the historical patterns and trends observed in Bitcoin's price movements, an RSI of 55 has often preceded significant upward momentum in the past. By strategically adding Bitcoin positions when the RSI hits this level, we can capitalize on upward price movements and maximize our gains.
Therefore, keep a close eye on Bitcoin's RSI and consider adding to your BTC positions when it reaches 55. However, it is essential to exercise caution and conduct thorough research before making any trading decisions. Remember, the cryptocurrency market can be highly volatile, and it is crucial to manage risk effectively.
In conclusion, Bitcoin's RSI of 55 is a potential entry point for trading, allowing us to seize opportunities and maximize our Bitcoin positions. We can make well-informed decisions that align with our long-term goals by employing a cautious approach and conducting a thorough analysis.
Stay vigilant, stay informed, and let's continue to support the growth and adoption of Bitcoin together. If you have any insights or thoughts regarding this topic, please feel free to comment. Let's keep the conversation going!

BTC Update ✔Hello Traders. Hope you are having a great weekend. BTC is in a range as you can see on the chart. Breaking the range would result into a fast move in that direction. In my opinion it would go up to 33-35K zone.
What is your idea?
Comment down below.

Important Update: Bitcoin 100 SMA Will Cross 50 SMAI wanted to bring an important development to your attention that could impact your Bitcoin trading strategies. The 100 Simple Moving Average (SMA) is currently on the verge of crossing the 50 SMA, indicating a potential shift in market dynamics. I urge you to consider this information cautiously and adjust your expectations accordingly.
As experienced traders, we know that technical indicators play a vital role in understanding market trends and making informed decisions. The SMA crossover is a widely followed indicator that can offer valuable insights into the market's direction. In this case, the imminent crossing of the 100 SMA over the 50 SMA suggests a possible shift toward a bearish sentiment.
While it is crucial to approach such indicators with a cautious mindset, it is equally important to adapt our trading strategies to changing market conditions. Given this potential bearish signal, expecting a lower profit per trade may be prudent shortly. This is not to say that profitable opportunities won't arise, but rather to encourage a more realistic and conservative approach.
To navigate this evolving landscape, I encourage you to reassess your risk management strategies and consider implementing tighter stop-loss orders. By setting predefined exit points, you can protect your capital and limit potential losses if the market continues favoring the bearish sentiment.
Furthermore, exploring alternative trading strategies better suited for bearish market conditions may be beneficial. Diversifying your portfolio by allocating some of your funds to a hedging or short-selling strategy can help mitigate potential losses and take advantage of downward price movements.
Staying updated on the latest market news and analysis from reliable sources is essential. By visiting informed, we can better position ourselves to make well-informed decisions and adapt to changing market dynamics.
In conclusion, the imminent crossing of the Bitcoin 100 SMA over the 50 SMA is a significant development that calls for caution and a realistic approach. Expecting lower profit per trade and adapting our strategies will help us navigate potential bearish market conditions. Remember to reassess your risk management strategies, consider tighter stop-loss orders, and explore alternative trading strategies that align with the current market sentiment.

Bitcoin Could Break 31K Today Despite The Sell SignalsBitcoin Bounced Back from key level and now is trying to move up. will it break 31K or the Sell Signals were the sign of reversal ? two new bearish patterns emerged too which could get invalidated today if we go above 31.4
Thanks for watching and buckleup for a move

Bitcoin Continues Its Bullish Run - Time to Consider BTC PositioI am thrilled to share some exciting news that will surely bring a smile to your face: Bitcoin's bullish momentum is back and stronger than ever!
As we all know, Bitcoin has always been the torchbearer of the cryptocurrency market and has made some remarkable moves lately. The recent price surge has taken Bitcoin above the previous bullish flag, indicating a clear bullish trend that we cannot ignore.
The current market sentiment is undeniably positive, with Bitcoin's price surpassing previous highs and showing incredible resilience. This indicates that the bulls are firmly in control, paving the way for potential gains. It's a perfect time to consider positioning yourself for the next leg of this exciting journey!
So, why should you consider BTC positions right now? Here are a few compelling reasons:
1. Upward solid momentum: Bitcoin's price has broken through resistance levels, suggesting a sustained bullish trend. This presents an excellent opportunity for traders to ride the wave and potentially reap significant profits.
2. Growing institutional interest: Major financial institutions and corporations increasingly embrace Bitcoin, recognizing its value as a store of wealth and hedge against inflation. This institutional adoption is expected to drive further demand and potentially increase prices.
3. Limited supply, increasing demand: With a fixed collection of 21 million coins, Bitcoin's scarcity catalyzes its value. As more individuals and institutions enter the crypto space, the need for Bitcoin will likely surge, potentially driving the price to new heights.
You might be wondering, "What should I do next?" Well, it's time to take action and seize this opportunity! Here's your call to action:
1. Evaluate your portfolio: Assess your current holdings and consider allocating a portion towards Bitcoin. Diversifying your crypto portfolio with Bitcoin positions could help you capitalize on its bullish trend.
2. Set a strategy: Define your entry and exit points and a risk management plan. This will help you navigate the market with confidence and minimize potential losses.
3. Stay informed: Closely on market trends, news, and expert opinions. Staying informed will help you make informed decisions and adapt your strategy accordingly.
Remember, the cryptocurrency market is highly volatile, and investing involves risks. It's essential to conduct thorough research and consult with a financial advisor before making any investment decisions.
So, my fellow traders, let's embrace this bullish momentum with open arms and position ourselves for potential gains. The Bitcoin journey continues, and it's time to join the ride!

Will BTC hold at 30k or drop due to lack volume? I wanted to bring to your attention a matter that requires careful consideration regarding the future of Bitcoin. As you may be aware, there has been a significant increase in the value of Bitcoin, with a recent rise to $30,000. However, it is crucial to acknowledge the potential risks associated with this surge and the impact it may have on the liquidity of Bitcoin.
Liquidity plays a vital role in the stability and sustainability of any asset, including cryptocurrencies. It refers to the ease with which an asset can be bought or sold without causing a significant impact on its price. In the case of Bitcoin, the lack of liquidity can lead to increased volatility and potential price manipulation.
Given the current circumstances, it is essential to closely monitor Bitcoin's liquidity levels. A lack of liquidity may result in sudden drops in value due to a limited number of buyers or sellers in the market. Such declines can be severe and could potentially cause substantial losses for investors.
Therefore, I strongly encourage you to closely monitor Bitcoin's liquidity and closely follow any developments in the market. Stay informed about the trading volumes, the number of active buyers and sellers, and any significant changes in the overall market sentiment. By doing so, you will be better equipped to make informed decisions and take appropriate actions to safeguard your investments.
In conclusion, while the recent surge in Bitcoin's value is undoubtedly exciting, it is crucial to approach this situation cautiously. The lack of liquidity could potentially lead to unexpected drops in its value. Therefore, I urge you to remain vigilant and closely monitor the liquidity levels of Bitcoin. By doing so, you can protect your investments and make informed decisions.
Thank you for your attention to this matter. If you have any questions or require further information, please do not hesitate to comment.
Remember, knowledge is power in the world of investments. Stay informed, stay cautious, and make well-informed decisions.

$BTC is ready to take off 🚀🚀🚀CRYPTOCAP:BTC is currently in the process to head higher, there are multiple confluences on the weekly TF. Not only is there a bullish cross over on the MACD and the TSI, but it seems as though bitcoin has formed an inverted h/s pattern. Based off the fibs and the rules of supply and demand. BTC has hit an important point , and will most likely retrace to the .382 or .50 point in which both areas are consistent with being in the same zone as the indecision candle from the previous impulsive move. So expect more for bitcoin next retrace to >29-28k area, then start heading towards 40k. Remember this is on the weekly TF so it will take time to playout.
Good Luck!!
#TeamBoomin 🚀


Bitcoin's Bullish Inverse Head and Shoulders PatternToday, I bring exciting news about Bitcoin that might ignite your trading instincts. Bitcoin has recently formed a bullish inverse head and shoulders pattern, indicating a potential upward trend that could lead to significant gains. This pattern has caught the attention of many seasoned traders eagerly positioning themselves for potential profits.
Let me briefly explain its significance for those unfamiliar with the inverse head and shoulders pattern. This technical pattern is formed when a cryptocurrency's price experiences three distinct lows, with the middle low (the "head") being lower than the surrounding two lows (the "shoulders"). The formation resembles a head placed between two shoulders, hence the name. When the price breaks above the neckline, which connects the highs of the shoulders, it often signals a bullish reversal and a potential uptrend.
Now, why should you be excited about this pattern? Historically, inverse head and shoulders patterns have proven to be reliable indicators of upward price movements. They have signaled significant rallies, and many traders consider them strong buy signals. While past performance does not indicate future results, it's worth noting that this pattern has often provided traders with profitable opportunities.
Considering the current market sentiment and the growing interest in cryptocurrencies, now might be the perfect time to set up your Bitcoin positions. By capitalizing on this bullish inverse head and shoulders pattern, you can ride the wave of a significant price surge. However, as with any investment, conducting research and making informed decisions that align with your risk tolerance and trading strategy is crucial.
To help you take advantage of this exciting opportunity, I encourage you to explore various trading platforms that allow you to establish Bitcoin positions quickly. Whether you prefer traditional exchanges or user-friendly mobile apps, numerous options are available to suit your needs. Take the time to analyze the features, security measures, and fees associated with each platform, ensuring you select one that aligns with your requirements.
Successful trading requires discipline, patience, and a thorough market understanding. Stay informed, watch the latest news and developments, and never invest more than you can afford to lose. The crypto market can be volatile, but it can also be advantageous with careful analysis and strategic decision-making.
So, dear Bitcoin traders, seize this opportunity to profit from the bullish inverse head and shoulders pattern. Set up your Bitcoin positions confidently and embark on this exciting trading journey. May the markets be in your favor!


Is SMA 100 the Ultimate Indicator for Bitcoin Traders?Are you tired of constantly searching for the perfect indicator to time your orders? Look no further because SMA 100 might be the answer you've been searching for!
SMA 100 is a simple moving average that calculates the average price of Bitcoin over the past 100 days. It is a powerful tool that can help you identify trends and make informed decisions about when to buy or sell Bitcoin.
What makes SMA 100 so reliable is its ability to filter out short-term price fluctuations and focus on long-term trends. This means it can help you avoid making impulsive trades based on temporary market movements and make more strategic decisions based on the overall trend.
Not only is SMA 100 reliable, but it is also straightforward to use. All you need to do is add the indicator to your chart and watch for crossovers between the Bitcoin price and the SMA 100 line. When the price crosses above the SMA 100 line, it could signal to buy, and when it crosses below, it could be a signal to sell.
So, are you ready to take your Bitcoin trading to the next level? Consider watching SMA 100 for Bitcoin timing of orders and see how reliable and straightforward it can be. Take advantage of this opportunity to improve your trading strategy.

Bitcoin repeat bar patternBTC 4hr here we see the same extension target shown a different way by a repeat bar pattern So if the previous pattern which took price from 24.8k to 31.3k was to repeat, our bullflag extension at 35k will provide the next level of support

Bitcoin stagnatesIs there a sense of concern regarding the current state of the BTC market? As you may have noticed, BTC has stagnated while the RSI remains above 50, and the MACD has declined into negative territory.
These indicators suggest that we may be entering a bearish phase and need to act accordingly. While it can be tempting to hold onto our BTC in the hopes of a rebound, it is crucial to consider the potential risks.
That is why I am encouraging you to consider selling your BTC now. We can minimize our potential losses and protect our investments by taking action now.
Of course, the decision to sell is ultimately up to each trader. However, I strongly urge you to look closely at the current market conditions and make an informed decision based on your risk tolerance.

Good news for BTC traders - Declining MACD and rising MA 50 crosAs you might already know, the MACD (Moving Average Convergence Divergence) is a popular technical indicator traders use to identify potential trend reversals and momentum shifts in the market. Recently, we have seen a decline in the MACD for BTC, which is a positive sign for traders.
Moreover, the MA 50 (50-day moving average) has crossed over the MA 200 (200-day moving average), another encouraging sign for BTC traders. This crossover indicates that the short-term trend is moving higher, and the long-term trend is bullish.
All of this is exciting news for BTC traders, and it might be a good time to consider trading BTC. With the declining MACD and the rising MA 50 crossing over MA 200, the market is showing signs of potential growth.
So, if you're looking for an opportunity to trade BTC, now might be the time to take action. Don't miss out on this potential growth opportunity.

BTC ANALICESAfter the growth of several thousand dollars, Bitcoin has reached the weekly supply area again and is expected to fall from here
I think it can go as high as $32,644 and drop sharply from there
In this case, the Bitcoin targets can be the following numbers
$30,000
$29,000
$27,900
$27,000
In general, my bearish scenario is stronger than bullish scenarios.

Will Bitcoin momentum continue as RSI is overbought?As you may already know, Bitcoin has been on a steady climb since the beginning of the year, and it shows no signs of slowing down.
I'm thrilled to report that Bitcoin's Relative Strength Index (RSI) is currently over 70, which is a strong indicator of an overbought market. The Simple Moving Average (SMA) 50 is also greater than SMA 20, which is another bullish signal.
What does this mean for you? It means that Bitcoin could continue to climb to new heights, potentially reaching $32000 or higher. This is an incredible opportunity for traders to capitalize on the market's upward momentum and potentially make some serious gains.
So, I encourage you to consider the potential of Bitcoin's current market conditions and to make informed decisions about your trading strategy. Don't miss out on this exciting opportunity to potentially profit from Bitcoin's continued growth.
BTC Breakout Alert! Blackrock ETF Speculation Sparks Bullish RSIThere is some exciting news to share with you today. Bitcoin has broken out of its recent range and shows bullish solid momentum. This is due to the speculation of Blackrock ETF, which has caused the RSI and MACD to turn bullish.
As you know, Blackrock is one of the world's largest asset managers, and if they launch a Bitcoin ETF could be a game-changer for the cryptocurrency market. This news has already caused a surge in Bitcoin's price, and the momentum will continue.
If you haven't invested in Bitcoin, now is the time to consider it. The market shows bullish solid signals, and the potential for significant gains is high. Bitcoin has proven to be a resilient asset, and with the backing of a company like Blackrock, it could soar to new heights.
So, what are you waiting for? Don't miss out on this opportunity to invest in Bitcoin. The time is now with the Blackrock ETF speculation and bullish RSI and MACD.

BTCUSD BUYAccording to my analysis of Bitcoin. There is a high possibility to rise with the breach of the descending channel, as well as the resistance at 26250. There is more rise in the coming days towards the level of 28000. good luck for everbody

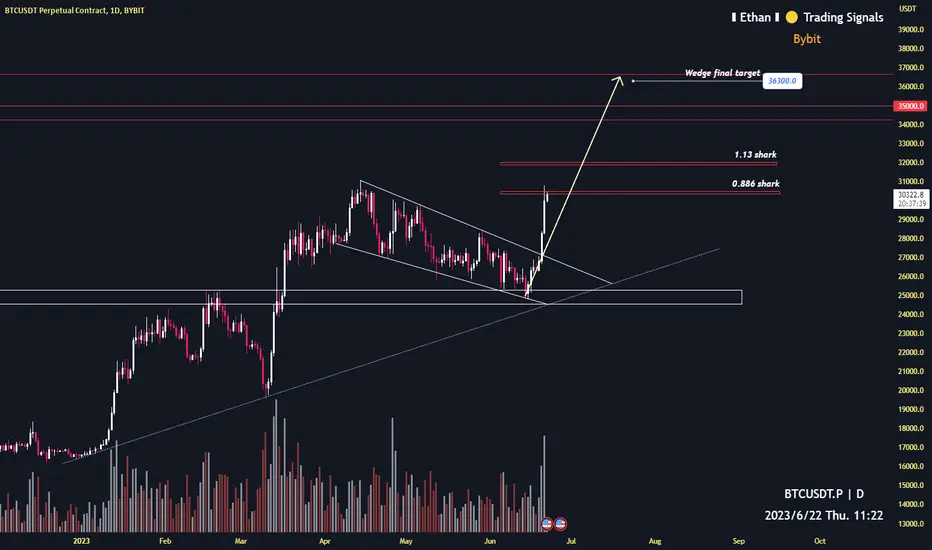
Bitcoin 3 key resistance for short!1D time frame
-
Key resistances: 30500, 32000, 36300
Be careful of any reversal signals at these prices
Stay prepared to open short until this bear really end
BTC ready to go back 27k in next 2weeks4h time frame
-
BTC still creating a falling wedge.
With this time structure.
We will see 27000 around June 20th.
Then can judge breakout wedge to 32000 or get rejection again.

50d 200d Moving Cross just happened for BitcoinAs you might have noticed, Bitcoin has had a popular 50d 200d moving average cross, establishing a new support level. This strongly indicates that the market trend is moving upward, and it's an excellent opportunity for traders to consider positions.
Additionally, the RSI is at an optimal time for entry, meaning it's a great time to buy Bitcoin. With the combination of the moving average cross and the RSI, we can confidently say that the market is in an excellent position for traders to make a profit.
As a fellow trader, I encourage you to consider taking a position in Bitcoin. The market trend looks favorable, and it's an excellent opportunity to profit. Don't miss out on this chance to increase your trading portfolio.
