BtcAll the above red lines are resistance that can lead the price towards the two green lines. Be careful in trading, the market is very excited.
Btctrend

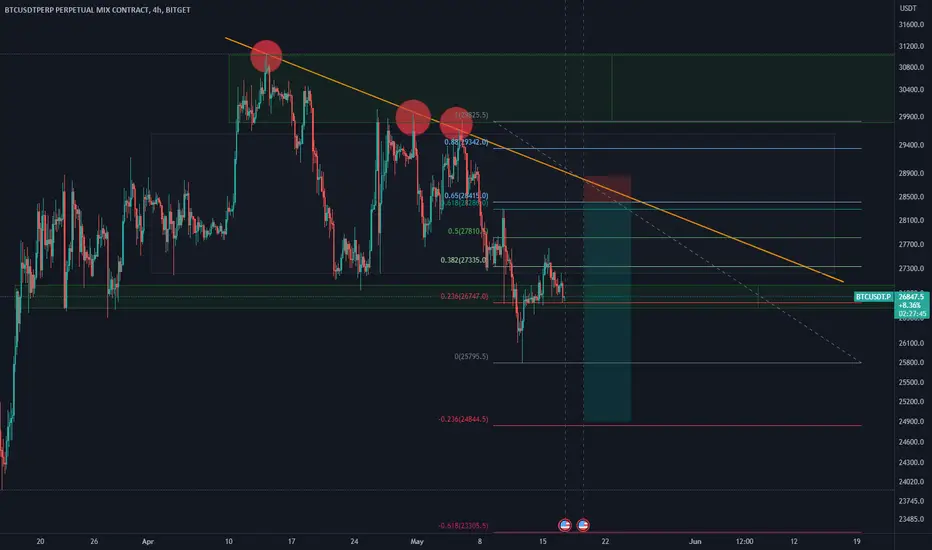
BTC/USDT BinanceBTC/USDT Binance
4H hollow candlesticks
Since mid-March, a sideways movement continues between $25860 and $31000 as an All-Time High (ATH).
In the present phase, a symmetrical triangle has been formed, where a price breakout is expected soon.
The Support area occurs from the extension of the golden ratio of the last Fibonacci retracement.
The Resistance area occurs, if we reverse the golden ratio of extension of the Fibonacci retracement starting from 15/03/2023.
Another conclusion, is that the price is expected to fluctuate within the Descending triangle that has been formed since 06/05/2023, until the price breakout occurs.
Finally, a hypothetical scenario is that the price may follow the slightly resized footprint (Bar Pattern), of a previous price movement (fractal).
Bitcoin (BTC) = $26,928.54 -0.54% (1d)
Market Cap: $1,126,847,982,844
24h Vol: $30,866,809,616
Dominance:
BTC: 46.3%
ETH: 19.4%
Good Luck
#CryptoHellas Team

long-term TPI update on BTCAs of right now, on the long term, BTC isn't looking as strong as it did at the start of this rally. We were neutral until the 13th of may, where we entered a bullish TPI score (above 0.2)
This TPI strength isn't conclusive, and I still think there is a big risk of us going down slightly. Expect market to be ranging for the next weeks

BTC trading advice today
btc is currently in a clear downward trend, with a target point of 26200, everyone must keep up with the pace.
btc trading advice today
btc:sell@26800-26900 tp:26400-26200
Trading strategies will be given every day to keep up with my trading signals

bitcoin short setup Hello Traders, here is the full analysis for this pair, let me know in the comment section below if you have any questions, the entry will be taken only if all rules of the strategies will be satisfied. I suggest you keep this pair on your watchlist and see if the rules of your strategy are satisfied. Please also refer to the Important Risk Notice linked below.
💥 BTCUSD 4H-TIMEFRAME ANALYSIS💥 BTCUSD 4H-TIMEFRAME ANALYSIS
💗Hello ladies and gentlemen
This is my new idea for 💥 Bitcoin
I hope my idea is clear
Support me by like and share thank you
Stay Safe💯💲💲💲
Good luck💰😍

💥 BTCUSD 1H-TIMEFRAME ANALYSIS💥 BTCUSD 1H-TIMEFRAME ANALYSIS
💗Hello ladies and gentlemen
This is my new idea for 💥 Bitcoin
I hope my idea is clear
Support me by like and share thank you
Stay Safe💯💲💲💲
Good luck💰😍

BTC-24 MONTH PRICE EXPECTATIONSHalving History Performance
A zoomed in view of yesterdays chart. The chart below illustrates the two prior halving cycles fractals 1 year pre & post the halving date.
Whilst past performance is no guarantee of future returns, the chart can help us frame the 24 month period ahead of us and give an idea of reasonable price expectations.
Reasonable Price Expectations
May 2023 - April 2024:
$19,150 to $44,284
(Average $31.7k)
May 2024 - April 2025:
$28,790 to $86,000
(Average $57.4k)

bitcoin short setup BTCUSDT SELL Now
price now is: 27500$
Sl: 27800$ , -300$
Tp: 26900$ , +600$(1:2)
TP2: 26500$ , +1000$
Hello Traders, here is the full analysis for this pair, let me know in the comment section below if you have any questions, the entry will be taken only if all rules of the strategies will be satisfied. I suggest you keep this pair on your watchlist and see if the rules of your strategy are satisfied. Please also refer to the Important Risk Notice linked below.
BTC Possible Ascending Triangle BTC - Potential Ascending Triangle
- A head and shoulders is playing out and should not
be ignored
- In the chart you'll find clusters of resistance which
define the resistance lines & zone
- These align with the potential triangle trajectory
resistance

BTC/USDT ANALICESbtc
Currently, it is stuck in the range of 26,900 to 26,600, it will break from either side and move in the same direction. In my opinion, it will either fall from the 30-minute order block, or it will go up and fall from the $27,100 order block, which is more likely to happen.
If it falls, the targets will be 26600 / 26500 / 26160 / 25900
In general, my opinion is on the decline.

BTC FALL BASED ON GAP AND H&S AND TRENDLINE.The good thing that is happening is that the head and shoulders pattern has been confirmed and the acceptance of the fall of Bitcoin has become accepted in the society and the fall will definitely continue until the trend line.
TP1@25381
TP2@20486
1. H&S CONFIRMED.
2. TRENDLINE CONFIRMED.
3.MARKET READY AND ACCEPT FALLING.

History Repeats Itself? Road to the 100K already started?Whenever we had this golden cross, the bull run started.
We will see If history repeats itself unless we get a black-swan like Pandemic.

BTC: Buy
In the 45m chart, MACD forms a golden cross, indicating that there will be a rising market, and the vicinity of 27800 is the resistance of the rise, and the long trade can be closed here.
Trading Signals:
Buy: 27400
Tp: 27780
Sl: 27200

BITCOIN DID ITS CORRECTIONAs promised BTC finally did its correction around 26.5K as predicted
We can see in coming days a Bullish BTC which can also breakout 30K resistance perhaps it can hit 40K
Disclaimer:This is my own opinion based on my own analysis

Btc short to 12295 $ ( Daily chart )Hello guys....
12k not Toch in before bullrun and The price of 12,000 dollars was touched only once in the last bull market and it is a very attractive price for whales. Note that too many untouched balances may have price reverting to them.
This time, we may see very low prices before the halving of Bitcoin miners' rewards, and after a year or two after the halving, we will see the highest prices.
Do you think the bat can catch the worm first or an eagle can have a wider choice between fish, rabbit and mouse.
So some sellers may be hunted by eagles because the price of 12,000 dollars is more attractive! Always thinking like whales will increase the probability of success. So before the rewards are halved, we see a lowest price and the whales buy their currencies from the hasty people and sellers.
I love you, be profitable and happy

Will $BTC Break through? (NFA)Will CRYPTOCAP:BTC Break through?
For those keeping an eye on Bitcoin's price movements, it can be difficult to predict what's next.
There are a few factors that could impact BTC's future price movements.
On the one hand, if large institutions continue to invest in Bitcoin and positive regulatory developments for Bitcoin continue, it is possible that BTC could break above $30,000 again.
However, if there is a general downturn in the cryptocurrency market sentiment and demand for Bitcoin decreases, BTC could fall back down to the $23,000-$25,000 range.
Keep an eye on these factors and stay informed as Bitcoin's price movements can be impacted by a variety of factors.

BTCUSD SWING TRADEso this trade i took on feb
was a btc SWING TRADE
its on breakeven now if it hit it hit if not goood
more than 50% to my target still rooting for the highest

BTC Facing Huge Sell Off This week.24.8K This week Is ImminentBitcoin touched 29K four times and we could tell big money is interested at that level because each time we touched that level big sell off happens.
I have incorporated Supply/Demand Into todays video . very interesting concept that has been playing out in the range that we are in (27.2-29k)
highly encourage you to watch this untill the end
Once we lose 26.8 then 24.8 will come
Please Support Me By Boost,Follow,Comment and sharing video
Thank you for all the support and thanks again for watching.

BTCUSD 7May2023according to my analysis, BTC is in the current correction wave, there is a big possibility that it will be bearish first before it continues its upward trend

BTC is Looking Good for BREAKOUT Trade BYBIT:BTCUSDT.P
BTC is in Uptrend following 30min TF from support
If BTC breaks trendline and starts Consolidating, Invites sellers for liquidity then we can expect a good Breakout.
but this phase is important for Breakout of 30k level.
Let's see what happens
For now BTC will go down after breaking the trendline. (Till Support level)

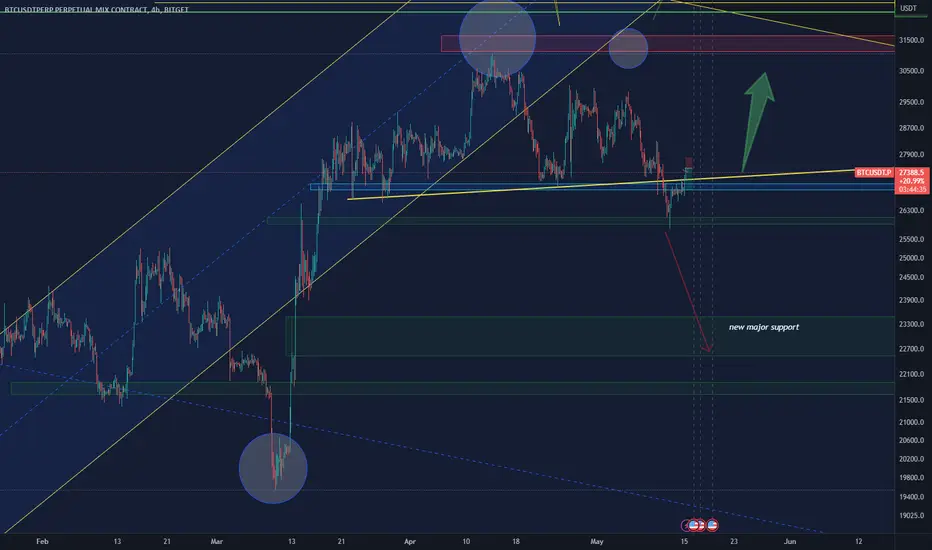
BTC/USDT Binance BINANCE:BTCUSDT Binance
4H hollow candlesticks
After the price breakout, we saw an all-time high (ATH) at $31000.
The beginning of the Support area, results from the extension of the upper point of the first Fibonacci retracement, combined with the extension of the golden ratio of the second Fibonacci retracement.
It seems that an uptrend parallel channel has been formed.
Conclusion:
The price is expected to fluctuate, within the uptrend parallel channel and the Support & Resistance areas.
Bitcoin Price (BTC) = $30.460,23 -0.84%
= 14.47 ETH -0.67%
Market Cap: 278.166.387.330
24h Vol: $47.878.436.872
Dominance: BTC: 46.1%
ETH: 19.8%
Good Luck
#CryptoHellas Team

Symmetrical triangle in BTCUSD with bullish biasH4 chart of BTCUSD making symmetrical triangle which means it can go in either direction however, there is bullish bias as there was Bullish divergence at the last LLs and the last LL was broken and new HH was printed at the level of 30150. So now 2 levels are important to determine direction of market if the last HL (27350) is broken trend will go bearish and if the last HH (30160) is broken then trend will go bullish. Most probably, market will go in up direction after breaking 30150 level so we should plan our buy stop entry at the break of 30150 and sell entry at the break of 27350.
