GOLD anyone ?...
hmmm...
...looking at this for a minute a day to smile, relax and recalibrate lasers
Btctrend

BTC/USD) Short Setup: Triple Top Formation Targeting 86,023 USD You’re seeing a potential Head and Shoulders structure (or at least a triple top) — with the orange circles marking failure to break higher around $95K.
The neckline (support) is slightly diagonal down toward the $94K region.
A breakdown is anticipated once the neckline fails.
2. EMAs Interaction:
30 EMA (red) is currently flattening, showing weakening momentum.
200 EMA (blue) is far below, around 88,181 USD, acting as a major support zone — and it aligns with the projected EA TARGET POINT.
EMA compression usually precedes a strong move.
3. Zones and Key Price Levels:
Entry Point: ~95,145.60 USD → high-probability short sell.
Stop Loss: ~96,000–96,957 USD → protects against unexpected breakout.
Target: ~86,023 USD → aligns with past accumulation zone and EMA200.
4. Risk/Reward Ratio:
Potential reward is about 9–10%.
Risk (from entry to stop) is about 1–2%.
Excellent Risk/Reward (>4:1).
5. Momentum and Volume (implied, not shown):
Given the topping pattern and lack of higher highs, buying momentum is weakening.
If volume increases on a breakdown, confirmation will be strong.
📊 Strategic Points:
Aspect Analysis
Trend Still bullish, but topping signs visible
EMA Behavior Short-term EMA flattening, long-term EMA rising slowly
Pattern Formed Triple Top / Head and Shoulders
Risk/Reward Very good (>4:1)
Recommendation Short bias around entry level, with strict stop-loss
⚡ Quick Trading Plan:
Entry: Short at ~$95,145
Stop Loss: ~$96,000–96,957
Target: ~$86,023

BTCI expect Bitcoin to move between 75k and 90k until it breaks out in one direction.
I hope to see further growth up to 120k. There is also a small chance to reach 150k, but for now it looks unlikely.
At the same time, there is a risk of a drop to the 50k–60k area, which would be about a 50% correction from the top, similar to what happened in 2021.

$btc Bitcoin's falling channel....CRYPTOCAP:BTC Bitcoin has seen an all time high of approximately 110k
Current price: $77700
Bitcoin price action is currently respecting the falling channel as seen. With price currently being supported by the 200EMA in the 75k region
Expecting price action to continue to respect this channel and test resistance levels at 88k and then around 92k (bullish divergence also spotted on 2D timeframe). Reactions which will determine higher prices or further rejection.
if #btc price action breaks down from this falling channel then expects supports at 66k and then 56k to be tested for support!

BTC Trade Idea — React, Don’t PredictBINANCE:BTCUSD
Smart Trading Requires Patience!
Bitcoin is currently undergoing a healthy correction.
Strong support is located around $87,500, and if confirmed by price action, it could offer a great buying opportunity.
Trading without a plan = gambling!
** Alternative Scenario:
If the $87,500 level breaks with strong confirmation, after a pullback to this zone, a short
opportunity could emerge.
Follow us for more professional insights!
#CryptoAnalysis #BTCUSD #TradingStrategy #Forex #Cryptocurrency

Bitcoin Pullback or Opportunity📊 Bitcoin Analysis – Pullback or Opportunity?
CRYPTOCAP:BTC hit strong resistance at 94,000 $ failed to push higher, entering a correction phase 📉. Key support zones now lie at 91,200 $ 87,500 $ , both of which have shown solid reactions in the past 🛡️. If price holds one of these levels, the next target could be around 98,500 $based on the previous move’s momentum 🚀.
📌 Price is still holding above the 200 MA, suggesting bullish momentum is alive but needs further confirmation ✅.
👇 What’s your take on the next move?
🔁 Save this if you're watching the next targets
📩 Share with a friend who's trading BTC right now

BTC TO THE MOON! or no?)I am closely analyzing Bitcoin’s (BTC) recent price action following its decisive break above the critical $88,700 resistance level. This breakout has shifted market dynamics, and several scenarios now appear plausible based on current structure and momentum:
Pullback and Continuation: BTC may experience a corrective move back to the $88,000–$89,000 zone, likely retesting the breakout level as support. For this bullish scenario to remain valid, BTC must reclaim and close above the prior monthly high (PMH) by the end of the current monthly candle, signaling strong buyer commitment and paving the way for further upside.
Immediate Advance with Later Correction: Alternatively, BTC could continue its ascent toward the PMH, potentially encountering resistance at this key level. A rejection here might trigger a retracement to the $88,000–$89,000 range, where buyers could step in to defend the newly established support.
Bearish Breakdown: Should BTC fail to hold above $88,000, a breakdown below this level could accelerate selling pressure, targeting the $83,000 region. Such a move would likely liquidate a significant number of leveraged long positions, amplifying volatility and potentially resetting the market for a deeper correction.
At the time of this analysis, BTC is trading at approximately $91,234, with a 24-hour high of $91,898 and a low of $90,123 as of April 24, 2025, reflecting heightened volatility post-breakout. Traders should monitor price action around the aforementioned levels, particularly the $88,000–$89,000 zone and the PMH, as these will be critical in determining the next directional move. Risk management remains paramount in this high-probability setup.

BTCHello friends
We tried to make everything clear on the chart, I hope you like it.
Good luck.
*Trade safely with us*

BITCOIN WEEKLY ANALYSIS - April 18th, 2025BTC/USD is currently hovering just below a major descending trendline and key horizontal resistance near the 91,500 level. 🧱
🔍 What We’re Watching:
- Price has tested the downtrend line multiple times — the structure is weakening.
- A breakout above 87,500 could trigger a strong bullish move.
- Until then, "Wait for the Breakout" remains the strategy. No confirmed long entries yet.
📉 Current Price: $84,500
📈 Breakout Confirmation: Clean close above resistance zone + volume spike = 🔥🔥 potential rally.
🧠 Pro Tip: False breakouts are common. Watch for confirmation — not just a wick!
Stay sharp, stay patient. Breakouts give the best reward-risk trades! 💹

Bitcoin 4h in Consodilation / BullishBitcoin is in consolidation since last couple of days. Once channel will be broken upside, we can buy Bitcoin with target
Target 1 : 86000
Target 2 : 87000
Target 3 : 88000
Target 4 : 89000

#BTC/USDT#BTC
The price is moving within a descending channel on the 1-hour frame, adhering well to it, and is on its way to breaking it strongly upwards and retesting it.
We are experiencing a rebound from the lower boundary of the descending channel, which is support at 74,300
We are experiencing a downtrend on the RSI indicator, which is about to break and retest, supporting the upward trend.
We are looking for stability above the 100 Moving Average.
Entry price: 79,056
First target: 80,422
Second target: 81,950
Third target: 84,000

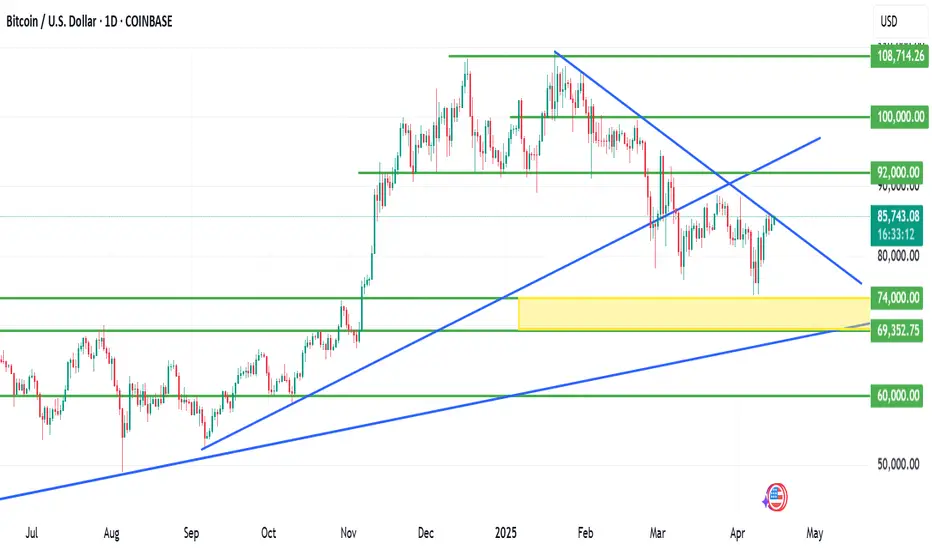
BITCOIN is kissing a critical resistance zoneBITCOIN is kissing a critical resistance zone.
Bitcoin is currently kissing a critical resistance zone, hovering around the $85,500 level. This region aligns closely with a descending trendline that has historically capped BTC rallies, and this test comes after a sharp recovery from a local low near $74,000, a drop that was triggered in tandem with broader risk-asset selloffs following U.S. tariff announcements and rising global macroeconomic tension.
Technical Analysis
The descending trendline (marked in blue on the chart) acts as a key resistance.
A daily close above $85,800 - $86,200 could confirm a breakout, potentially paving the way for a fresh attempt toward the $90,000 psychological level.
Conversely, failure to break and hold above this resistance could cause a rejection and pullback.
Immediate downside support lies at the previous local low (~$74,000), and below that, the next strong support zone is around $69,000 (yellow block on chart).
Fundamental Backdrop
Bitcoin continues to be driven by macroeconomic news, institutional flows, and growing ETF inflows.
If fundamentals remain bullish, including continued institutional accumulation, favorable regulatory developments, or increased on-chain activity, they could fuel momentum for a breakout.
The market doesn’t reward assumptions — it rewards preparation.
Whether it’s a breakout or a pullback, risk management should always come first. As always, protect your capital before thinking of profit. Use stop-losses, scale your entries, and avoid over-leveraging in volatile zones like this.
What’s your take on BTC at this juncture?
Do you see a breakout brewing, or is this another trap for over-leveraged bulls?
Let’s discuss
BTC/USD Daily Technical Outlook – Approaching Cycle Top?Bitcoin is currently trading around $85,500, maintaining short-term bullish momentum within a well-formed ascending structure on the daily chart. The price is now entering a mid-phase rally, with a clear target of $98,000, a key resistance level that coincides with the upper boundary of a rising wedge formation and historical trend extension zones.
Key Technical Levels:
Immediate Resistance: $88,800 (local supply zone)
Major Target Zone: $97,000–$98,000 (macro resistance + psychological round number)
Short-Term Support: $82,000
Key Breakdown Level: $78,500
While the momentum suggests BTC may continue to push higher in the near term, the $98,000 resistance is likely to act as a distribution zone, where buying may slow and profit-taking increases. This level could falsely signal a breakout, leading to a spike in retail long positions before the market enters a longer-term correction phase.
If rejection occurs at or near $98,000, BTC could begin a multi-month correction, with the primary downside target set at $49,000 by July 2025. This level aligns with previous weekly support, volume profile lows, and would represent a typical deep retracement following a major cycle top.
Outlook:
Near-term bias: Bullish toward $98,000
Macro bias: Bearish reversal expected from resistance zone
Cycle correction target: $49,000 (Q3 2025)

"Bitcoin Bearish Reversal Setup: Supply Zone Short Strategy"🔵 SUPPLY ZONE (Resistance Area)
💥 Strong selling area around 85,800 - 87,800 USD
Historically, price got rejected here
Expect sellers to step in again
✍️ ENTRY POINT
📍 Just below the supply zone (~85,889.89)
Ideal for short position setup
Watch for bearish candlestick patterns for confirmation
🛑 STOP LOSS
❌ Placed above the supply zone at 87,796.97
Keeps risk under control if breakout happens
🎯 TARGET POINT (Support Area)
📉 Around 78,000 USD
Marked by previous support and structure
Great Risk-to-Reward ratio
📐 PATTERN WATCH
Looks like a harmonic pattern (maybe Gartley or Bat) 🦇
Suggests reversal from point D
Also resembles a rising wedge, which is bearish
📊 EMA (9-period)
🧭 Price hovering above the 9 EMA (84,704)
A break below it = bearish confirmation
Summary
🔻 Bearish bias
🛒 Short near supply zone
❌ SL above 87,800
🎯 TP around 78,000

"BTC/USD Short Setup: Supply Zone Rejection & 5% Drop Target!"BTC/USD 15-Min Chart Analysis
Trade Setup by EA_GOLD_MAN_COPY_TRADE
---
🔼 SUPPLY ZONE (Resistance)
🟣 Price Area: $83,427.80 – $84,313.06
This is where sellers might step in
Price is expected to reverse or slow down here
🔽 ENTRY POINT
🔵 Sell Entry: $83,427.80
Entering short trade just below the supply zone
Aiming to catch a reversal move down
⛔ STOP LOSS
🔴 Stop: $84,313.06
Placed above the supply zone
Limits risk in case of breakout upward
❗ Protects the trade from loss beyond this point
🎯 TARGET / TAKE PROFIT
🟣 Target: $79,071.05
Major support zone / demand area
Potential Drop: -$4,434.27 (-5.31%)
Big reward zone if price dumps from supply
📈 Trendline & Moving Averages
🔵 Blue = Likely 50 EMA
🔴 Red = Likely 200 EMA
Bullish momentum leading into the supply zone
Trendline supports the prior uptrend, now testing reversal
💡 Conclusion
✅ Trade Bias: Bearish (short)
⚖️ Risk-to-Reward: ~1:5 (Great!)
If price reacts at supply, this setup could pay big
But if it breaks up, stop loss keeps you safe

BTC Possible buying opportunity Possible buying opportunity if Weekly 50 SMA and Fib level 61.80% hold the price.

Bitcoin Bullish Continuation Towards $128KBTC/USD | 1D Chart | April 2025
📊 Technical Analysis:
Bitcoin is maintaining its bullish structure within a well-defined ascending channel. The price has bounced off the lower trendline (green), which has provided strong support multiple times (see green arrows).
Currently, BTC is consolidating near $83,800, and a breakout from this zone could initiate the next impulsive move towards the midline and upper trendline resistance (~$128,000).
Support Levels: ~$80,000 (trendline)
Resistance Levels: ~$90,000, ~$110,000, and ~$128,000
Bullish Trigger: A confirmed breakout above $90,000 could signal strong continuation
🌍 Fundamental Analysis:
Bitcoin Halving (April 2024): Historically, BTC rallies post-halving due to reduced supply. The next supply shock could fuel a rally.
Institutional Demand: Spot Bitcoin ETFs continue to see record inflows, with firms like BlackRock and Fidelity accumulating BTC aggressively.
Macroeconomic Factors: With inflation concerns persisting, investors are turning to Bitcoin as a hedge, pushing prices higher.
📈 Trade Idea:
Entry: $84,000 (Breakout Confirmation)
Stop Loss: $79,000 (Below Trendline)
Target Range: $110,000 – $128,000 (Channel Resistance)


BTCUSD: Ready to Soar or Collapse?Hi Traders ! Possible Entries in BTCUSD (1H):
✅ Buy: If the price bounces off the lower line of the smaller ascending channel and breaks above 85,000 with volume. Additional confirmation if the RSI recovers above 60.
❌ Sell: If the price breaks down the smaller ascending channel, especially if it falls below 84,800. Extra confirmation if the RSI crosses below 50.
📢 Disclaimer: Not financial advice. Manage your risk properly.

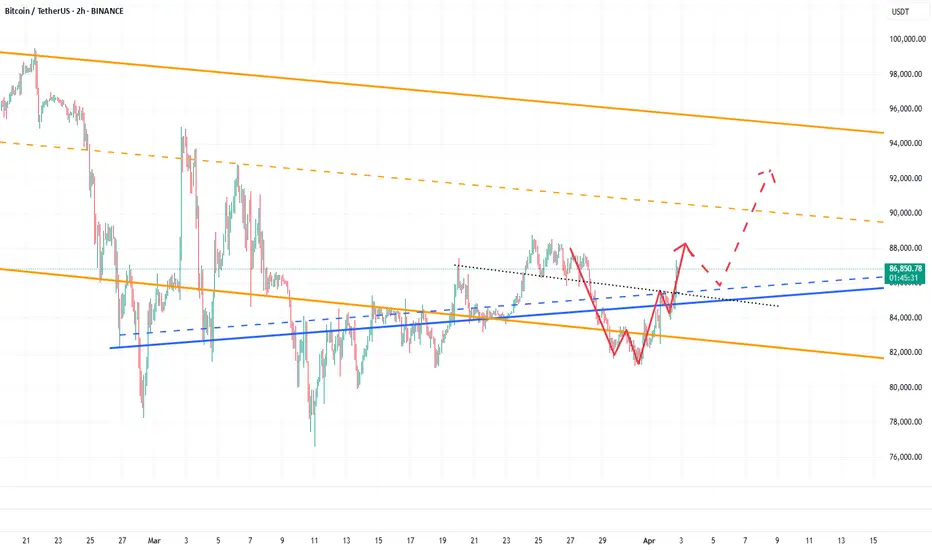
BTC already has the conditions to hit the 90000-95000 zone!A few days ago, I mentioned that BTC had the potential to surge towards the 90000-95000 range. Currently, BTC has already climbed above 87000 during its rebound, effectively opening the door to the 90000-95000 zone.
From a fundamental perspective, with bearish factors becoming clearer, if Trump adopts a more lenient stance on tariffs, BTC could extend its rebound. On the technical side, BTC has successfully broken through the short-term resistance around the 85500 level, turning the 85500-84500 area into a short-term support structure. This transition further supports BTC’s continuation to the upside, potentially testing the 90000-95000 range.
For short-term trading, we can consider waiting for a technical pullback and looking to go long on BTC once it retraces to the 85500-85000 region. The trading strategy verification accuracy rate is more than 90%; one step ahead, exclusive access to trading strategies and real-time trading settings
Grasp the trend and analyze the full range of BTC longsTechnical analysis: Based on in-depth technical analysis, the current BTCUSD decline has slowed down, and there are signs of building double bottom support. The 50-day moving average and the 200-day moving average form a golden cross, the MACD indicator continues to strengthen and the bar chart continues to expand. As BTCUSD stops falling, market sentiment is gradually warming up, institutional funds continue to flow in, fundamental support is solid, and the upward momentum may gradually strengthen. It is the right time to go long.
BTCUSD operation strategy: Go long in the 82500-81500 area. Target 83000-84000
Trading discipline: 1. Don't blindly follow the trend: Don't be swayed by market sentiment and other people's opinions, operate according to your own operation plan, market information is complicated, and blindly following the trend is easy to fall into the dilemma of chasing ups and downs.
2. During the transaction, we will continue to pay attention to news and technical changes, inform us in time if there are changes, strictly implement trading strategies and trading disciplines, move forward steadily in the volatile market, and achieve stable asset appreciation.

$BTC 1H Chart Analysis, what is next?📊 CRYPTOCAP:BTC 1H Chart Analysis
Things are not as simple as some analysts claim — the situation remains delicate.
🔑 Key Resistance Levels:
Double Resistance in Play:
- Descending Bearish Channel on the weekly timeframe.
- Previous Resistance from the March 20th pump.
🏗️ Current Market Structure:
Horizontal Consolidation Pattern:
- Top Resistance: $87.5K — potential rejection point.
- Bottom Support: $34.3K — previously a resistance, now acting as support.
📉 Possible Scenarios:
Bearish Scenario:
- Rejection at $87.5K could lead to support at: $34.3K (Green horizontal support).
- $33.5K (Red ascending pattern bottom).
Bullish Invalidation: Break and hold above $91K would invalidate the bearish downtrend.
If successful, we likely avoid retesting $80K.
📅 Conclusion:
Until CRYPTOCAP:BTC breaks $91K, we remain in a bearish downtrend, despite the short-term daily uptrend.
The weekly timeframe suggests we could still reverse and go lower if $90K holds as resistance.
#Bitcoin #Crypto #MarketAnalysis #BTC #Trading #CryptoNews
DYOR

Bitcoin (BTC/USD) Trade Setup – Potential Reversal & Target Leve🔵 Entry Point:
🔹 Around $83,678.04 – The suggested buying zone.
🛑 Stop Loss:
🔻 $82,998.62 – The price level where the trade will be exited if it moves against the plan.
🎯 Target Points:
✅ TP1: $84,144.23 – First profit target.
✅ TP2: $84,787.10 – Second profit target.
🏆 Final Target: $85,560.84 – The ultimate goal for the trade.
📈 Technical Overview:
🔹 The price is at a support level, with a potential reversal to the upside.
🔹 Risk-Reward Ratio is favorable, with a clear uptrend target.
🔹 DEMA (9) at $83,776.52 indicates a possible trend shift.
