Bitcoin: Short first, then long.
Despite the fact that the Bitcoin (BTC) price trend should have been boosted last week from the perspective of the US dollar and risk appetite, unfortunately, the cryptocurrency market experienced negative news. According to reports, cryptocurrency bank Silvergate announced that it will postpone the submission of its annual 10-K report for the 2022 fiscal year, stating that "the company is currently analyzing certain regulatory inquiries and investigations related to the company." Shortly after, many cryptocurrency companies and trading platforms, including Coinbase, Circle, and Tether, urgently announced the termination of their business dealings with Silvergate. The news caused panic in the cryptocurrency market and put pressure on Bitcoin prices.
This week's risk events are also relatively frequent, and I think the likelihood of short-term Bitcoin prices rising above 25000 is small. From the 4-hour chart, we can see that the starting point of the last rebound has been breached, so the support level is expected to move down to around 21460. Therefore, the short-term trading range is around 22040-21460.
In terms of operation strategy, investors can trade within this range of 22040-21460.
Liking, commenting, and subscribing are your greatest encouragement to me. Follow me to make trading easier! You are also welcome to read other ideas below.
BINANCE:BTCUSDT COINBASE:BTCUSD
Btctrend


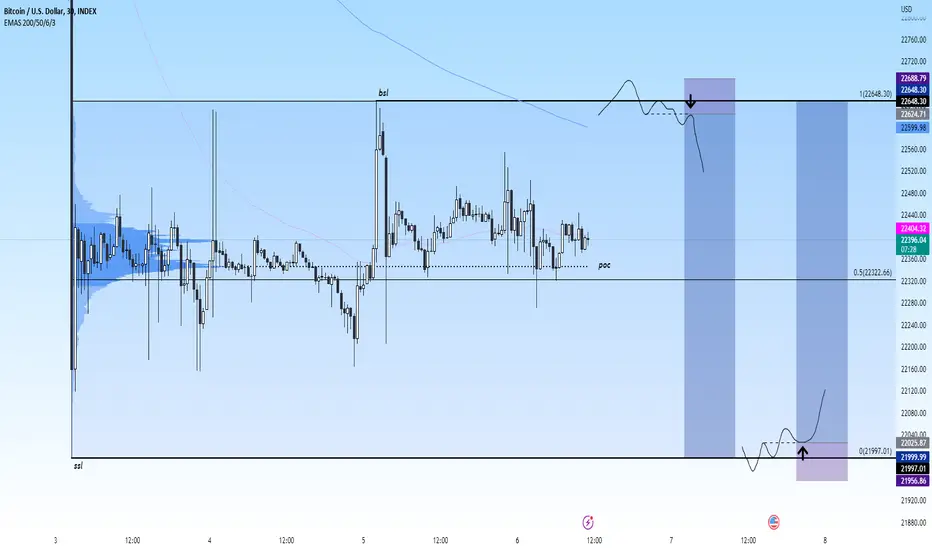
Bitcoin trend falls and meets support, there is a chance to star
Talented people do not necessarily have good opportunities; being underappreciated requires less lamentation and more reflection. There is no need to be impetuous in life; the more others look down on you; you have to calm down and examine your own objective conditions before you may find a way that suits your talents. If a person wants to achieve success in his own business, he will be unable to achieve anything if he has the shortcomings of frivolity and impatience; he needs a serious and down-to-earth style to do anything
This wave of Bitcoin's decline is fully in line with expectations. The current price has reached the lower neckline support range. In the short term, pay attention to the 21400 support situation. After the support consolidation, you can enter the market in a short time. Bitcoin operation recommends buying at 21400, stop loss at 20900, target 22800-23500.
Bitcoin bearishness is based on the following:
1. Although Bitcoin has fallen from a high level to near the previous platform, the general trend is still dominated by short positions.
2. According to my personal analysis, the five-wave rise of wave A has all ended, and the current fall of wave B a is close to the key point. If it stabilizes here, there may be a rebound of wave B b.
3. The upper pressure is 22800~23500, and the lower support is 21400~20900.
Traders, if you like this idea or have your own opinion about it, please write in the comments. I will be happy 👩💻

Bitcoin is likely to usher in a short-term rebound
Talented people do not necessarily have good opportunities; being underappreciated requires less lamentation and more reflection. There is no need to be impetuous in life; the more others look down on you; you have to calm down and examine your own objective conditions before you may find a way that suits your talents. If a person wants to achieve success in his own business, he will be unable to achieve anything if he has the shortcomings of frivolity and impatience; he needs a serious and down-to-earth style to do anything
Bitcoin pierced the bottom of the previous session yesterday and hit a new low. So far, the first phase of the decline has been completed, but it is still 400 points away from the key support of 21500, which is a flaw. At present, the probability of a rebound here is gradually increasing. Since the trend is still short, it is mainly to sell on rallies. Bitcoin operation recommends selling at 23600, risk control at 24200, target 21500~21400. Or drop to 21400 to buy, stop loss at 20900, target 23600.
Bitcoin bearishness is based on the following:
1. Although Bitcoin has fallen from a high level to near the previous platform, the general trend is still dominated by short positions.
2. According to my personal analysis, the five-wave rise of wave A has all ended, and the current fall of wave B a is close to the key point. If it stabilizes here, there may be a rebound of wave B b.
3. The upper pressure is 23500~24000, and the lower support is 21500~21400.
Traders, if you like this idea or have your own opinion about it, please write in the comments. I will be happy 👩💻

Important Event Today - Bitcoin Ready To Move On Both sidesBitcoin/4H In a bear flag pattern with low volume
With the pattern and volume bitcoin is doing tells us that a BIG move is comin which potentially we could touch the origin of the dump which is around 23.6 consolidate and build more longs , then K-Boom goes down around 20500 ( top of the CME gap)
A less potential move is because of more shorts we could legdown a little bit first ~ 22k or 21.7 then it goes all the way back up to 23.6 which in this case the upside should be very intense due to the liquidity to the upside
Reminder: As a Trader We should always have levels on both side so we dont miss any moves

BTC update...#BTC update...
#Bitcoin is accumulation for bigger moves... Untill then scalp only...
On LTF i'm waiting for a position when BSL or SSL get swept out...
It's hard to wait for your trade, but it's worth it... Patience...
BTC Monthly BollingerNot looking to hot for the crypto market leader, running into monthly resistance as well as the macd showing no signs of turning around anytime soon. ggs

possible scenario to BTC crashLook at the reaction to the levels, everything seems possible and it can be pulled below 10000, the fundamental factors are created and found by themselves. This is just a pessimistic opinion and it might not happen at all.

BTC Update ✔Hello Traders. Hope you are doing well. Last time BTC formed a QM pattern which is a reversal pattern that I published in my analyses. Now it has formed a triangle as well as you can see on the chart. On the daily you can see a huge divergence on RSI too which suggests that BTC is going into the correction. The trigger that shows us that BTC is certainly going to go down is if price breaks the triangle to the downwards.
What do you think guys?
Comment your thoughts on what is going to happen. ❤

BTCUSDT ShortThe price has been forming an "m" pattern for the past few weeks and I am anticipating that the price might break out of the current pattern and continue with the bearish momentum.
The pattern broke out of the rising flag I had predicted earlier, which gives me the validation to sell the coin.
My entry is at $22000, Stop loss at $23000 and the target is $18000
My target R: R is 1: 4

Bitcoin Under Pressure As Expected, Shorts Take Profits
Bitcoin has been short at 23,900 for many consecutive days, and it has already been traded for profit. The market outlook will maintain the original idea, continue to be bearish on Bitcoin, and those who have not entered the market can wait for a rebound in the evening. After the rebound, rely on the pressure of 23,800 to sell empty orders Can be re-entered. The operation suggests selling at 23800, risk control at 24400, and target at 22300-21500.
Bitcoin bearishness is based on the following:
1. Although Bitcoin has reversed and adjusted midway, the overall trend is still seen as a gradual decline after the top is built.
2. The upper pressure is 23800~24700, and the lower support is 22300~21500.
I hope that friends can ask questions and discuss together
BITSTAMP:BTCUSD

Bitcoin under pressure, waiting for the bears to enter
Bitcoin has reached the lower edge of the pressure area yesterday. If it is under pressure, there will be a wave of retracement in the later period. Today, it still maintains a high-altitude thinking. It is not ruled out that there will be high points in the short term, but it will remain high before the pressure area train of thought. Bitcoin operation recommends selling at 23900, risk control at 24500, target 22300~21500.
Bitcoin bearishness is based on the following:
1. Although Bitcoin has reversed and adjusted midway, the overall trend is still seen as a gradual decline after the top is built.
2. The upper pressure is 23900~24700, and the lower support is 22300~21500.
Friends are welcome to discuss together, I will give analysis every day for your reference
CME:BTC1!

Bitcoin Bullas wants to push it higher on Monthly Close!BTC/1H `at the bottom of rising broadening wedge Forming another pennant `
After Pumping into 23.9 yesterday btc gets rejected at a local support and starts to bleed and touches the bottom of the rising broadening wedge
The Rejection was heavier than the pump and price endedup consolidating near the bottom of the wedge indicating we might exit it again
Also today is **Monthly Close** if btc loses 23K and close below, depending on the momentum of the move we could consider it very bearish
Some liquidity Cluster to be taken at 24.6 which can cause bitcoin to legup again if it breaks above 24.7
Please Boost,Follow,Comment if you find it informative
Thanks for watching

Bitcoin pattern indicates a fall.Chart speaks for itself, should fall to the magenta line or below. This aligns with the backdrop of the FED attempting to suffocate the economy/free money flow with interest rates.

BTC/USD - BITCOIN - Great Buy OpportunityBitcoin hit strong resistance at $25,000 but with all the good news from Hong Kong, China it will break the resistance:
--> On June 1st, 2023, Hong Kong will officially make crypto purchase & sell, trading, fully legal for all of its citizens.
Entry: $24,650 - $24,700
Take Profit 1: $27,000
Take Profit 2: $29,000
Stop Loss: $23,000
Enjoy our Free Analysis and Setups.
Leave us a like and comment.
For more scripts & analysis, follow us.
Success trading!

yop it doesn't look good BTCAs for Weekly, I am not much Bullish for me, Retest 25k was such a fake and for a lot of people a loss of money.
So we will see what this summer will bring us. But I look forward to the end of this year and my birthday in March 2024.

DXY to the moon BTC downThis does not look good for BTC at all, I think people will lose a lot of money, it has been pumped up through fake volume for quite some time. Let's see, maybe I'm terribly wrong. Be careful and buy wisely, I will be buying BTC, AXS and more over the summer

Bitcoin Consolidating to go Lower AGAINBitcoin/1H Doing another Pennant
We are also in a down trend channel that I draw which everytime it reaches the end of the channel it makes a move.
Worth noticing when SPX was consolidating btc went to 25K now that spx started to move down btc coming down with it.
We could perform a fake pump and grab some liquidity before further downside.bearish momentun is just starting and we yet have to see bigger red candles ~13%
Please Follow,Comment,Boost if you find it informative.
Thanks for watching

BTC QM SetupHello Traders. Hope you are having a great weekend. As you can see BTC has formed a QM pattern on an important resistance which is 25K. A correction is
expected for BTC at least to 22-23K. The pattern gets invalidated if 2H candle closes above the last high about 25.3K.
What is your idea?
Comment down Pls.

BEAR TRAP 24,400 - 25,200We see how the market is divided and many traders don’t know what to do now and how to manage their finances. We want to join the traders community and share our thoughts about the market in several short sentences.
1. We don't think the market has broken and a bullish cycle has begun. The current growth, which started back in December, is a consequence of one big sideways cycle, which started in June, after half a year of falling. We just reached the ATH of the current range
2. The final bull capitulation of the current 3-month growth has not yet taken place and it’s too early to bury all bullish vibes. A very ambiguous March is ahead, which can determine the market for the next six months to a year.
3. The market is heavily pumped with Asian liquidity, but most of the bought and hyped Chinese tokens are from projects that have no background or from long abandoned projects from 2017-2018. This fall is temporary and we think it’ll be until the first piece in the whole chain of dominoes falls.
4. Locally, the bulls and bears now have a 50/50 chance
5. BTC's past drop to 16.5K was based on the market's sensitivity to macro and the FTX drop that continued to “infect” the market. Now there is no thesis or narrative for the fall. US CEX was temporarily able to fend off the SEC, Genesis bankruptcy was quietly accepted by the market, macro data is totally ignored, Paxos and Binance “breakup” slowed down the market for 2-3 days
6. The main thesis of the majority of traders is to go short now in order to show the bulls that they are wrong. Of course there are preconditions for fall and these preconditions are quite rational, but the market is often able to be irrational longer than traders will be solvent
7. For those who are willing to go short: the safest option now is to go short without leverage, or with a small leverage to stay in the market. Just keep in mind that the situation is changing very quickly
8. The main price range for finding shorts is 29,900-30,200
9. The current volatility and activity in the market is ridiculous, most got into their long positions in mid to late January, and they want the music to keep playing
In the near future we’ll see how the situation will change and what will current long positions give us. Share your thoughts about the most controversial and debated topic right now in a crypto community and stay with us for further ideas. Thanks for reading and don’t forget to check the links below and visit our website!

BTC SHORT TERM FORECAST Outlook on BTC ( 23/2/2023 )
Backed with certain fundamentals on the dollar , i do believe that we may get a short squeeze to the downside really soon to gain more liquidity to head towards the upside.
I am personally looking at 2 DCA zones to add to my long term swings to 36k region as marked in my charts as TP3 before massive roll over.
Looking to add spot buys at 20000 and 21500 whereby i will be dollar cost averaging down the partials ive taken on BTC at 24500. Im seeing exhausting and some form of minor consolidation and i do believe we need more liquidity to head higher. In the event price breaks above 25k , we are in it for a treat regardless as we have our remaining 65% to hit our remaining targets.
Currently the market sentiment for crypto is bullish like all risk assets are. It is always easier for risk assets to be bullish than bearish as the markets is always fueled by greed and emotions. Many believe that the bear market isnt over and i stand by it as well but its not that easy. People will be betting on a short upon seeing a minor consolidation now which i think will be otherwise. We will probably dip down to my DCA zones and fuel fomo short positions into the markets which will eventually be wiped out when price makes another euphoric rally to the upside misleading everyone that the bear market is over again. Thats when the mother of all wipe outs will come in.

Bitcoin Wants To Dump Further After a RetracementBTC/1H after breaking the downwards parallel channel , we bounced back at ~23.7 (blue up trend line) and started to goin up for a liquidity grab ( might touch the white horizontal line or pink trendline)
After that it will continue back down to 21.7 or even ~20500.
Dont foget bitcoin pumped when NY stock market was consolidating so we have lots of fake pump to remove
detailed explanation on
Ive decided not to record videos due to low mic quality. new mic will arrive friday night.
Please Follow,Comment,Boost if you find this video informative.

BTCUSDSELLPeace be upon you, how are you, traders? Bitcoin is in a negative state. With breaking the 24000 area, which is a strong support. And break the flag. There is a high probability of seeing 23,000 levels in the first stage. In the second phase, 22,500 can be seen.
