Bearish on Bitcoin (BTC) – Target Price: ~$70,000Technical Analysis:
The provided chart illustrates Bitcoin's (BTC/USD) current position within a descending channel, marked by red resistance and green support lines. The series of lower highs, indicated by the red arrows, reinforces the prevailing bearish momentum. A potential breakdown from the current trading level of approximately $85,079 could lead to a decline toward the green support line, aligning with a target price around $70,000.
Fundamental Analysis:
Recent developments provide additional context to this bearish outlook:
Market Sentiment: Betting markets suggest that Bitcoin has likely peaked for the year, hovering just above its January high of $109,000.
Macroeconomic Factors: Concerns over President Trump's tariff policies and broader economic conditions have contributed to Bitcoin's recent decline. Analysts warn of further downside risks due to ongoing uncertainties in global trade and inflation.
Trading Strategy:
Entry Point: Consider initiating a short position on BTC at the current price of approximately $85,079.
Target Price: Set a price target of $70,000.
Stop-Loss: Implement a stop-loss order at $88,000 to manage potential upside risk.
Btctrend

Buy@85500 - 86500Presently, Bitcoin is firmly ensconced within a robust upward trajectory. Having transitioned from a sideways trading phase at 84000 last week, it has executed a remarkable rally, surging directly into the resistance corridor in the vicinity of 89000. With the current trading price hovering at 87000, the market exudes a palpable sense of bullishness.
Should BTC sustain a stable sideways oscillation between 87000 and 88000, the bulls stand to methodically amass upward momentum. Once primed, a breakthrough of the 89000 threshold by BTC appears all but inevitable.
From a technical vantage point, Bitcoin has convincingly breached the sideways trading range. Its moving averages exhibit a distinct bullish configuration, with the 85000 level solidifying as a crucial support.
On the fundamental front, a confluence of factors—including the prevailing global economic uncertainties, the buoyant market sentiment, and the relatively permissive regulatory environment—collectively conspire to propel the continued ascent of its price.
💎💎💎 BTCUSD 💎💎💎
🎁 Buy@85500 - 86000
🎁 TP 87000 88000 89000
The market has been extremely volatile lately. If you can't figure out the market's direction, you'll only be a cash dispenser for others. If you also want to succeed,Follow the link below to get my daily strategy updates

Is BTC Bitcoin Overextended? My Bias Is Bullish With Conditions!This 30-minute chart 🌟 shows Bitcoin consolidating within a descending channel after a recent bullish breakout 🚀, with a potential bullish structure forming. The price is currently testing the upper boundary of the channel near $87,500 🛡️. If the price breaks below the channel and retests the equilibrium support, it could present a strong buy opportunity 💰 . Considering the broader analysis 🌍, a break above $87,926 with strong volume 🔥 would confirm bullish momentum toward $90,000 🎯 . Not financial advice. ✨

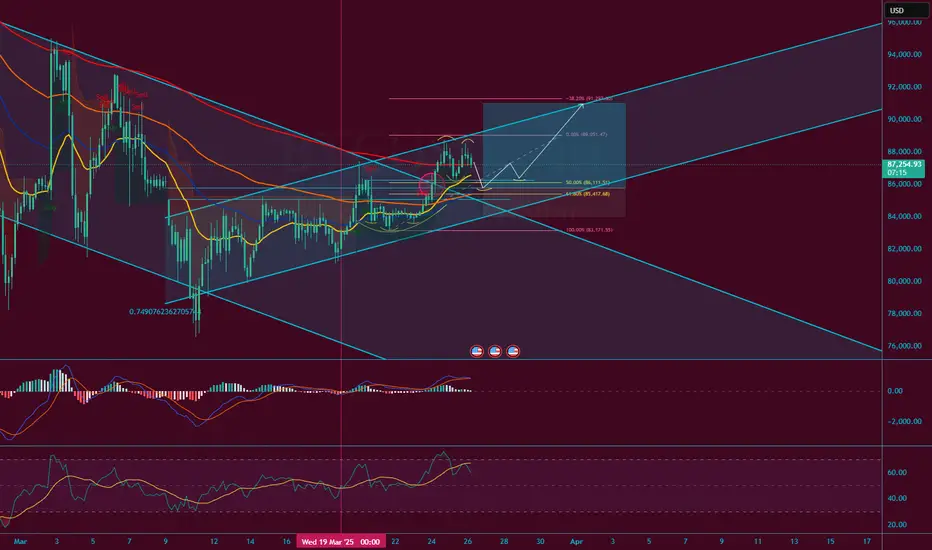
Bitcoin (BTC/USD) 4H Chart Analysis: Bullish Breakout Ahead?📈 Ascending Channel:
🔹 The price is moving upward within a parallel trend channel.
🔹 Blue arrows (🔵) indicate resistance points where the price struggled.
🔹 Red circles (🔴) highlight support areas where the price bounced.
🟦 Fair Value Gap (FVG) Zone:
🔸 The blue-shaded area (FVG zone) suggests a possible retracement before a bullish move.
🔸 If the price dips into this zone, it may find liquidity and bounce back up.
📊 Projected Price Movement:
⚡ Expected pullback → into FVG zone (🔽), then a bullish push (🚀) towards $90,686.72 🎯.
🟡 Yellow arrow shows the anticipated price path.
📉 Support & Resistance Levels:
✅ Support: Around $86,000 - $86,500 (FVG zone).
🚀 Target: $90,686.72 (next major resistance).
📌 Exponential Moving Average (DEMA - 9):
🔹 The blue line (DEMA 9) at $87,414.57 is acting as dynamic resistance.
🔹 A break above this could confirm further upside movement.
💡 Conclusion:
🔸 Bullish bias remains strong 📈.
🔸 Watch for a dip into the FVG zone before a potential rally 🚀.
🔸 If Bitcoin holds support, it may reach $90K+ soon 🎯🔥.

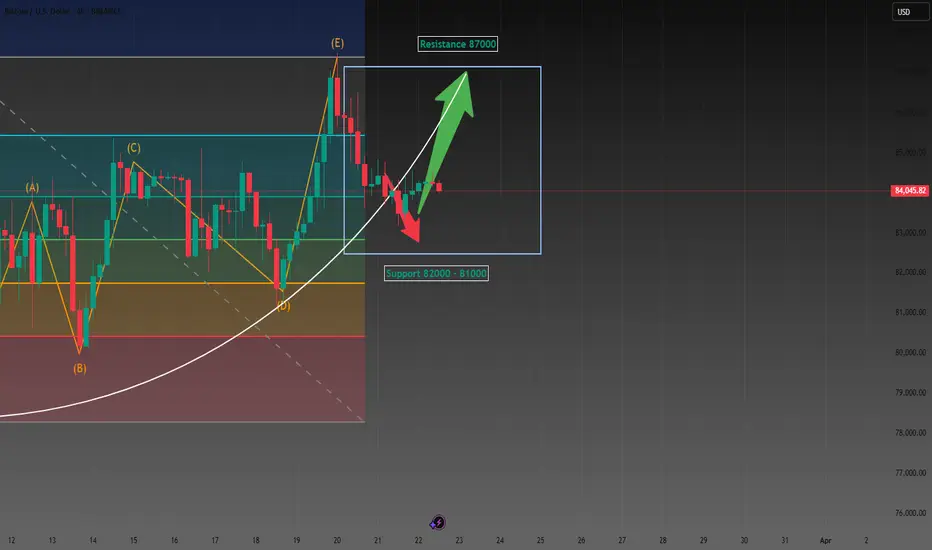
My BTC long idea 26/03/2025This is linked to my NAS idea where the market is slowly shifting to a Risk-on environment. I see a nice potential for a bullish BTC price action shift. We may have found the bottom for the new bull run.
Technical observation:
1. We recently formed a cup and handle.
2. A visible head and shoulder on the cup and handle.
3. Exit on the bearish trend channel with the formation of a new bullish trend channel.
4. 50% fib level looks promising.
BTC:BTC is expected to continue to rise to 95000BTC has built a perfect upward structure in an oscillating upward manner, and has continuously strengthened the bottom support during the oscillation process. BTC is expected to continue to rise. However, BTC is facing the 88500-89500 resistance area, so BTC needs to accumulate energy to break through this resistance area, so we should focus on the 86500-85500 area support below. Once BTC touches this area and stops falling and rebounds, BTC is bound to break through the 88500-89500 resistance area and is expected to continue to 95000.
So in terms of short-term trading, if gold pulls back to the 86500-85500 area, we can go long on BTC.I will make more detailed trading plans and trading signals every day according to the real-time market situation, which is also the testimony of every successful transaction and profit of mine; the article has a certain lag, if you want to copy the trading signals to make a profit, or master independent trading skills and thinking, you can choose to join the channel at the bottom of the article

Position Open in BTC! Ready for TakeoffHi Traders ! Bitcoin has reached a key support zone, where it has historically shown bullish reactions. Additionally, the RSI at oversold levels (21.66) reinforces the possibility of an imminent rebound.
🔥 I have already entered long, expecting a bullish move toward the $85,500 - $86,000 zone, with a possible extension to $89,000 - $90,000 if it breaks the descending resistance.
📈 Key Factors to Watch:
✅ Confirmation of the bounce at support.
✅ Increase in buying volume.
✅ Break above the 20-period EMA.
Let’s see how this plays out! What are your thoughts? 🔥
⚠️ Disclaimer: This is not financial advice. I am simply sharing my analysis and personal trade. Always do your own research before trading!

BTCHello friends
You can see that after the price fell in the specified support area, the price was supported by buyers and caused the resistance to break, and now, when the price returns to the specified ranges, you can buy in steps and move with it to the specified targets, of course, with capital and risk management...
*Trade safely with us*

Bitcoin Price Analysis – Bullish Setup with Caution AheadThe short-term trend is bullish, as we observe:
- Price movement is above the short- and medium-term moving averages.
- The price is forming higher highs and higher lows.
- Support levels are steadily rising along the moving averages.
However, there is a noticeable loss of momentum in recent hours, which could signal a potential short-term correction or profit-taking phase.
Bullish Indicators
Moving Averages:
- The 10 EMA, 20 EMA, and 30 EMA are all indicating a Buy signal.
- The 200 EMA also reflects a Buy signal.
- This indicates that the price is trading above key averages, supporting the continuation of the bullish trend.
ADX = 29.49 (Buy): The strength of the current trend is still significant (above 25), which reinforces the continuation of the bullish movement.
MACD (Buy): The MACD has shown a positive crossover, which supports the bullish signal and continued upward momentum.
Bearish Indicators
Momentum = Sell (Value: 4,249.13): There is a noticeable slowdown in momentum, which may indicate the early stages of a correction or temporary weakness.
Some Long-Term Averages = Sell: The 50, 100, and 200 Simple Moving Averages are showing sell signals, suggesting the longer-term trend has not yet fully transitioned into a bullish phase. These may also act as resistance if the price continues to rise.
Stochastic RSI Fast = 90.56 (Overbought): This indicator is in the overbought zone, pointing to a potential near-term pullback.
RSI = 53.34 (Neutral to Overbought): Not yet in the overbought territory, but gradually approaching it, which should be watched closely.
2025 Performance Lagging: The latest chart shows that 2025 performance is currently at -6.46%, compared to a strong +111% in 2024. This discrepancy suggests a phase of ongoing profit-taking or broader consolidation.
Outlook
Short-Term (Hours to Days): There is a potential for further upside with key resistance levels at 88,500, 89,000, and 90,000.
The nearest support levels are at 87,500 and 86,800.
However, caution is advised due to signs of short-term exhaustion in indicators like Stochastic RSI and Momentum.
Medium-Term (Weeks): As long as the price holds above the 86,000–86,500 range, the uptrend is likely to continue. A breakout above 90,000 would be a strong bullish signal that could drive the market to new highs.
Recommendation
- For Short-Term Traders: Take advantage of the current move but remain cautious of sudden corrections.
Watch for potential buy zones near 87,000 and 86,500. Use a tight stop-loss strategy if these support levels are broken.
- For Medium/Long-Term Investors: Indicators show that the uptrend is starting to stabilize.
Consider partial entry now while closely monitoring the 90,000 level.
Avoid going all-in at current levels and keep capital aside to buy dips if the market corrects.

BTC Today's analysisDuring the recent continuous and close tracking of the cryptocurrency market dynamics, I have always maintained an optimistic view on the price trend of BTC.
As it turns out, this prediction has been strongly validated by the market. Since the last market analysis, the price of BTC has shown a strong upward momentum, steadily climbing from an initial price of around 84,000 to the current remarkable 85,200.
💎💎💎 BTC 💎💎💎
🎁 Buy@83500 - 84000
🎁 TP 86000 - 87000
The market has been extremely volatile lately. If you can't figure out the market's direction, you'll only be a cash dispenser for others. If you also want to succeed,Follow the link below to get my daily strategy updates

Bitcoin at a Critical Juncture – Breakout or Breakdown? 📉 BTC is at a key decision point! After pulling back from recent highs, it's now consolidating within a range, sitting right in the middle of the previous price swing. I'm keeping a close eye on this zone—if price breaks out, a high-probability trade opportunity could emerge.
🎯 In this video, we dive deep into price action and market structure, breaking down a potential trade setup—if the market aligns with our strategy.
🚨 Trade smart, manage risk—this isn’t financial advice! 🚀🔥

BITCOIN HAS TO BREAK LONG TERM TREND by DEC - SQUEEZE APEX DECI have posted this before and I post it again now, just months away from a CRUCIAL point for Bitcoin PA
As with any time scale trading chart, An Apex is a point of reaction. PA usualy reacts BEFORE the Apex is met.
This Giant Apex is in DEC 2025
Every single ATH in the life span of Bitcoin has been rejected by the Arc of Resistance that is overhead.
We can also see how from the ATH in 2011, a trend line was formed that has acted as Support ever since 2012. PA has never dropped below this line.
So, as you can see, PA has been in a diminishing "Sandwich" and Now, we are coming to the Crunch
We can see how the ATH's have been a reducing % Rise ever since this point also.
And you will notice how this number on the chart reduces each time, even though the real value is increasing.
Low to ATH A ( ATH 2011) - 3,465,178%
Low to ATH B ( ATH 2013) - 49,670 %
Low to ATH C ( ATH 2017) - 9,865 %
Low to ATH D ( ATH 2021) - 2,148 %
E is not over yet but coing on current ATH we have
Low to ATH E ( ATH 2025) - 575 %
So, you see the reduction of % rise, held back all along by the ARC Of RESISTANCE
What is interesting, is that since PA has been in the chanel formed in 2011, when comapred to each other, we have been seeing a rise of 20% of the previous rise ( on average )
This closer chart shows you this in more detail
I will ignoew the A - B as thia is out of channel
C-B = 19.6 %
D-C = 21.77 %
Currently E-D = 26.7 %
As you can see, we are currently OVER that average % Rise.
And we are also heading into a tight APEX in Dec.
The expected 200K ATH this cycle will take us out of the pattern, out of the Apex and out of the 20 % average rise of previousl
This really is CRUNCH TIME for Bitcoin
The REALLY interesting thing is, What would be Next ?
This would break the Cycle routine.
We may already have broken that as described in previous charts of mine from years ago
But what IS Certain is that something HAS to happen.
This Cycle ATH will reveal a HUGE amount but we have yto Wait and see what will happen

BTCUSDT RISING WEDGE PATTERN IN 2-H AT Hello Guys Here Is Chart Of BTCUSDT in 2-H AT
Entry Level: SELL Around 86500
Resistance: The upper trendline of the wedge 87300
Target Will Be : 83100
Would you like me to check potential invalidation levels where the pattern might fail?

Let's always put our trust in BTC, mate.Bitcoin Market Analysis
BTC price hovers around 84,000 in consolidation. Bulls and bears battle at this price.
Support Level
Support is in 81,000 - 82,000. Strong buying emerges there. It stopped drops in past corrections. Dense holdings mean many cost - bases are in this range, propping up support.
Resistance Level
Resistance at 87,000. K - lines show heavy selling near it. Past break - throughs failed. Trapped or profit - taking positions sell as price nears, creating resistance.
Bullish Outlook
I'm bullish. Global recovery raises risk appetite for BTC. More institutions hold BTC, boosting price. Positive sentiment on long - term prospects, due to blockchain growth, helps. Upward - diverging moving averages show uptrend. Lower volume in consolidation, but activity stays. New positives may push price to resistance.
💎💎💎 BTC 💎💎💎
🎁 Buy@83500 - 84000
🎁 TP 86000 - 87000
The market has been extremely volatile lately. If you can't figure out the market's direction, you'll only be a cash dispenser for others. If you also want to succeed,Follow the link below to get my daily strategy updates
BTC: Accumulate energy for the rise and soar into the sky!📍BTC's volatility has narrowed, with selling pressure showing signs of weakening. Throughout the choppy price action, the 84000-83500 zone has established itself as a critical support area in the short-term structure. This level now serves as a key defensive line.
📍Following this consolidation phase, BTC may stage a rebound from this support region. If the price manages to break through the resistance around 84800 with strength, further upside momentum could drive it towards the 90000 level.
🔎Trade Idea:
BTCUSD:Buy at 83500-83000
TP:84500-85000
SL:Adjust according to risk tolerance.
📩Trading means that everything has results and everything has feedback. I have been committed to market trading and trading strategy sharing, striving to improve the winning rate of trading and maximize profits. If you want to copy trading signals to make a profit, or master independent trading skills and thinking, you can follow the channel at the bottom of the article to copy trading strategies and signals

BTC Breaks Structure - Key Levels to Watch PLUS Trade Idea!Bitcoin has broken structure to the upside on the daily timeframe, confirming a bullish trend 📈. I’m considering a buy opportunity, but only if the key conditions discussed in the video align.
Right now, BTC is in a strong uptrend, with a well-defined higher highs and higher lows structure on the 4-hour timeframe 🔍. In this video, we break down the trend, price action, market structure, and other essential aspects of technical analysis to navigate this setup effectively.
⚠️ Not financial advice.

Bitcoin Index-3 Strength index. Tells us what ? Bull Or Bear ?This post will include the same chart as a Month, Weekly, Daily and 4 hour
The 3 indicators are
RSI - RSI, or Relative Strength Index, is a momentum oscillator used in technical analysis to identify overbought or oversold conditions in the price
TSI - The True Strength Index indicator is a momentum oscillator designed to detect, confirm or visualize the strength of a trend. - the True Strength Index (TSI) does show trend direction.
ADX - the Average Directional Index (ADX) shows the strength of a market trend, NOT its direction. The base line is 25 - Above is strong trned, below is weaker trend
ADX is Yellow - DI + is orange ( positive price index) - DI - is Red ( Negative price index
MONTHLY
The main chart is the monthly chart - the vertical lines Mark Years
Note how ATH's are all Above the Rising upper trend line.
From the Left,
2013 ATH - Note how RSI and TSI both peaked BEFORE ATH, as did the DI+ on the ADX indicator. The ADX itself turned down Later
2017 ATH saw a similar pattern
2021 was slightly different. RSI and TSI peaked on the March ATH but the true cycle ATH was in Q4 ( Nov) , as are most BTC Cycle ATH - Note the sudden drops in both ( probably due to deleveraged)
The DI+ on the ADX did the same but note how the ADX itself peaked in NOV - The ADX seemingly being more accurate on showing us Cycle Top by Trend.
Currently,
The RSI has not entered Fully OVERBOUGHT as in previous cycles. Has Fallen below Overbought entry line in recent weeks. Maybe leveling out
TSI ( orange) is falling since Jan, showing a bearish trend - Falling towards its own average.. PA has been falling in this time.
ADX has also slowed and flatten out, showing a weakening of trend. NOTE - ADX does not show us Trend direction...So, in recent months, we have seen a DROP in PA.
Weakening of this trend could be pointing towards a reversal ?
Also look at the orange DI+ line in ADX....It is getting Lower on each ATH, harder to move higher as Price increase makes BTC harder to move
THE WEEKLY begins to show us more info
This starts to get interesting here
Note that in 2021, It was as we saw in the monthly Except the ADX fell after the March ATH and did not rise again untill half way through 2021 when the Bear Kicked in Fully. The ADX here is showing the strength of that Bear Market as Luna, FTX and 3 arrows collapsed.
The RSI and TSI remained flat Till Jan 2023, when we saw PA beginning to recover. Notice I said RECOVER. I said it at the time and I say it again..Jan 2023 till September was recovery from avery deep Bear market. This is backed up by the fact that the ADX remained Flat untill Late August 2023. Showed No TREND
Then we saw ADX rise, TSI rise off Neutral and RSI begin to head towards Overbought.
All 3 then Dipped in Mid 2024, Rose again to End of 2024 and since then, we have seen the RSI and TSI drop below their averages, head to Neutral
ADX continied to rise as DI+ Dropped, showing us this was a Bearish Trend after all.
However, since beginning of March, the ADX has been showing a weakening of this trend. Still Bearish as the rise in DI - shows, but it is getting weaker.
DAILY begins to show us what could be heading for a new trend, maybe
BTC PA dropped since Feb as did the RSI and TSI, though they have recently stopped doing that and have tried to bounce but still remain below Neutral.
The reason for this is shown in the ADX that has continued to rise untill March, Keeping that Bearish trend Active and strong. This is confirmed by the DI - ( red ) being above the DI +
Even though this trend has weakened, DI + remains flat showing that a change in trend does not appear to be happening to quickly.
Note how the ADX has turned and is beginning to rise higher as the TSI and RSI flatten out
Hpwever. DI - also remain flat.
Change could be near. It is not happening yet but......
The 4 hour chart is full of Noise but given whet we just seen, it may be relevant to see it
It is Volatile but we can see on BTC PA how PA slowed its drop from March and has ranged with a reducing high Low.
We can see how the RSI and TSI rose, dipped and Rose to their current positions near Neutral.
We can see on the ADX, in the centre , was the Last Bearish push, BTC PA Dropped sharply but the trend weakened quickly. the Bears are getting tired.
We see the attempt by the BULLS around the 11 march to push PA higher.
This failed..but showed us the bulls are still here.
The Fact that the ADX is below the DI lines is a sign that a Trend no longer exists or is very weak
The previous Bearish Trend is possibly exhausted.
We have signs that Price recovery is possible from here though I think we will wait a bit longer before we see it.
My conclusion is that we maybe seeing the beginning of a change , a reversal, but it may take a little while before we see the Fruits fully. Possibly up to 5 - 6 weeks or more.
The shorter term data shows we could make a push to top of range ( or near) but that could get rejected.. We need more strength for the long term
But I suggest you read this, look at these charts and make up your own mind.
Because they are hard to read in many ways, Trends can spring up any time, in any direction.
We can only look at them and think..
I wish you well

BTCUSD Analysis StrategyToday's Bitcoin market shows the dual characteristics of technical correction and cautious market sentiment. The short - term risk is inclined to the downside, but there is still rebound potential in the medium - and long - term.
The fact that the price of Bitcoin has fallen below $84,000 does not mean the end of Bitcoin. Instead, it is just a part of the market operation. For investors, the key to success lies in understanding the underlying factors of the market and correctly assessing the risks and opportunities. In a market full of uncertainties, only by staying calm and conducting rational analysis can one seize the future opportunities.
Bitcoin Trading Strategy
sell @ 90000
buy @ 78000
Finally, I'd like to remind every investor that the cryptocurrency market is inherently highly volatile, and every decision you make may have an impact on your investment returns. In this rapidly changing market, what we need is not just luck, but also a keen mind. You are all welcome to follow me. Let's discuss the future of Bitcoin together. Perhaps it is through the collision of ideas between you and me that we can gain a clearer understanding of this market.

Bitcoin Reversal or Dead Cat Bounce? Here's My Trading Plan! Analyzing BTC on the higher timeframe, we observe a clear structural shift in the prevailing trend 📊. Dropping down to the 4-hour chart, there is a decisive bullish break 📈, leaving behind an imbalance following the initial move—an area that could serve as a retracement target 🎯. Notably, this imbalance aligns with a Fibonacci retracement into equilibrium 📐, adding confluence to the setup.
I am considering a long position 💰, but only if the key conditions outlined in the video materialize ✅. If those conditions fail to align, I will discard this trade idea ❌.
⚠️ Not financial advice.

Bitcoin's market share rises despite decline in active usersThe data shows that Bitcoin's dominance has been rising steadily since 2022. It also highlights that Bitcoin's market share of active users has fallen over time. The data shows that on-chain activity in Ethereum and other layer 1 (L1) networks has increased.
OnChain data shows that Bitcoin's dominance has increased since 2022, and the upward trend is the longest in history. The data also shows that Bitcoin's active user market share has fallen as on-chain activity on the Ethereum network has increased.
Amid declining users, Bitcoin dominance has increased;
Matrixport shows that Bitcoin dominance has increased to a new high of over 61%. The analytics platform put the dominance higher, which was stronger than expected in the US jobs report. It said that the increased job rate indicates that the economy is recovering. COINBASE:BTCUSD BITSTAMP:BTCUSD BYBIT:BTCUSDT.P BINANCE:BTCUSDT

Heiken Ashi Bitcoin chart shows us near Bottom of Range I have posted this chart before so this is an UPDATE
As we can see, PA has come down and now bumped into the rising line of long term support and at the expected % of drop ( -24 )
Does this mean that PA will bounce ?
NO but it does have a higher chance of doing so as the lower Timef rames are now oversold.
The weekly MACD is still falling Bearish and has a few more weeks to go before reaching Neutral.
The Lower Oversold time frames should give PA the energy to rise off this trend line and aim towards Range high
However, as we saw in 2023, PA can drop below and so we need to remain cautious and watch PA closely.
Tomorrow , March 12, we have the USA inflation data being released and this will most likely act as a catalyst to a move in either direction, depending on the data
So, Hang on , Be optimistic while being cautious.. Bitcoin is at a turning point....We are just notto sure in which direction.

BTC LOWBTC New Low month of March & April, new low is 68000 $ if its hold then going more down side .

Cold thinking on Bitcoin's "pullback moment"This morning, Bitcoin prices fluctuated again, falling below the $77,000 mark and currently fluctuating around $80,000. The market seems to have entered the "pullback moment" again. Faced with price fluctuations, I believe many friends are thinking about the same question:
Is it "getting off the train to avoid risks" or "entering the market at a low point" now?
This question seems simple, but it is actually complicated. Especially in the cryptocurrency market, short-term fluctuations are drastic, and various information noises are intertwined, which can easily make people lose their way. When we are in the "pullback moment", we need a calm thinking, and we should take our eyes off the price fluctuations in front of us and put them into the larger "trend" and "cycle" framework to examine.
Let's take a closer look at what a trend is and what a cycle is.
1. What are trends and cycles?
To understand any market, we should first distinguish between the two key concepts of "trend" and "cycle", and the crypto market is no exception.
Trend: Trend is the long-term direction of the development of things and a grand and lasting force. It represents the most essential and core trend of things, just like a surging river, once formed, it is difficult to reverse.
Cycle: The cycle is the short-term fluctuation in the development of things, and it is the rhythmic change of swinging around the trend line.
Simply put, the cycle is in the trend. However, simple inclusion is not enough to express the complex relationship between them. If the "trend" is compared to the trunk of a tree, the "cycle" is like the rings on the trunk.
When 96% of the world's population does not yet hold Bitcoin, when sovereign funds begin to include crypto assets in their balance sheets, and when blockchain technology becomes a new battlefield for the game between major powers - this galloping "digital ark" has just sailed out of the dock where it was built. COINBASE:BTCUSD BITSTAMP:BTCUSD BYBIT:BTCUSDT.P PEPPERSTONE:XAUUSD BINANCE:BTCUSDT
