BTC/USD H1 Technical key points📈 Buying zone 📈
* buy: 98250 - 99120
* buy: 96480 - 97130
📉 Selling zone 📉
* sell: 104140-104550
* sell: 106145-107144
* Time frame H1,M15⏰
➡ Mark these levels and follow these key points 🤝✅
Btctrend

#BTC/USDT Ready to launch upwards#BTC
The price is moving in a descending channel on the 1-hour frame and is adhering to it well and is heading to break it strongly upwards
We have a bounce from the lower limit of the descending channel, this support is at a price of 98500
We have a downtrend on the RSI indicator that is about to be broken, which supports the rise
We have a trend to stabilize above the moving average 100
Entry price 102500
First target 104300
Second targe 107500
Third target 110080

BULISH BTCUSDT (THE CURVE LINES SPEAKING!)As in my previous analyses, I utilized curve lines; however, this time I am uncertain about the upper targets. This represents merely another perspective, and I will continue to monitor the market closely. I will update this analysis as necessary.
Here are the links to my other ideas:

BTC Price projectionBTC head and shoulder is still intact, it has been negated yet. It has from what is known as complex head and shoulders top.
If this pattern hold it might send BTC to 75k-80k region but if it failed we might see BTC around 124k-125k region.

Trading BTC with a Solid Plan Is Crucial for Success—Here’s Mine🌟 In this video, I share a trade idea along with my detailed trading plan and we highlight why a well-structured strategy is 🔑 key to success. Discover how to trade BTC Bitcoin 🪙 using a trend continuation approach while leveraging TradingView's powerful tools and features to gain a real edge in the markets. 🖥️✨
Here’s what we’ll cover:
📊 Trend Analysis: A top-down review of market direction to identify opportunities.
📈 Market Structure & Price Action: Key insights into how price moves and behaves.
🎯 Trade Planning: Using higher timeframe support and resistance levels to set stop loss and target points.
🛠️ TradingView Features: Practical tools to refine your analysis and boost efficiency.
This video is an in-depth guide to trading effectively with a proven strategy, enhanced by TradingView's unique capabilities. 🚀 Please remember, this is not financial advice. 📜

How Bitcoin’s Recent Golden Cross Could Impact Your Crypto Bitcoin has been performing strongly on the charts since hitting a low of GETTEX:89K a week ago. The cryptocurrency’s value has risen to over $105,000 at the time of writing, marking an increase of over 11% in just a week. The recent gains have sparked optimism within the crypto community, with some speculating about a potential short-term rally.
According to Burak Kesmeci from CryptoQuant, Bitcoin’s 1-7 day UTXO average has crossed above the 7-30 day UTXO average. This crossover signifies that the average cost basis for Bitcoin acquired over the past week is rising, despite recent price hikes. This positive signal indicates that the ongoing price upswing is backed by fresh capital inflows.

What comes up must go down!
Looking at the bigger timeframes (4H) btc has been rejected on a major resistance level. This could potentially bring us back down ton the green support zone. But I am safing it and taking profits at the yellow downwardsloping line.
Looking at the 15min it looks like we are making lower highs and soon to be lower lows.
Looking at the 5min we get reminded of that we could still back test the resistance zone but we are currently most likely to break down since we are in a steep downtrend.
Looking at the 1min timeframe I can see the higher lows at the micro trend but keep in mind that we are on the beginning of a downtrend on the bigger picture. I think the stop loss is perfectly executed above the previous lower high and I will now look forward to make the trade risk free! I think that btc easily could go down 4% based on price action.

BTC Bitcoin HTF Bullish Structure & Potential Trade Setup👀 👉 A detailed analysis of Bitcoin (BTC) on the weekly and daily charts highlights a bullish market structure. Further upside potential is anticipated, provided a retracement occurs as outlined in the video. In this session, we examine the trend, price action, market structure, and a possible trade opportunity. ⚠️ This video is for educational purposes only and is not intended as financial advice.

Bitcoin Updatebtc has formed:
- ascending channel in blue and broke it
- while retesting the channel btc also formed a head and shoulders setup
- descending trendline in red
we're waiting for a candle to close below the neckline an retesting it so we enter a short (sell) trade
Follow us or more ideas an updates

BTC Breaks Highs: Bullish Trend Shift Possible ContinuationBTC has broken the previous high, signaling a shift in the trend. This marks a bullish change of character, and I'm watching for a retrace on the lower timeframe with a potential continuation to the upside. Keep an eye on a Fibonacci pullback to the 50-61.8% level on the previous four-hour swing for a possible bullish entry. This is not financial advice.

What to Expect from Bitcoin in 2025? BEARISH TREND #BTC 13-01-25Bitcoin already started BEARISH TREND, so far #BTC gave us bearish reversal signal, at the same time it is forming Bearish Trend for 2025.
Thank you and Good Luck to all traders of #BTC and crypto!

BTCUSDT Analysis: Preparing for a Critical Zone TestThe 4-hour chart of BTCUSDT reveals a textbook retest of key levels following a sharp breakdown from the resistance near $105,268 . This move is consistent with a broader bearish structure that began forming after rejection at $108,366 . The current trajectory suggests Bitcoin may continue its downward momentum toward a high-probability liquidity zone between $85,883 and $89,510 . Here's why this area deserves close attention:
Technical Breakdown:
1. Descending Trendline Rejection:
The price recently respected the long-term yellow descending trendline, emphasizing the strength of sellers around $102,934.
2. Support Zones:
Immediate support at $96,920 has seen a weak bounce, increasing the likelihood of deeper retracements.
A stronger accumulation zone lies between $85,883 and $89,510 (highlighted in orange), which aligns with historical demand zones and Fibonacci retracement levels.
3. Bearish Momentum:
The rapid fall post-breakout indicates strong bearish momentum, confirmed by increasing sell volumes on key levels. Any short-term pullback toward $96,436 or $98,000 could serve as an opportunity to position for further declines.
4. Indicators and Risk Management:
Divergence signals suggest momentum exhaustion, and traders should anticipate potential short-term volatility. Use tight stop-loss placements and avoid overleveraging. For this setup, a stop-loss above $98,920 is recommended to limit risk.
Trade Plan:
Short Opportunity:
If BTC retraces to $96,436 or $98,000, consider entering short positions with targets in the $89,510–$85,883 range. Stay vigilant and be prepared to pivot based on price action near critical levels.
***
Final Note:
Remember, no strategy is foolproof. Always consider market risks, manage positions carefully, and align trades with your broader portfolio strategy. Let the price action guide your decisions.

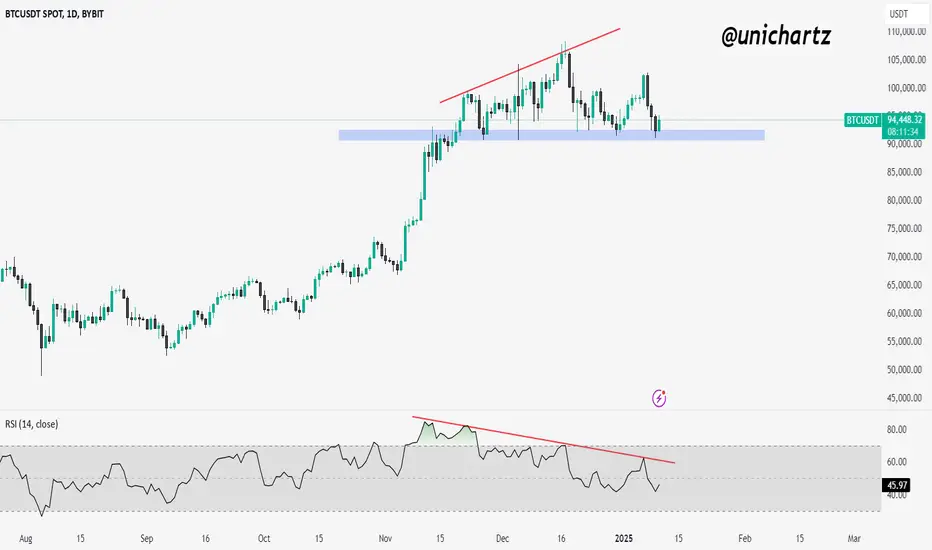
BTC Consolidates Near Support Amid Bearish SignalsBitcoin is currently trading near a crucial horizontal support zone, as marked on the chart. The price recently pulled back from its highs, forming a bearish divergence on the RSI, which suggests weakening momentum. However, the key support level around $90,700–$92,500 is holding firm for now, providing potential for a bounce.
If BTC manages to sustain above this support zone, we could see a recovery attempt. However, a breakdown below this critical level might trigger further downside, with the next possible target around $85,000. Traders should closely monitor the RSI and volume for confirmation of either a bounce or a break below the marked support.
Scalp in H1The price is fluctuating within the range of $91,000 to $108,000. A breakout above the $98,000 resistance could signal a buying opportunity. 📈
📈 Signal:
Entry: $100,516
Target: $108,130
Stop Loss: $98,526
Control Risk management⚠️

BITCOIN LONG TRADE SETUPA clear long trade entry was identified at $98,089 using the Risological Swing Trading Indicator .
The setup is already progressing positively, targeting levels:
TP1: $102,183.9
TP2: $108,809.5
TP3: $115,435.1
TP4: $119,529.7
Key Stats:
Current volume: 16.01K
30-day average volume: 96.64K
The trade setup aligns with a strong upward trend, providing excellent potential for hitting all targets efficiently.


Happy New Year 2025 BTC Heading to 120K? We extend our warmest wishes for a prosperous and successful New Year 2025. May this year bring you abundant happiness and trading achievements.
Regarding Bitcoin (BTC), the price has consistently respected the $94,000 level, repeatedly reversing from this area, indicating strong bullish market sentiment. We anticipate bullish momentum propelling the price to a new all-time high in the coming weeks.
Our initial price target is $110,000, with a subsequent target of $120,000. We wish you the best of luck.

$BTC in 2025!CRYPTOCAP:BTC #BTC Modest entry to the new year 2025! $95,878 resistance testing as I write this post, Previous 4H close with good follow thru on Bullish engulfing, Needs to regain support over $99,361-$100,334 resistance area to get back above $103,093. latest ATH at $108,388. $94,148 current support area, $91,357 key support area.

Should You Buy BTC Now? Let Price Action Be Your Guide!👀👉 In this video, we take a brief analysis of Bitcoin's current price action. On the 4-hour timeframe, we observe a break in structure, raising the question: Is this a potential buying opportunity? We then drill down to the lower timeframes to look for possible confirmations, following the scenarios discussed in the video. Please note, this is for informational purposes only and not financial advice. 📉✅

BTC Bitcoin: Bullish Breakout! What's the Next Move?🚀💡 Bitcoin's breakout is here! On the 4-hour chart, BTC has surged past its structure, just as we discussed in yesterday's update. Now, all eyes are on a potential retracement into the 50-61.8% Fibonacci zone, setting the stage for a possible buying opportunity. As always, confirmation through price action is key before making any moves. Remember, this is for educational purposes only and not financial advice. 📊🔥

Bitcoin (BTC): Is $83K Just the Start of a Bigger Drop?Bitcoin is showing signs of heading lower, and the next few levels could be make-or-break. Let’s break it down simply so you know what to watch.
What’s Happening Right Now?
The market’s pointing downward, and we’re eyeing FWB:83K –$85K as the first target. If BTC doesn’t hold there, things could get rough.
Where BTC Could Go Next
- FWB:83K –$85K: This is the next stop. If Bitcoin can’t bounce here, the selling could pick up.
-$70K: A deeper drop, and a key support level where buyers might step in.
-$55K: The worst-case scenario for now, but also a spot where we could see some recovery.
The Big Picture
We’re also seeing a head and shoulders pattern, which is a strong clue that prices might keep dropping. Let’s wait and see how the market reacts as we approach FWB:83K –$85K.
What’s the Plan?
-Watch FWB:83K –$85K carefully—it’s the first key level.
-If BTC doesn’t hold, prepare for $70K or even $55K.
-Be patient and trade what you see, not what you hope.
If you liked this breakdown, hit like or follow. Got questions about Bitcoin or another chart? DM me—I’d love to help.
Feeling stressed about trading or struggling with burnout? Let’s chat. I’m here to help you stay focused and balanced so you can trade with confidence. Let’s tackle this together!
Kris/ Mindbloome Exchange
Trade What You See

Expired BTC.USD Weekly outlook. 1st WK JAN 2024Expired BTC.USD Weekly outlook. 1st WK JAN 2024
> BEARISH 📉 HIT
Prior Week Closed Price: 96,904
This Week Target Price: 92,883
Strike Price: 92,501 on DEC 30, 2024
Upper Range: 102,843
Lower Range: 82,922

BitcoinBTCUSD ( Bitcoin / U.S Dollar )
Order Block
Bullish Channel as an corrective pattern in Long Time Frame
Completed " 12345 " Impulsive Waves
Break of Structure
Change of Characteristics
