Important news and possible volatility of BitcoinConsidering that Bitcoin is in a neutral trend in hourly time, the possibility of further growth is still possible, although this growth may take place after a correction.
Btcudst

And still falling until the newsIn the daily analysis of Bitcoin, we have a look at today's important news that has the possibility of extreme fluctuations in the market.
This digital currency, due to the pumpy growth it showed in the last week, now has the possibility of correction.
Considering that we are in an important resistance range, maybe if you are a risk taker, it is better to stay away from the market for a few days until the task of this resistance range for the leader of digital currencies is determined, because we have reached the weekly resistance and the possibility of the failure of the fake ascending channel in the weekly time It will not be far from the expectation.
Today, we have important news at 17:30 and 18:30, on the other hand, Bitcoin will reach an important support range, so we can hope for the growth of Bitcoin and enter with risk to a good reward as stated in this video.
But in the daily time, according to today's analysis, there is still a risk of falling

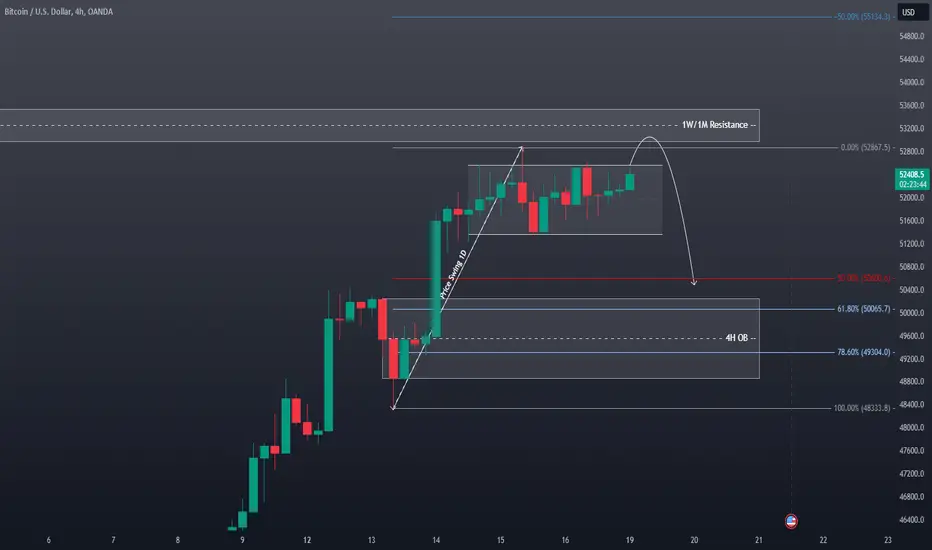
BTC BITCOIN Technical Analysis and Trade Idea (video)This is a full video explanation of my previous post. #BTC has encountered substantial resistance at both weekly and monthly (1W/1M) timeframes.
The 4-hour (4H) chart reveals sideways price action and a formation of a lower high, indicating potential bearish pressure. Expect a retracement targeting the 61.8% - 78.6% Fibonacci zone, derived from a significant daily swing low to swing high.
Trade Suggestion:
- Monitor for signs of a bearish shift in the trend on the lower time frame to confirm the retracement.
- Consider short positions upon breakdown from the current range, targeting the Fibonacci zone.
- Stop-Loss: Implement a carefully calculated stop-loss above the recent swing high to manage risk effectively.
Disclaimer:
This analysis is offered for educational purposes only and should not be interpreted as direct financial advice. Always conduct your own thorough research and implement sound risk management practices before initiating any trades.

BTC BITCOIN Technical Analysis and Trade Idea#BTC has encountered substantial resistance at both weekly and monthly (1W/1M) timeframes.
The 4-hour (4H) chart reveals sideways price action and a formation of a lower high, indicating potential bearish pressure. Expect a retracement targeting the 61.8% - 78.6% Fibonacci zone, derived from a significant daily swing low to swing high.
Trade Suggestion:
- Monitor for signs of a bearish shift in the trend on the lower time frame to confirm the retracement.
- Consider short positions upon breakdown from the current range, targeting the Fibonacci zone.
- Stop-Loss: Implement a carefully calculated stop-loss above the recent swing high to manage risk effectively.
Disclaimer:
This analysis is offered for educational purposes only and should not be interpreted as direct financial advice. Always conduct your own thorough research and implement sound risk management practices before initiating any trades.

BTC BITCOIN Technical Analysis and Trade IdeaMarket Observations: BTC/Bitcoin has experienced a remarkable bullish surge. However, the monthly timeframe indicates potential overextension. Moreover, recent price action pushing into previous highs on both the monthly and weekly charts suggests a possible retracement towards the 50-61.8% Fibonacci zone. This area typically attracts increased liquidity, potentially encouraging long positions from institutional investors.
Trading Considerations:
Counter-Trend Short: Explore a short entry near the current price level, strategically placing a stop-loss above the recent highs. Maintain a 1:1 risk-reward ratio for this trade.
Fibonacci Buy: Target a potential buy opportunity close to the 61.8% Fibonacci retracement level. This aligns with the possible accumulation of long positions by larger market players. Utilize a stop-loss below the recent swing low, and define target levels as shown on the screenshot.
Disclaimer: This analysis offers my personal market interpretation for educational purposes and should not be considered direct financial advice. Always prioritize your own independent research and thorough risk assessment before making any trading decisions.

Are you ready to Short Bitcoin Yet? {11/02/2024}Educational Analysis says BITCOIN BTCUSD may go short selling for some time according to my technical.
Broker - Bitstamp
This is not an entry signal. I have no concerns with your profit and loss from this analysis.
Because from past week bitcoin has just pumping up to collect Sell Stop hunt from retail traders.
I think it's high time for bitcoin to go short!.
Let's see what this pair brings to the table in the future for us.
Please check the Comment section on how it turned out for this trade.
I HAVE NO CONCERNS WITH YOUR PROFIT OR LOSS,
Happy Trading, Fx Dollars.

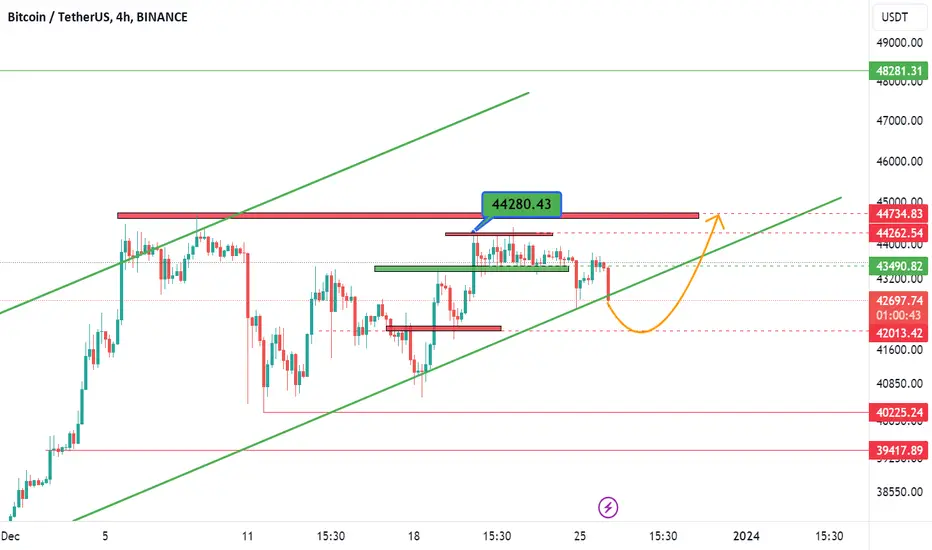
$BTC Daily UpdateCRYPTOCAP:BTC #BTC $44,860 resistance testing. Amazing break from $43,145 key resistance, RSI on 1D looking good, next resistance area to watch at $45,622-$45,876, $44,860 support crucial to hold as this will help reattempt at $47,232 key resistance. $44,174 current support yet to be tested

BTC BITCOIN Technical Analysis and Trade IdeaRecently, Bitcoin has experienced a period of consolidation within a specific price range, punctuated by occasional spikes that have targeted liquidity. In the video, we analyze the daily time frame to gain insight into the broader context. We examine the market's trend, structure, and price action, exploring a potential trade opportunity. It's important to note that the information provided is for educational purposes only and should not be interpreted as financial advice.

Is it flight time?Today we start the daily analysis of Bitcoin with patterns. This digital currency is facing the possibility of growth in the next 24 hours according to technical analysis.
On the other hand, due to the formation of the head and shoulder pattern in the hourly time and the corner pattern in the 4-hour time, there is a possibility of more growth for this digital currency. We examined the important support and resistance ranges in this analysis at different times

BTC Shorts Looking Good hereBTC Shorts Looking Good here. H4 breakdown on RSI and trendlines on Price Action. Please strong rejection! Beware of the retest might take longer to play out.

#Bitcoin update#Bitcoin update
Normally I would wait for the 4h fvg to take a short scalp position. But with the #FOMC meeting approaching in 6 hours (2pm ET), I'm wondering how quickly this will play out.
If the 4h fvg hits near the FOMC meeting, I won't trade, but trade the FOMC volatility.

BTC Bitcoin Trade IdeaBTC has traded into a key resistance level in a bearish trend on the 4H. I'm short on the fibo retrace. Not financial advise.


BTC Bitcoin Trade IdeaBitcoin (BTC) has experienced a recent period of sustained selling pressure, leading to a price decline that currently tests a key support level. Technical indicators suggest potentially overextended conditions, increasing the likelihood of a near-term retracement. Furthermore, potential strengthening of the US dollar could exacerbate downward pressure on BTC prices.

The possibility of growth after the news? Caution is necessaryIn the daily Bitcoin analysis, we said that today we have important news for Bitcoin, so be careful with your transactions at this hour.
According to the news, we determined the important support and resistance ranges and also reviewed the possible movement again in the daily time.
In 15 minutes, we have a look at the failure of Bitcoin's upward trend and the possible movement that is likely to happen in the coming hours.
Also, we determined the possible movement and support range for this digital currency in 4 hours

BTC - Broadening Wedge / Bull Pennant#BTC
One of the most deceptive patterns is the broadening wedge, which was an iteration of a bull pennant last time.
Will history rhyme again...?

A short position is ready at 53000.The following Bitcoin analysis is for informational purposes only and should not be considered as financial advice. Cryptocurrency markets are highly volatile, and past performance is not indicative of future results. Always conduct your research and consult with a financial advisor before making any investment decisions.

bitcoinIn today's discussion, we'll explore the potential movement of #bitcoin.
Our chart analysis reveals Bitcoin's upward progression in a series of five waves.
The projected next price for Bitcoin is $54,000.
As always, remember to apply your own market knowledge when making investment decisions.

BTCUSDT # 044 ( 2ND Bearish Phase is about to happen ! ) Hello dear traders.
Good days .
First cycle of the Gann square is finished .
2nd bearish cycle expect to hit price reversal Zone at reversal time zone in 0.618 Gann Box Bearish cycle .
Chart updated and route plotted with help of Gann Square and Gann Box.
Good luck and safe trades.
Thanks for your support and comments

BTC BUYHello, according to my analysis of Bitcoin, it appears to be in a very positive state, with the formation of an ascending channel. Which indicates buyers' control in the market. good luck for everbody

Probability of growth after a correctionIn this analysis, we had a look at the Bitcoin trend in 4 hours and analyzed the next move in this analysis.
Also, in the hourly time, we examined the important ranges of support and resistance and the possibility of safe movement and entry for this digital currency according to technical analysis.
Given that Bitcoin is at the bottom of its 4-hour ascending channel, we can consider the possibility of growth to be stronger.
On the other hand, due to the closeness of the important support ranges, we should consider two steps to enter, which we have provided full explanations in this video.
There is still more possibility of correctionBitcoin is still in an upward trend, but the possibility of a further correction to the bottom of the trend is not far off.
In this analysis, we identified two important support ranges and also provided a possible move for Bitcoin.
We identified a low-risk long position for risk-taking friends in this analysis and review according to technical analysis.
