After $105K Peak, Bitcoin May Revisit 0.382 FOB Level!CRYPTOCAP:BTC is pulling back after hitting a high of $105,800
If you look at the daily chart, we haven’t seen any healthy pullback, the price has gone straight up.
In my opinion, a retest of the 0.382 FOB level around $94K would be a healthy correction for Bitcoin. Based on the liquidation heatmap, we’re also seeing liquidity building up at lower levels.
This is one of the signs of a pullback, which is important for a sustainable and healthy market.
Stay tuned and follow for more updates!
Btcupdate

BTC Strength Alert: Key Levels, Fibonacci & VolatilityBitcoin (BTCUSD) Strength Alert: Key Levels, Fibonacci & Volatility Point to Entry Opportunities
Bitcoin (BTCUSD) Technical Analysis: Navigating Strength and Volatility
Bitcoin (BTCUSD) continues to capture the attention of the global financial markets, demonstrating notable resilience and underlying strength. The current market structure suggests a period where bulls are actively defending key price thresholds, creating a fascinating technical landscape. This analysis will provide an in-depth examination of BTCUSD, focusing on its price action relative to significant psychological levels, the supportive role of Fibonacci retracements, characteristic volatility patterns, and strategic entry considerations based on bullish candlestick formations.
1. Introduction to Bitcoin and the BTCUSD Pair
Bitcoin, introduced in 2009, stands as the progenitor of cryptocurrencies, operating on a decentralized peer-to-peer network secured by cryptographic principles and recorded on a public distributed ledger known as the blockchain. It was designed as a digital alternative to traditional fiat currencies, free from central bank control. The BTCUSD pair represents the exchange rate between Bitcoin and the United States Dollar, making it one of the most liquid and heavily traded instruments in the digital asset space. Its price movements are a barometer for the broader cryptocurrency market sentiment and are influenced by a myriad of factors including adoption trends, regulatory news, macroeconomic developments, and technological advancements within the Bitcoin network itself. Understanding the technical dynamics of BTCUSD is crucial for traders, investors, and market analysts seeking to navigate its often-turbulent price swings.
2. Current Market Sentiment and Price Action: Holding Above Key Psychological Levels
A significant observation in the current BTCUSD market is its ability to maintain its footing above a key psychological price level. Such levels, often round numbers (e.g., $50,000, $60,000, or in this context, a hypothetical significant level like $100,000 if we assume a major bull run has occurred), act as important mental benchmarks for market participants. When price successfully breaks above such a level and subsequently holds it as support, it can signal a powerful shift in market sentiment. This behavior suggests that buyers are willing to step in and defend this new valuation, absorbing selling pressure and preventing a swift retracement.
The act of holding above a major psychological level often has a self-fulfilling prophecy component. As traders and algorithms identify this level as critical, buy orders tend to cluster around it, reinforcing its strength as a support zone. Conversely, if the price were to decisively break below such a level after holding above it, it could trigger a cascade of stop-loss orders and a rapid decline, indicating that the previous bullish conviction has waned. The current strength shown by Bitcoin in maintaining its position above such a noted psychological threshold is therefore a bullish indicator, suggesting underlying demand and a positive short-to-medium-term outlook, provided this support continues to hold. This resilience can build confidence among market participants, potentially attracting further capital inflow.
3. Fibonacci Retracement Analysis: Identifying Strong Support
Fibonacci retracement levels are a cornerstone of technical analysis, employed to identify potential areas of support and resistance. Derived from the Fibonacci sequence – a series of numbers where each number is the sum of the two preceding ones (0, 1, 1, 2, 3, 5, 8, 13, etc.) – the key retracement levels are 23.6%, 38.2%, 50%, 61.8%, and 78.6%. These percentages are applied to a prior price swing (from a significant low to a significant high in an uptrend, or vice-versa in a downtrend) to project areas where the price might pull back before resuming the primary trend.
The observation that Fibonacci retracement levels suggest strong support at current BTCUSD levels is particularly pertinent. When the market is in an uptrend and experiences a corrective pullback, traders watch these Fibonacci levels closely. The 38.2%, 50%, and 61.8% levels are often considered the most significant. A retracement to, and subsequent bounce from, one of these levels indicates that the correction is likely a healthy pause within a larger bullish trend, rather than a reversal.
If BTCUSD is currently finding support near a critical Fibonacci level, it implies that the preceding upward momentum was strong, and the current consolidation or minor pullback is being met with buying interest at a mathematically significant point. For example, if Bitcoin recently rallied from point A (low) to point B (high), and has now retraced to the 61.8% level of that rally and is holding, it's a classic sign that bulls are re-entering the market, viewing the pullback as a discounted buying opportunity. The confluence of a psychological level with a Fibonacci support level would create an even more potent support zone, significantly increasing the probability of a price bounce. Traders often look for candlestick confirmation at these Fibonacci levels before committing to a position.
4. Volatility Analysis: US Evening and Asian Morning Hours
Volatility is an inherent characteristic of Bitcoin, representing the degree of variation of its trading price series over time. The observation that BTCUSD volatility tends to increase during US evening and Asian morning hours is a valuable insight for strategic trade timing. This period typically corresponds to the overlap between the closing of the New York trading session and the opening of major Asian financial centers like Tokyo, Hong Kong, and Singapore.
Several factors contribute to this heightened volatility:
Market Overlap and Liquidity Shifts: As one major market winds down and another ramps up, there can be shifts in liquidity. The initial hours of the Asian session often bring fresh news, order flows, and participants, leading to price discovery and increased trading activity.
News Dissemination: Significant economic data releases, corporate earnings (for Bitcoin-related companies), or crypto-specific news from either the US (late announcements) or Asia can occur during these hours, directly impacting BTCUSD prices.
Algorithmic Trading: Many trading algorithms are programmed to react to specific inter-market conditions or news events, and their activity can amplify price movements during these transitional periods.
Derivatives Market Activity: The global nature of Bitcoin derivatives markets (futures, options) means that activity in these markets can influence spot prices around the clock. The US evening/Asian morning window sees active participation from traders in these regions.
For traders, this period of increased volatility presents both opportunities and risks. Opportunities arise from potentially larger price swings that can be capitalized upon with well-timed entries. Risks are elevated due to the potential for rapid price changes, which can trigger stop-losses or lead to slippage. Therefore, while these hours can be opportune for entry, they also demand heightened vigilance and robust risk management.
5. Entry Strategies: Volatility, Candlestick Patterns, and Timing
Leveraging the increased volatility during US evening and Asian morning hours for entry timing requires a methodical approach, primarily focusing on the confirmation provided by bullish candlestick patterns. Candlestick charts offer a visual representation of price movements and can signal shifts in market sentiment and potential reversals or continuations.
Key Bullish Candlestick Patterns for Entry Confirmation:
Hammer: Appearing after a downtrend, a Hammer is characterized by a small real body at the upper end of the trading range, with a long lower shadow (at least twice the size of the body) and little to no upper shadow. It indicates that sellers initially pushed prices down, but buyers stepped in strongly to drive prices back up near the open, suggesting a potential bottom and bullish reversal.
Inverted Hammer: Also a bottom reversal pattern, the Inverted Hammer has a small real body at the lower end of the trading range, a long upper shadow, and a short (or absent) lower shadow. It suggests that buyers attempted to push the price up, but sellers resisted. However, the fact that buyers showed strength is a tentative bullish sign, requiring further confirmation.
Bullish Engulfing: This is a powerful two-candle reversal pattern. The first candle is bearish (red/black), and the second candle is bullish (green/white) with a real body that completely "engulfs" the real body of the preceding bearish candle. It signifies that buying pressure has overwhelmed selling pressure.
Piercing Line: Another two-candle bullish reversal pattern seen after a downtrend. The first candle is a strong bearish candle. The second candle opens below the low of the first candle but then closes more than halfway up the real body of the first bearish candle. This indicates a significant shift in sentiment from bearish to bullish during the second candle's session.
Morning Star: A three-candle bullish reversal pattern. It begins with a long bearish candle, followed by a small-bodied candle (which can be bullish or bearish and ideally gaps down from the first candle), and then a long bullish candle that closes well into the body of the first bearish candle (ideally gapping up from the second candle). The small middle candle (the "star") represents indecision, and the strong bullish third candle confirms the reversal.
Three White Soldiers: This is a strong bullish continuation or reversal pattern consisting of three consecutive long-bodied bullish candles. Each candle should open within the body of the previous candle and close at or near its high, making progressively higher highs. It signals sustained buying pressure.
Strategic Entry Timing:
Monitor Volatile Periods: Be particularly attentive to price action during the US evening and Asian morning hours.
Identify Key Support: Note the psychological levels and Fibonacci retracement zones where BTCUSD is expected to find support.
Scan for Bullish Candlesticks: Look for the formation of one of the aforementioned bullish candlestick patterns (or others like Dojis at support, Bullish Harami) at or near these support levels during the identified volatile periods.
Seek Confirmation: Wait for the candlestick pattern to fully complete at the close of its period (e.g., end of the hour for an hourly chart). Some traders wait for the next candle to trade above the high of the bullish pattern for further confirmation.
Volume Analysis: Higher trading volume accompanying the formation of a bullish candlestick pattern adds to its reliability, indicating stronger conviction behind the buying pressure.
Context is Key: Bullish reversal patterns are most potent when they appear after a discernible pullback within a larger uptrend, or at the end of a consolidation phase near strong support.
By combining the timing advantage of predictable volatility spikes with the confirmation signals from bullish candlestick patterns at technically significant support levels, traders can refine their entry strategies for BTCUSD.
6. Other Key Technical Indicators for Comprehensive Analysis
While the core observations provide a strong foundation, incorporating other technical indicators can offer a more holistic view of BTCUSD's market dynamics:
Moving Averages (MAs): MAs smooth out price data to identify trend direction and potential support/resistance. The 50-day, 100-day, and 200-day SMAs (Simple Moving Averages) or EMAs (Exponential Moving Averages) are widely watched. Price trading above these MAs is generally bullish. Crossovers, like a "golden cross" (50-day MA crossing above the 200-day MA), are considered strong long-term bullish signals. Conversely, a "death cross" (50-day MA crossing below the 200-day MA) is bearish.
Relative Strength Index (RSI): This momentum oscillator measures the speed and change of price movements, ranging from 0 to 100. An RSI above 70 is often considered overbought (suggesting a potential pullback), while below 30 is oversold (suggesting a potential bounce). However, in strong trends, BTCUSD can remain in overbought or oversold territory for extended periods. Bullish or bearish divergences between price and RSI (e.g., price making a new high while RSI makes a lower high) can signal weakening momentum.
MACD (Moving Average Convergence Divergence): This trend-following momentum indicator consists of the MACD line and a signal line. A bullish crossover occurs when the MACD line crosses above the signal line, suggesting increasing upward momentum. A bearish crossover is the opposite. The MACD histogram visualizes the distance between the MACD and signal lines; a growing positive histogram is bullish.
Horizontal Support and Resistance Levels: Beyond Fibonacci, historical price action creates distinct support (price floor) and resistance (price ceiling) levels. These are areas where the price has previously reversed or consolidated. Identifying these levels on daily and weekly charts provides a broader map of potential turning points.
Trendlines and Channels: Drawing trendlines connecting successive lows (uptrend line) or highs (downtrend line) helps visualize the dominant trend. Price often respects these lines. Parallel trendlines can form channels, providing dynamic support and resistance boundaries. A break out of a well-established trendline or channel can signal a significant change in trend.
Volume Analysis: Trading volume is a critical confirming indicator. A price rally accompanied by increasing volume is generally seen as healthy and sustainable. Conversely, a rally on declining volume may indicate weakening conviction. Spikes in volume during breakouts above resistance or bounces from support add validity to the price move.
Integrating these indicators with the primary observations about psychological levels, Fibonacci support, and candlestick patterns during volatile periods can provide a more robust and nuanced trading framework.
7. Risk Management in Bitcoin Trading
The high volatility inherent in BTCUSD, while offering profit potential, also necessitates stringent risk management. Without it, traders expose themselves to significant losses. Key risk management practices include:
Stop-Loss Orders: Always define an exit point for a trade if it moves against you. A stop-loss order automatically closes a position when the price reaches a predetermined level, limiting potential losses.
Position Sizing: Determine the appropriate amount of capital to allocate to a single trade based on your overall portfolio size and risk tolerance. A common rule is to risk no more than 1-2% of trading capital on any individual trade.
Risk/Reward Ratio: Before entering a trade, assess the potential profit (reward) versus the potential loss (risk). Aim for trades where the potential reward is significantly greater than the risk (e.g., 2:1 or 3:1).
Diversification: While this analysis focuses on BTCUSD, traders should consider diversifying their overall crypto portfolio if they are investors, rather than concentrating all funds in one asset.
Emotional Discipline: Avoid making trading decisions based on fear (FUD - Fear, Uncertainty, Doubt) or greed (FOMO - Fear Of Missing Out). Stick to a well-defined trading plan.
8. Potential Future Outlook (Based on Technicals)
Based on the current technical posture where Bitcoin shows strength above a key psychological level and finds support at Fibonacci retracement zones, the outlook leans cautiously optimistic, contingent on these supports holding.
Bullish Scenario: If BTCUSD continues to respect these support levels, particularly during periods of consolidation, and bullish candlestick patterns during volatile US evening/Asian morning hours lead to upward impulses, further upside is likely. A sustained break above immediate overhead resistance, confirmed by volume, could see BTCUSD challenge its next major resistance zones and potentially trend towards new highs. The ongoing defense of psychological levels is paramount for this scenario.
Bearish Scenario: Should the identified support levels (psychological and Fibonacci) fail to hold, the outlook could shift. A decisive break below these supports, especially on increased selling volume, would indicate that sellers have gained control. This could lead to a deeper correction, targeting lower support structures and potentially invalidating the current bullish sentiment. Increased volatility during the US evening/Asian morning hours could, in this case, exacerbate downward moves if bearish patterns emerge.
9. Conclusion
The technical analysis of BTCUSD reveals a market displaying notable strength, characterized by its ability to hold above a significant psychological price point and find robust support at Fibonacci retracement levels. This underlying resilience is a positive sign for bulls. The tendency for volatility to surge during the US evening and Asian morning trading sessions presents strategic windows for traders, particularly when seeking entries confirmed by validated bullish candlestick patterns at these critical support junctures.
A comprehensive trading approach should also integrate other indicators like moving averages, RSI, MACD, and volume analysis to confirm signals and understand the broader market context. While the current technical setup suggests a favorable environment for bulls, the inherent volatility of Bitcoin demands disciplined risk management practices. Traders must remain vigilant, adapting their strategies to the evolving price action and ensuring that any bullish conviction is continuously validated by the market's behavior at these key technical inflection points. The interplay between these technical elements will be crucial in determining BTCUSD's trajectory in the near to medium term.

BTC LONG TP:105,500 14-05-2025🚀 LONG setup active
Entry between 102,000 and 102,500, targeting 105,500–106,000 on the 4H chart.
Estimated duration: 1 to 2 days ⏳
Price needs to rest and accumulate before pushing higher — but the upside potential is still intact.
Volatility and manipulations may hit hard, so trade cautiously.
We’re aiming for a 4RR here.
If the move doesn’t happen within that window, the setup is invalid.
We don’t use indicators, we’re not out here drawing lines or cute little shapes — I just give you a clean trade.
#BTC #PriceAction #Reydragon21

BTC/USDT Scalping Opportunity – Fib & Trendline Confluence!As analyzed, BTC is sitting perfectly at the Fibonacci level combined with trendline support – a strong confluence zone for a long scalp.
📌 Entry 1: 101.8k
📌 Entry 2: 101.6k
🛡️ Stop Loss: 1hr candle close below 101.4k
🎯 Target: 300 – 1000 points
This zone has been tested and respected multiple times. We either bounce strong from here or hunt the liquidity at 100.7k before reversal. Both plans are marked in green – stay sharp!
#Bitcoin #BTCUSDT #Scalping #CryptoTrading #PriceAction #Trendline #FibStrategy

Bitcoin Update – Expecting a Correction to $96K! Crypto traders! 💙 Bitcoin looks ready for a pullback to our key level at $96,000. I’m waiting to BUY in this zone, but if the level breaks and price stabilizes below, I’ll consider a SHORT trade to our next target (as previously defined).
⚡️ Pro Trading Tip:
✅ If you’re a trader, always have a strategy—be ready for any scenario!
✅ For long-term investors, accumulate on dips near support levels.
📌 Risk management is key! Double your position size at each lower level to drastically reduce your average entry price.
💎 The Golden Rule of Crypto Success:
🔹 Keep losses small & disciplined.
🔹 Let your winners run to maximize gains!
🔹 The market is unpredictable, but YOU control your capital!
🚀 Bitcoin never sleeps—what’s your play?
👇 What’s your take on this move?
For detailed entry points, trade management, and high-probability setups, follow the channel:
ForexCSP

Momentum Fades: Is Bitcoin Poised for a Pullback to Rebalance?Given the recent easing of US-China tariff tensions 🇺🇸🇨🇳, we’re observing a notable rotation of capital into equities 📈. This shift is lending strength to the US dollar 💵, which in turn has exerted downward pressure on Bitcoin’s price action. After a strong momentum-driven rally 🚀, Bitcoin is now showing early signs of weakness, suggesting a potential consolidation or a measured pullback.
With equity markets—particularly tech stocks—appearing overextended 🏦, a retracement seems likely. Since Bitcoin remains closely correlated with the tech sector, a synchronized pullback across both asset classes is a plausible scenario. I’m closely monitoring for a counter-trend opportunity, specifically eyeing a short entry should we see a decisive break in market structure 🔍.
It’s important to note that this setup is highly dependent on price action confirming the thesis as outlined in the accompanying video. If the anticipated conditions do not materialize, this trade idea will be promptly invalidated. ⚠️
Disclaimer:
This analysis is for informational purposes only and does not constitute financial advice. Trading cryptocurrencies and equities involves significant risk. Please conduct your own research and consult with a professional advisor before making any investment decisions. 📊

"Bearish Reversal Setup with Target at Key Support Zone (95,440 1. EMA Indicators:
50 EMA (red line): Currently at 103,112.73.
200 EMA (blue line): Currently at 98,739.46.
The price is above both EMAs, typically a bullish sign, but the analysis suggests a potential reversal.
2. Support Zone (Top Pink Box):
Around the 105,000–106,000 USD range.
Labeled as "support" but is likely being interpreted as a resistance now due to failure to break higher.
3. Target Zone (Bottom Pink Box):
Around the 95,000–96,000 USD range.
Marked as the "target point" for a potential drop.
4. Bearish Projection:
A curved arrow suggests a rejection from the current levels (~104,000 USD) leading down toward the target zone.
Large blue arrow emphasizes expected bearish momentum.
Interpretation:
The chart suggests a reversal from the recent highs and expects a decline toward the 95,440.94 USD support.
This could be driven by:
Rejection from resistance.
Overbought conditions.
Price losing momentum near the upper level.
Confirmation may be awaited via a break below the 50 EMA or loss of key support.
Strategy Implication:
Short bias if price fails to reclaim the resistance.
Take profit potentially near the 95,440 level.
Invalidation of the bearish scenario may occur on a strong breakout above the resistance zone (~105,700 USD).

BITCOIN BUY LIMIT Hello friends
If you are a risk taker, this position is for you...
Given the price growth, we expect a correction, so in the pullback we have identified important points to buy with capital and risk management and move towards the specified goals.
*Trade safely with us*


#BTC Long Setup Idea – Watching Monday's LowPlan:
Will look to enter a long position if BTC sweeps Monday’s low and reclaims above with strong confirmation.
Reasoning:
• Liquidity grab below Monday’s low
• Potential bullish reversal after sweep
• Waiting for confirmation to avoid fakeouts
⚠️ Risk & Disclaimer:
• No entry without confirmation
• Use proper risk management
• Not Financial Advice – DYOR
• Trade according to your own strategy

(BTC/USD) Short Trade Setup: Key Resistance Rejection with Targe1. Entry Point: 104,855
This is where the trader plans to enter a short position (sell).
Price is slightly below this level at the moment (103,775).
2. Stop-Loss Zone: ~104,807
Highlighted in purple above the entry.
Indicates where the trader will exit if the market moves against them to limit losses.
3. Resistance Point: 103,086
This level has been tested multiple times and may act as a ceiling for prices.
If broken and held, it might invalidate the short setup.
4. Target Point: 93,159
This is the take-profit level for the short trade.
Represents a drop of approximately -10.76% from the entry point.
5. Trend Analysis:
The chart shows an uptrend leading into a potential distribution or topping pattern near the resistance zone.
A potential bearish move is anticipated, hence the short strategy.
6. Support Zones:
Highlighted in purple near the target area (around 93,159).
Historically strong buying areas.
Interpretation:
The trader expects the current resistance level to hold, prompting a downward correction toward the target zone at 93,159. If price moves above 104,807, the setup is invalidated, hence the stop-loss placement.

XAUUSD BULLISH OR BEARISH DETAILED ANALYSISXAUUSD is currently trading around 3250, consolidating within a well-defined bullish flag structure after a strong impulsive rally. This flag pattern on the 12-hour chart reflects healthy profit-taking and reaccumulation after a significant upward move. The current price action is respecting the lower boundary of the flag, and with growing volume on bullish candles, the setup suggests a high probability of a breakout to the upside, targeting the 3650 region.
From a macroeconomic perspective, gold remains in strong demand due to ongoing global uncertainties and persistent inflation concerns. The US CPI print remains sticky above 3%, keeping real yields under pressure and supporting gold's bullish bias. Furthermore, with the Fed expected to hold interest rates steady for longer, the market is starting to price in fewer rate cuts this year. This continues to undermine the USD and supports gold as a store of value. Additionally, rising central bank gold purchases and geopolitical risk premium are adding further tailwinds.
Technically, we are watching for a clean breakout above the upper flag resistance around 3280–3300. A breakout with volume confirmation would open the door toward the psychological 3400 level first, followed by a push toward the 3650 target area. Momentum indicators are turning up, and price is showing signs of basing just above previous support levels, adding confidence to the bullish continuation scenario.
Gold remains one of the strongest trending assets in 2025, and this consolidation is likely just a pause before the next leg higher. As global markets digest the impact of persistent inflation and macro volatility, precious metals like gold are likely to outperform. This flag formation provides a textbook continuation setup for traders looking to position with the broader trend.

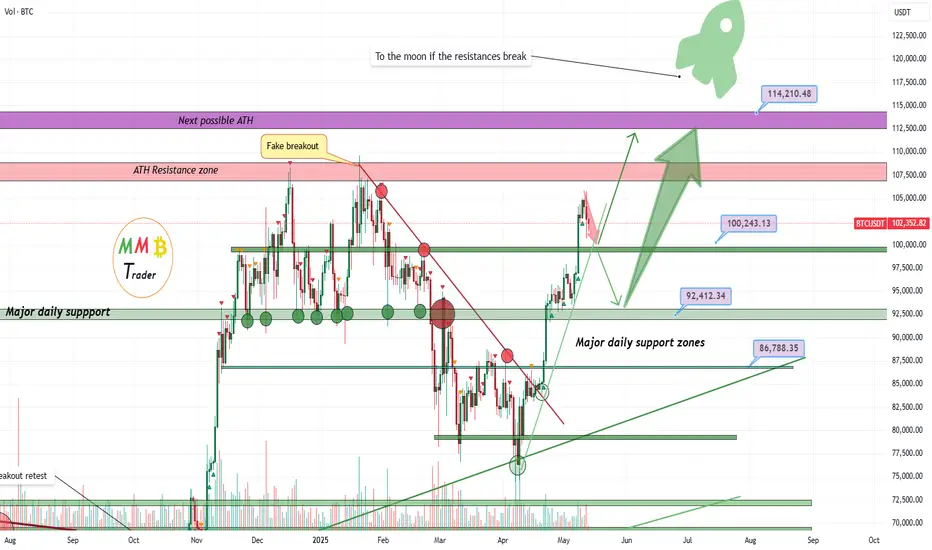
BTCUSDT major daily support zones will pump it again to new ATHAs we can see on the chart now price had a huge amount of pump from our daily low and this pump will continue to new ATH soon but for now we may have range and short-term correction first like the red arrow and then again more gain is ahead like green arrows.
DISCLAIMER: ((trade based on your own decision))
<<press like👍 if you enjoy💚
BTC Breakdown Alert: Key Support Levels in FocusDescription
#BTC If we break below the grey support zone, expect a potential move down toward the highlighted purple demand area. Watch for reaction at the grey box to determine bearish continuation or support bounce.

BTC Crossroads: Will Tariff News Trigger a Counter-Trend Move?Given the recent easing of US-China tariff tensions, Bitcoin may consolidate or experience a slight pullback as capital rotates into equities. The resulting strength in the US dollar could further contribute to a Bitcoin retracement. I'm watching for a potential counter-trend setup, specifically a short entry on a break of market structure. However, this scenario is contingent on the price action unfolding as described in the video; otherwise, the idea will be invalidated.
Not financial advice.

BTC - 180k topBTC - Local bottom was around 74k, now heading towards 180k which will be the top for this cycle.
74 – – – - – – 54 bottom.

SHARE THE IDEA ABOUT BTCUSD BEARISH PATTERNCurrent Market Overview:
Price Action: Bitcoin has rallied approximately 40% from its April lows, reaching a high near $105,525 today.
Support Levels: Key support is identified around $100,000, with additional support near $92,000.
Resistance Levels: Immediate resistance is observed around $107,000, with a potential upside target near $120,000 if bullish momentum continues.
Bearish Pattern Analysis:
While the broader trend remains bullish, certain patterns indicate possible short-term bearish movements:
Head and Shoulders Formation: Some analysts have noted a potential head and shoulders pattern forming, which could signal a reversal if confirmed.
Momentum Indicators: The Relative Strength Index (RSI) is above 70, suggesting overbought conditions that might precede a pullback.

BTC/USDTbtc is up 42% since the 74k bottom. after every pump,we have seen a 4% dip so im expecting another one here.

Bullish Tide: Are Bears Drowning as $31M Shorts VanishBullish Tide: Are Bears Drowning as FWB:31M Shorts Vanish and "Price Discovery 2" Looms?
The cryptocurrency landscape is once again electric with anticipation, and at the heart of this renewed fervor stands Bitcoin. As of May 2025, the prevailing winds appear to be firmly in the sails of the bulls. A cascade of recent market events, headlined by a dramatic $31 million liquidation of Bitcoin short positions, is sending a stark warning to pessimistic speculators. This, coupled with compelling technical analysis suggesting that Bitcoin must close the week above a crucial level to initiate 'price discovery 2', paints a picture of a market on the brink of a potentially explosive upward trajectory.
This isn't merely about fleeting price surges. Underlying these market dynamics is a growing conviction that Bitcoin doesn’t need to change; the world does. While critics often call for Bitcoin to become "faster, cheaper, greener," a powerful counter-narrative champions its existing, robust design as a solution to the inherent weaknesses of traditional systems. Adding fuel to this bullish fire is the subtle but significant trend of Bitcoin’s Quiet Coup, as wealth funds methodically build up their holdings. Furthermore, market sentiment indicators like Bitcoin funding rates remaining positive on major exchanges like Binance seem to confirm a strong, underlying uptrend. Are Bitcoin bears truly losing out, and are we witnessing the dawn of a new era for the king of cryptocurrencies?
The Cost of Doubt: $31 Million in BTC Shorts Wiped Out
The unforgiving nature of leveraged trading in the cryptocurrency markets was recently laid bare with the news that a staggering $31 million in Bitcoin short positions were liquidated. This event serves as a potent illustration of the risks involved in betting against Bitcoin's momentum, especially in the current climate.
Short selling in the crypto sphere, much like in traditional markets, involves traders borrowing Bitcoin, selling it with the expectation that its price will fall, and then planning to buy it back at a lower price to profit from the difference. However, the crypto markets are known for their high volatility and the widespread use of leverage, particularly in perpetual futures contracts. Leverage allows traders to control a much larger position than their initial capital would normally allow, amplifying potential profits but also, crucially, potential losses.
When the market moves sharply against a leveraged short position – meaning Bitcoin's price surges upwards – traders can face a margin call. If they cannot add more funds to cover their mounting losses, the exchange automatically closes their position to prevent further debt. This forced closure is a liquidation. The $31 million wipeout signifies that a substantial volume of bets on Bitcoin's price decline was overwhelmed by a potent wave of buying pressure.
This mass liquidation event has several implications. Firstly, it inflicts significant financial pain on those who were positioned for a downturn, effectively Bitcoin bears losing out on their wagers. Secondly, these forced closures inherently involve buying Bitcoin to cover the short positions, which paradoxically adds more fuel to the upward price movement. This can trigger a "short squeeze," where rising prices force more shorts to cover, leading to further liquidations and an accelerated price rally. Such events bolster bullish sentiment, demonstrating underlying market strength and deterring further aggressive short selling. It’s a clear signal that the market's undercurrent was far more robust than the bears had anticipated.
On the Cusp of a New Frontier: The Critical Weekly Close and "Price Discovery 2"
The excitement among Bitcoin proponents is palpable, with many analysts asserting that Bitcoin bulls are on the cusp of launching the market back to all-time highs and beyond. Central to this optimistic outlook is the focus on an upcoming, crucial weekly close. According to prevailing technical analysis, Bitcoin must close the week above a specific, strategically important price level to start 'price discovery 2'.
"Price discovery" is the process by which market participants determine the fair value of an asset through their buying and selling activities. When an asset like Bitcoin surpasses its previous all-time high (ATH), it enters a phase where historical resistance levels cease to exist. This is true price discovery – the market is venturing into uncharted territory, with no past price ceilings to act as psychological or technical barriers. "Price Discovery 1" can be considered Bitcoin's journey to its previous peak (around $69,000 in November 2021). The term "Price Discovery 2" thus implies a new, sustained bull run that would take Bitcoin significantly beyond that former zenith.
The significance of a "weekly close" above a key resistance level cannot be overstated in technical analysis. Weekly charts smooth out short-term noise and are often seen as better indicators of major trend shifts. A decisive weekly close above, say, the previous ATH or a major interim peak, would be a powerful confirmation for many traders and investors that the bulls are firmly in control. It would invalidate bearish scenarios that predicted a rejection at these upper levels and would likely attract a fresh wave of capital into the market.
Several potent catalysts could fuel this ascent into "Price Discovery 2." The quadrennial Bitcoin halving event, the most recent of which occurred in April 2024, historically constricts the new supply of Bitcoin, often leading to significant price appreciation in the months and years that follow as demand outstrips this reduced supply. Continued institutional adoption, evidenced by wealth funds accumulating Bitcoin, provides a steady stream of large-scale buying pressure. Furthermore, a challenging macroeconomic environment, characterized by persistent inflation in major fiat currencies or geopolitical uncertainties, can enhance Bitcoin's appeal as a non-sovereign store of value and a hedge against systemic risks. Should Bitcoin achieve this critical weekly close and embark on "Price Discovery 2," the upside could be substantial, as the market seeks to establish a new equilibrium in uncharted price territory.
The Unwavering Standard: Bitcoin Doesn’t Need to Change, The World Does
Amidst the price charts and market analyses, a more profound narrative is solidifying: Bitcoin doesn’t need to change; the world does. For years, critics have argued that Bitcoin should be faster, cheaper, greener, often comparing its transaction throughput or energy consumption to centralized payment networks or newer, less proven blockchain protocols. However, an increasing number of proponents argue that maybe the point isn’t to fix Bitcoin. Maybe it’s to fix everything else with Bitcoin.
This perspective champions Bitcoin's core attributes – often perceived as limitations by detractors – as its most vital strengths:
• Unparalleled Decentralization: Bitcoin operates on a globally distributed network with no single point of control. This makes it resistant to censorship, shutdown, or manipulation by any government or corporation. In an age of increasing financial surveillance and control, this is a feature, not a bug.
• Robust Security and Immutability: The Proof-of-Work (PoW) consensus mechanism, while energy-intensive, is what underpins Bitcoin's formidable security. The immense computational power dedicated to mining creates an economic fortress around the network, making its transaction history virtually tamper-proof. While the "greener" argument often pushes for alternatives like Proof-of-Stake (PoS), many believe PoW offers a unique level of objective security crucial for a global store of value. Moreover, the narrative around Bitcoin's energy use is evolving, with increasing adoption of renewable and stranded energy sources for mining, and a growing recognition that its energy consumption is a worthwhile trade-off for securing a truly independent financial system.
• Absolute Scarcity: Bitcoin's supply is capped at 21 million coins, a hard-coded limit that cannot be altered. This programmatic scarcity makes it a powerful antidote to the inflationary pressures inherent in fiat currencies, which can be created limitlessly by central banks. This "digital gold" characteristic is fundamental to its value proposition.
• Layered Scaling: While the Bitcoin base layer prioritizes security and decentralization over raw transaction speed, innovation is flourishing on Layer 2 solutions like the Lightning Network. These protocols enable fast, low-cost transactions by batching them off-chain and settling them periodically on the main Bitcoin blockchain, thus allowing Bitcoin to scale for everyday payments without compromising its core principles.
The argument is that instead of trying to mold Bitcoin to fit the constraints of the old financial world, we should recognize how its unique properties can address the systemic flaws within that world – issues like inflation, financial exclusion, censorship, and counterparty risk. Bitcoin, in its current form, offers a radical, resilient alternative.
The Silent Infiltration: Wealth Funds Build Up Bitcoin Holdings
Further bolstering the bullish case is the ongoing, often understated, trend of Bitcoin’s Quiet Coup: Wealth Funds Build Up Holdings. This isn't about flashy headlines but rather a methodical, strategic accumulation of Bitcoin by sophisticated institutional investors, including pension funds, endowments, sovereign wealth funds, and large family offices.
These entities, traditionally conservative and managing trillions of dollars in assets, are increasingly allocating a portion of their portfolios to Bitcoin. Their motivations are manifold:
• Diversification: Bitcoin has historically exhibited low correlation with traditional assets like stocks and bonds, making it an attractive addition for enhancing portfolio risk-adjusted returns.
• Inflation Hedge: In an environment of persistent global inflation, Bitcoin's finite supply positions it as a potential store of value, a digital hedge against currency debasement.
• Asymmetric Upside: Even a small allocation to Bitcoin can offer significant upside potential, an appealing proposition for large funds seeking growth.
• Growing Regulatory Clarity and Infrastructure: The approval of Bitcoin ETFs in major jurisdictions like the U.S. has provided regulated and accessible avenues for institutional investment, alongside the development of institutional-grade custody and trading solutions.
This "Quiet Coup" signifies a maturing perception of Bitcoin, moving it from a speculative niche asset to a legitimate component of institutional investment strategy. The steady inflow of significant capital from these large players not only provides price support but also lends credibility and encourages further adoption, potentially reducing long-term volatility as more Bitcoin is held by entities with long-term horizons.
Reading the Bullish Tea Leaves: Bitcoin Funding Rates Remain Positive
Adding another layer of confirmation to the prevailing bullish sentiment is the observation that Bitcoin Funding Rates Remain Positive On Binance — Strong Uptrend Confirmed? Funding rates are a key mechanism in cryptocurrency perpetual futures markets, designed to keep the price of the perpetual contract aligned with the spot price of the underlying asset.
When funding rates are positive, it generally means that traders holding long positions (betting on a price increase) are paying a premium to those holding short positions. This indicates a higher demand for long leverage, reflecting overall bullish sentiment in the derivatives market. Consistently positive funding rates on a major exchange like Binance, which boasts significant trading volume, suggest that this optimism is sustained. It implies that traders are confident enough in Bitcoin's upward trajectory to pay a recurring fee to maintain their leveraged long positions.
While extremely high funding rates can sometimes signal an over-leveraged market ripe for a correction (a "long squeeze"), moderately and persistently positive rates, as currently observed, are often interpreted as a healthy sign of a strong and well-supported uptrend. It suggests that the rally is not just speculative froth but is backed by conviction among active traders.
Conclusion: A Perfect Storm for Bitcoin's Next Chapter?
As May 2025 progresses, the confluence of factors points towards a potentially transformative period for Bitcoin. The $31 million decimation of short positions serves as a stark reminder of the perils of underestimating Bitcoin's strength. The market's eager anticipation of a weekly close that could unlock "Price Discovery 2" highlights the potent bullish technical setup. This is further reinforced by the fundamental conviction that Bitcoin's core design is its ultimate strength, offering solutions the traditional financial world desperately needs.
The quiet, strategic accumulation by wealth funds injects not only capital but also a profound sense of legitimacy, while positive funding rates reflect a confident and sustained bullish sentiment among active traders. While the path ahead will undoubtedly feature volatility – a characteristic inherent to Bitcoin's journey – the current alignment of technical indicators, institutional adoption, strong market sentiment, and a compelling fundamental narrative suggests that Bitcoin bears may indeed be losing out, and significantly so. The stage appears set for Bitcoin to not only challenge its previous highs but to potentially embark on a new, exhilarating phase of growth and adoption, further solidifying its role in the evolving global financial order.

BTCUSDT SHORTHere’s the translation for your analysis:
"The price here is a good level to open a sell position. The future buy and sell levels I've marked are based on the perspective it creates for us, but for now, it's just a viewpoint."
ITS POSSIBLE SCENARIO FOR BTCUSDT.

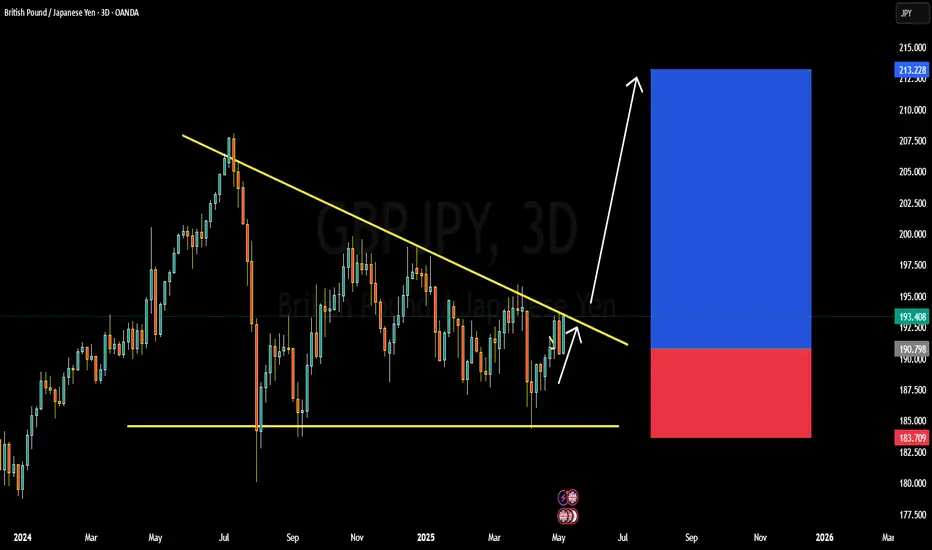
GBPJPY BULLISH OR BEARISH DETAILED ANALYSISGBPJPY is currently trading near 190.80 and is forming a significant breakout structure on the 3-day chart. After months of consolidation under a descending trendline, the pair is now coiling tightly, signaling a potential bullish breakout. The pair has respected the lower support range near 183.70 while pushing up against descending resistance multiple times. This squeeze pattern often precedes a major directional move, and with bullish momentum building, GBPJPY could be primed for a rally toward the 210.00 zone.
Fundamentally, the British pound is finding strong support from the latest hawkish commentary by the Bank of England, which has hinted that inflation remains sticky, keeping rate cut expectations delayed. On the other hand, the Japanese yen remains under consistent pressure due to the Bank of Japan's ultra-dovish stance and yield curve control policies. The BoJ’s reluctance to shift its policy outlook, coupled with soft macro data from Japan, is weakening the yen across the board.
Technically, a breakout and close above the descending trendline around 194.00 will be a key confirmation point. If this happens, bulls could dominate and push GBPJPY toward the 210.00 resistance zone in the medium term. The R\:R on this setup remains favorable with stops safely tucked below 183.70, giving this trade strong upside potential.
This pair is currently one of my top watchlist setups for May as both the technical and fundamental landscapes align. With bullish sentiment driving GBP strength and JPY weakness being a prevailing macro theme, GBPJPY could deliver a powerful upside continuation if the breakout confirms.
$BTC Looking Bullish CRYPTOCAP:BTC $104,987 resistance testing, as expected some struggle here at given key resistance area. $103,093 support tested and holding as of now, Bullish engulfing on last 1D close, need to see if it gets follow thru Today. RSI on 1D in oversold region, 4H RSI looking good, 18H left to close current weekly, looking bullish as MACD turns green, $99,361 remains key support, current support range $103,093-$102,280.

BTC in 17 April 2025Potential Major Move on Thursday, April 17, 2025 📍
📊 Based on an analysis of historical Bitcoin chart averages and similar patterns, there is a likelihood of a significant price movement on this date.
This analysis is conducted using technical analysis and a detailed examination of Bitcoin’s movement averages. It suggests that approximately every 150 days after the start of a neutral trend, we can expect a sharp upward or downward move that sets the stage for the main trend in the future.
📅 As of the current date, March 29, 2025, there are about 18 days left until this significant event.
You can follow the results of this analysis and the conducted review on TradingView on the specified date.
