(BTC/USD) 1H Trade Setup – Key Entry, Stop Loss & Dual TargetEntry Point: 95,431
Stop Loss: 95,264
Target Points:
Upside (Target 1): 100,674 (Potential gain: +5.36%)
Downside (Target 2): 86,614 (Potential loss: -7.57%)
Trade Setup:
Risk-Reward Ratio:
Approx. 1:0.7 (Not ideal; the reward is smaller than the potential loss)
Support Zones:
Highlighted in purple beneath the entry zone — this indicates a historically strong support area.
Resistance Zones:
The upper purple zone marks the next significant resistance around 100,000–100,795.
Technical Indicators:
50 EMA (Blue Line): Indicates mid-term trend support, currently holding price action.
Price Action: BTC appears to be retracing toward support after a bullish rally.
Interpretation:
The setup implies a long (buy) position with a very tight stop loss.
The price is nearing a support zone, and if it holds, there's potential for an upward move to the target at 100,674.
However, if price breaks below 95,264, a sharp drop to 86,614 is anticipated.
Btcupdate

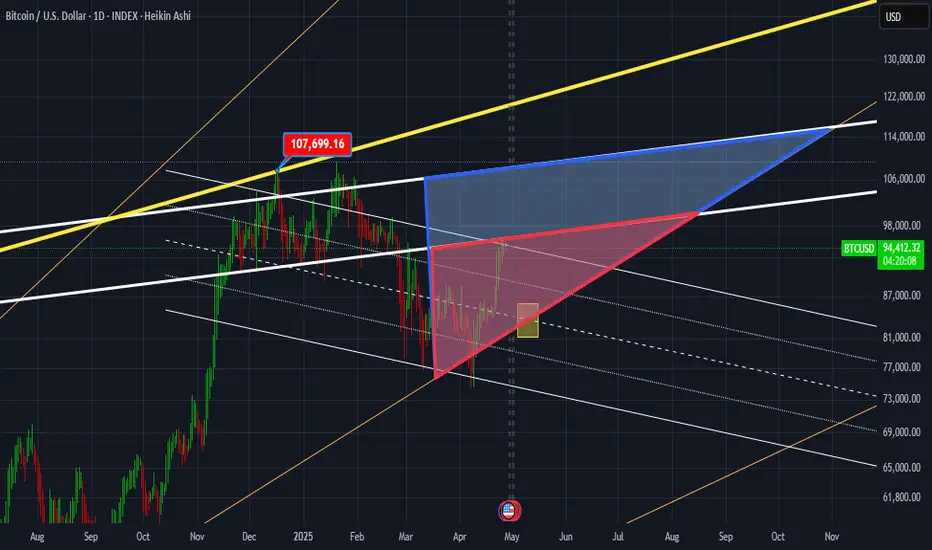
BTC in Bermuda triangle!I love shapes. Shapes have a rich and deep philosophy and give you an idea of what's going on in the mind of market's major players. BTC is no longer an infant, in fact, just like you, it's getting older and older everyday! "Now" the market movements are far beyond simple pump and dumps. No more slides in the park for baby bitcoin! Watch the small red triangle and the big blue one. The lovely yellow rectangle waves hands!
BTC Overextended: Awaiting the Perfect Pullback for a BuYBTC/USDT Analysis – 1D Timeframe
Bitcoin is currently looking overextended on the daily chart 📈, with price action pushing directly into a well-defined key resistance level 🚧. This area has historically acted as a strong supply zone, and with momentum appearing stretched, I’m anticipating a potential retracement in the near term.
My plan is to wait for BTC to pull back towards previous support zones Around the 61.8 Fibo level🛡️. I have a clear Point of Interest (POI) marked out, where I’ll be watching for price to react. If we see a bullish Break of Structure (BOS) on the pullback—I’ll be looking for a long entry from this area 🎯.
Key Levels to Watch:
Resistance: Current daily highs (where price is overextended) 🚩
Support/POI: Previous consolidation and demand zones below, which have shown strong buying interest in the past 🏦
Trade Plan:
- No FOMO entries at resistance! ❌
- Wait for a clean retrace into my POI
- Look for bullish confirmation (BOS) on lower timeframes before entering long ✅
- Manage risk accordingly and trail stops if the move plays out
Summary:
Patience is key here. I’m not interested in chasing price into resistance. Instead, I’ll let the market come to me and only act if my criteria are met. If BTC gives us the pullback and a bullish BoS, I’ll be ready to take the trade. Until then, I’m on the sidelines and monitoring price action closely 👀.
Disclaimer:
This analysis is for educational purposes only and does not constitute financial advice. Always do your own research and manage your risk appropriately. Trading cryptocurrencies involves significant risk and may not be suitable for all investors. 🚨

$BTC Daily Update - Back above $100KCRYPTOCAP:BTC : Well, Hello! $100K!!!😍
$102,280 support in effect currently, $103,093 resistance testing, current 1W candle looking mighty bullish, RSI looking good on 1D and 4H, $104,987 next key resistance, $99,361 current key support.

Bitcoin Hits $100K: Bull Run IgnitesWhat Tariff Shock? Bitcoin Surges Past $100K as Market Recovery Continues
The cryptocurrency market has been making headlines again as Bitcoin (BTC) surges past the $100,000 mark, signaling a robust recovery and potentially the start of a new bull cycle. In an environment marked by economic uncertainty, geopolitical tensions, and fluctuating central bank policies, Bitcoin’s remarkable resurgence has captured the attention of retail investors, institutional participants, and financial analysts alike.
This article delves into multiple facets of Bitcoin’s ongoing rally, including its recent rebound after a sharp drop, the role of whales in fueling the push toward $100K, the realized cap hitting a record high, and whether aggressive profit-taking by investors signifies a local top. Additionally, we’ll explore the implications of Bitcoin's return to $100K and why it hints at a "significant price move" that could shape the broader financial landscape.
________________________________________
Bitcoin Rebounds After Sharp Decline: The $100K Push
Bitcoin’s journey to $100,000 has been anything but smooth. After experiencing a sharp correction earlier in the year, many market participants feared that the cryptocurrency's bull run was over. However, Bitcoin's ability to rebound from its lows with renewed vigor has defied expectations.
Whales Drive the Rally
One key factor behind Bitcoin’s resurgence is the activity of "whales," large-scale investors who hold significant amounts of BTC. On-chain data reveals that whales have been accumulating Bitcoin during periods of lower prices, effectively acting as a stabilizing force during market downturns. By reducing liquidity in the market and concentrating their holdings, whales have created conditions conducive to a price surge.
In addition, whale wallets have been observed transferring large sums of Bitcoin out of exchanges and into cold storage, signaling a long-term bullish outlook. This withdrawal pattern reduces the supply of Bitcoin available for trading, increasing upward pressure on the price.
________________________________________
Realized Cap Hits Record High: A Bullish Signal
Another notable development supporting Bitcoin's rally is its realized capitalization (realized cap) hitting an all-time high. Unlike market capitalization, which multiplies the total supply of Bitcoin by the current price, the realized cap calculates the value of each Bitcoin at the price it was last moved. This metric provides a clearer picture of the aggregate cost basis of Bitcoin holders.
The realized cap reaching a record high indicates that a significant portion of Bitcoin has changed hands at higher price levels, reflecting increased investor confidence. This metric aligns with the narrative of accumulation, as both retail and institutional investors appear to be buying Bitcoin at higher prices in anticipation of future gains.
Accumulation Continues
On-chain analytics reveal that accumulation trends have persisted throughout Bitcoin's recovery. Wallet addresses holding between 1 and 10 BTC have grown substantially, showing that smaller investors are also entering the market. This broad-based accumulation not only adds to Bitcoin's bullish momentum but also reduces volatility by distributing supply across a wider range of participants.
________________________________________
Profit-Taking and Local Top Concerns
While Bitcoin's surge past $100,000 has been met with enthusiasm, some analysts caution that aggressive profit-taking by investors could signal a local top. Short-term holders, in particular, have been selling their Bitcoin to lock in gains, as evidenced by the increasing Spent Output Profit Ratio (SOPR).
Signs of a Local Top?
A high SOPR indicates that investors are realizing profits at a significant rate, which often coincides with price corrections. However, it’s important to note that profit-taking is a natural part of any market cycle and does not necessarily signal the end of a bull run. In fact, periods of consolidation and minor corrections can strengthen the foundation for a more sustainable rally.
Market sentiment, as measured by the Fear & Greed Index, has also entered the "Greed" zone, suggesting that bullish enthusiasm may be running high. Historically, extreme greed has preceded short-term pullbacks, making it crucial for investors to remain cautious.
________________________________________
New Bull Cycle? Bitcoin’s Return to $100K Hints at Significant Price Move
Bitcoin’s return to the $100,000 milestone has rekindled hopes of a new bull cycle, with analysts pointing to several factors that support this narrative. The cryptocurrency market has historically moved in cycles, driven by supply-demand dynamics, macroeconomic conditions, and technological advancements. The current environment appears to align with the early stages of a new bull phase.
Institutional Adoption and Macro Tailwinds
Institutional interest in Bitcoin has grown exponentially over the past few years. Major financial institutions, including hedge funds, pension funds, and publicly traded companies, have embraced Bitcoin as a hedge against inflation and a store of value. This influx of institutional capital has not only validated Bitcoin’s role as a legitimate asset class but also provided a steady source of demand.
Moreover, macroeconomic tailwinds such as high inflation, declining confidence in fiat currencies, and geopolitical instability have enhanced Bitcoin's appeal as a decentralized, non-sovereign asset. Central banks’ monetary policies, including quantitative easing and low interest rates, have further eroded the purchasing power of traditional currencies, driving investors toward Bitcoin.
Supply Shock and Halving Cycles
Bitcoin’s fixed supply of 21 million coins and its halving cycles play a crucial role in its price dynamics. The most recent halving in 2024 reduced the block reward for miners, effectively decreasing the rate at which new Bitcoin enters circulation. This supply shock, coupled with growing demand, has historically preceded significant price rallies.
On-chain data shows that long-term holders, who typically accumulate Bitcoin during bear markets, are now distributing their holdings during this bull phase. This redistribution of supply suggests that a new wave of investors is entering the market, further fueling the rally.
________________________________________
What’s Next for Bitcoin?
As Bitcoin continues to defy expectations, the question on everyone’s mind is: What’s next? While predicting Bitcoin’s price movements with precision is challenging, several scenarios could play out in the near term.
Scenario 1: Sustained Bull Run
If accumulation trends persist and institutional interest continues to grow, Bitcoin could maintain its upward trajectory, potentially reaching new all-time highs. Key resistance levels to watch include $120,000 and $150,000, which could serve as psychological barriers for further price appreciation.
Scenario 2: Short-Term Correction
A short-term correction is always a possibility, especially given the aggressive profit-taking observed in recent weeks. However, such corrections are often healthy for the market, allowing for consolidation and setting the stage for more sustainable growth.
Scenario 3: Macro-Driven Volatility
External factors, such as changes in monetary policy, regulatory developments, or geopolitical events, could introduce volatility to the market. While Bitcoin has shown resilience in the face of macroeconomic challenges, it remains sensitive to major news events.
________________________________________
Conclusion
Bitcoin’s surge past $100,000 marks a pivotal moment for the cryptocurrency market, signaling a robust recovery and the potential start of a new bull cycle. Driven by whale activity, record-high realized capitalization, and persistent accumulation, Bitcoin has defied skeptics and reasserted its dominance as the leading digital asset.
While concerns about a local top and profit-taking are valid, the broader trends suggest that Bitcoin is preparing for a significant price move. Whether this rally leads to sustained growth or faces temporary setbacks, one thing is clear: Bitcoin remains a transformative force in the financial world, offering a decentralized, inflation-resistant alternative to traditional assets.
As we look ahead, the combination of institutional adoption, macroeconomic tailwinds, and Bitcoin’s unique monetary policy positions it for continued success. For investors and enthusiasts, the journey to $100,000 and beyond is more than just a milestone—it’s a testament to the enduring promise of blockchain technology and the future of decentralized finance.

BTC Fractal Update!!CRYPTOCAP:BTC is repeating the same ABC pattern that led to past 70 %+ rallies.
We're now at a decision point — next weekly close will confirm:
Scenario 1: Rejection Below $96K (Circle 1)
→ Likely dip to $78K–$80.5K (channel bottom + 0.5 Fib)
→ Final shakeout before major move.
Scenario 2: Breakout Above $96K (Circle 2)
→ Retest at $90.5K
→ Then rally toward $160K+ begins (Circle 3)
BTC is hovering near the $100K mark — up 5% from the $96K breakout — mirroring the previous breakout from $63K (Circle 2), where it surged to $ 67K (+5%) before a sharp retest to $59.2K, followed by a major rally.
A similar healthy retest could be on the cards before CRYPTOCAP:BTC breaks its ATH!
If you find this analysis helpful, please hit the like button to support my content! Share your thoughts in the comments, and feel free to request any specific chart analysis you’d like to see.
Happy Trading!!

It’s ready to move!#BTC
👍👀 Daily Timeframe
Volume has dropped at the end of the bullish move.
Price is currently ranging in a decision zone.
✅ BTC is holding above the key 91,640 level. As long as it remains stable above this zone, there’s potential for a move toward the $100K area.
⚠️ As shown in the chart, $100K will act as a major resistance level before any attempt to reach $110K.
⚡ Meanwhile, price is testing the pivot zone around $97,400 — the same level that rejected the last bullish attempt.
So far, no strong reversal signals from this zone.
❌ But if price gets rejected again, we could see a breakdown below $93,700 and a retest of the support zone around $91,640.
💵 This support needs to hold for the bullish structure to stay intact.
✅ Historically, this level has repeatedly prevented BTC from dropping toward the $77K zone.
📈 I’m currently watching for a long setup, which will trigger only after a clear breakout above 97,400.
📉 For a short position, I’ll wait for a confirmed breakdown below 91,640.

BTC LIMITHello friends
Due to the price drop, we can buy in the price drop and move with it to the specified targets, of course with capital and risk management.
*Trade safely with us*

BTC/USD) bullish trend analysis Read The ChaptianSMC Trading point update
Technical(BTC/USDT) analysis outlines a bullish outlook with key technical levels and scenarios. Here's a breakdown of the idea:
Key Observations:
1. Trend Break and CHoCH (Change of Character):
The chart shows a clear break of the downtrend, confirmed by the CHoCH label — a common Smart Money Concept (SMC) signal indicating a potential trend reversal from bearish to bullish.
2. Key Zones Highlighted:
EVC-Buying Zone: Around 86,000 – 88,000 (aligned with EMA 200), marked as a strong accumulation area.
New Support Level: Around 92,000 – 93,000, potentially forming a bullish support after the recent rally.
Resistance Levels: Two major resistance zones near:
99,600 (intermediate resistance and target)
106,400 (final target)
3. RSI Indicator:
RSI is near 64, indicating strong momentum but not yet overbought — a potential sign of further upside.
4. Two Bullish Scenarios:
Scenario 1 (Aggressive Bullish): BTC continues upward from the current level and breaks above resistance toward the 106,447 target.
Scenario 2 (Retracement Bullish): BTC dips to the new support or even into the buying zone (86–88k), then rebounds to reach the same targets.
Mr SMC Trading point
---
Idea Summary:
The chart suggests bullish continuation, with potential pullbacks into strong demand zones. It supports both breakout and retracement entries, with targets at 99,632 and 106,447. If price holds above EMA 200 and RSI remains supportive, the upside thesis remains valid.
Pales support boost 🚀 analysis follow)

BTCUSD BULLISH SUSTAINANCE.BTCUSD Trading Signal
Market Sentiment: The market is currently experiencing a price surge following a strong rally throughout April. Bitcoin has shown positive momentum and remains in a clear ascending market structure.
Key Levels:
Resistance: $92,000 (broken)
First Target: $95,750
Final Target: $97,800
Technical Overview:
Bitcoin continues its upward movement, supported by strong volume and higher highs. Moving averages point to a strengthening market, with momentum indicators confirming an ongoing bull run. Traders may consider entering on pullbacks or confirmed breakouts above $95,750.

BREAKING NEWS - India launches missile attack on Pakistan
🚨MartyBoots here , I have been trading for 17 years and sharing my thoughts on btc here..
🚨
BTC is a geopolitical asset

BTC SHORT TERM FOLLOW UP BE SURE TO BUY AT 89-91k"Last alert for the dip — this is a follow-up to my initial analysis on the short-term period."

“BTC 4H Chart: Eye on $91,247 Support After Local Resistance”The BTCUSDT 4H chart shows a strong uptrend, but price is now facing resistance. If the trendline breaks, the $91,000 support zone becomes a key level to watch. Is this just a pullback or the start of a bigger correction?
🔍 Key Levels:
Resistance: $97,000
Support Zones: $95,000 & $91,000
Trendline Decision: Watch the 4H candle close for confirmation.
🧠 Strategy:
Wait for a pullback or go long on a confirmed bounce — both setups are possible. Follow price action closely and trade smart.

BTC/USDTI think Bitcoin is heading toward $107,000 — enough with all these fluctuations and corrections already! What do you think, should we buckle up?

New Bitcoin ATH Incoming? Key Bullish Signals & Decoupling AnalyBitcoin at the Precipice: Analyzing the Confluence of Bullish Signals, Decoupling Dynamics, and the Looming Question of a New All-Time High
The cryptocurrency market, and Bitcoin in particular, exists in a perpetual state of flux, analysis, and fervent speculation. In recent weeks and months, a compelling narrative has begun to coalesce, woven from disparate threads of technical indicators, on-chain data, market dynamics, and historical parallels. Bitcoin, after a period of consolidation and correction, appears to be sending signals that have historically preceded significant upward movements. Analysts are pointing to specific indicators flashing green, a potential local bottom seems confirmed, and intriguing shifts are occurring in mining difficulty and Bitcoin's relationship with the wider altcoin market. All this culminates in the tantalizing question echoing across trading desks and social media: Is a new Bitcoin All-Time High (ATH) incoming, perhaps even within the next year?
This article delves deep into the multifaceted factors fueling this speculation. We will dissect the analyst flags suggesting a major rally, examine the evidence for a confirmed local bottom, explore the significant decoupling of Bitcoin from altcoins, analyze the implications of the shifting mining difficulty, evaluate the compelling comparison to Gold's historical breakout, and assess the technical picture presented by indicators like the Stochastic RSI and Taker Buy/Sell ratio. By synthesizing these elements, we aim to provide a comprehensive overview of the forces currently shaping Bitcoin's trajectory and the arguments underpinning the bullish outlook for a potential new ATH, possibly targeting Q2 2025.
Part 1: Reading the Tea Leaves – Indicators Flagging a Potential Rally
Experienced market analysts often rely on a combination of technical and on-chain indicators to gauge market sentiment and predict future price movements. Recently, several reports have highlighted specific indicators whose current state mirrors conditions observed just before previous major Bitcoin bull runs. While the exact proprietary indicators used by every analyst vary, common themes emerge:
• On-Chain Metrics: These look at the activity happening directly on the Bitcoin blockchain. Key metrics often cited include:
o Supply Dynamics: Tracking the amount of Bitcoin held by long-term holders versus short-term speculators. An increase in long-term holding often suggests accumulation and reduced selling pressure. Metrics like "Supply Last Active 1+ Years Ago" reaching high levels can indicate strong conviction among holders.
o Network Activity: While not always a direct price predictor, sustained growth in active addresses or transaction counts can signal underlying adoption and utility growth.
o Profit/Loss Indicators: Metrics like Net Unrealized Profit/Loss (NUPL) or Spent Output Profit Ratio (SOPR) help gauge whether the market is overheated or potentially finding a bottom. A shift from capitulation (heavy losses) towards profitability can be a bullish sign.
• Technical Indicators: These are derived from price and volume data.
o Moving Averages: Crossovers of key moving averages (e.g., the 50-day moving average crossing above the 200-day moving average, known as a "Golden Cross") are classic bullish signals for many traders. The positioning of price relative to these averages is also crucial.
o Momentum Oscillators: Indicators like the Relative Strength Index (RSI) and the Moving Average Convergence Divergence (MACD) measure the speed and change of price movements. Emerging from oversold conditions or showing bullish divergences can signal strengthening momentum.
• Market Sentiment Indicators: While harder to quantify, tools analyzing social media sentiment, futures market positioning (funding rates, open interest), and options market data (put/call ratios) can provide clues about the prevailing mood among traders.
The core argument presented by analysts is that a confluence of these diverse indicators, many of which have strong historical track records in predicting Bitcoin rallies, are simultaneously aligning in a bullish formation. It's not just one signal, but a pattern across multiple datasets suggesting that the groundwork for a significant upward move is being laid. This historical resonance provides a powerful argument for those anticipating a break towards previous highs.
Part 2: The Confirmed Local Bottom – Building a Foundation for Growth?
Complementing the forward-looking indicators is the assertion that Bitcoin has successfully established a "local bottom." This implies that a recent period of price decline has concluded, and a new support level has been found from which price can potentially rebound. Confirmation of a bottom is often a multi-step process:
1. Price Action: A clear cessation of the downtrend, often marked by a specific low point that holds despite retests. This might involve candlestick patterns indicating reversal (like hammers or engulfing patterns) or the formation of a sideways consolidation range after a fall.
2. Volume: Capitulation volume (a spike in selling volume near the low) followed by declining volume during consolidation, and then potentially increasing volume on upward moves, can support the idea of a bottom.
3. Indicator Confirmation: Technical indicators like the RSI moving out of oversold territory (<30) or MACD showing a bullish crossover below the zero line often accompany bottom formations.
4. Holding Key Support: The price successfully defending a significant historical support level or a key Fibonacci retracement level adds weight to the bottoming argument.
The claim that "all indicators flash bullish" in conjunction with a confirmed local bottom suggests a powerful technical setup. It implies that the selling pressure that drove the price down has exhausted itself, buyers are stepping back in at these levels, and multiple technical measures are signaling renewed upward momentum. Establishing a firm bottom is crucial; without it, any rally attempt could be short-lived. This confirmed base provides psychological reassurance to bulls and a defined level for risk management (placing stop-losses below the confirmed low). The question then shifts from "Will it stop falling?" to "Where is the price headed next?"
Part 3: The Great Crypto Decoupling – Bitcoin Forges Its Own Path
One of the most significant market structure shifts observed over the past year is the growing divergence between Bitcoin and the broader altcoin market. Historically, Bitcoin often acted as the tide lifting all crypto boats; when Bitcoin rallied, altcoins typically followed, often with even greater percentage gains (and vice-versa). However, recent data points to a stark change:
• Record Market Cap Gap: The difference in total market capitalization between Bitcoin and the entire altcoin sector has reportedly reached its largest point ever. This signifies that capital inflows are disproportionately favoring Bitcoin.
• Performance Divergence: While Bitcoin has made significant strides, reclaiming substantial portions of its previous losses and challenging key resistance levels, many altcoins have lagged considerably. Some have even continued to trend downwards relative to both the US Dollar and Bitcoin itself.
• Shift from Tandem Movement: The lockstep correlation that characterized previous cycles appears broken, or at least significantly weakened. Bitcoin is charting a course influenced more by its own specific drivers than by the general sentiment across the entire crypto asset class.
•
Several factors likely contribute to this decoupling:
• Institutional Adoption & ETFs: The launch and success of spot Bitcoin ETFs in the US (and similar products elsewhere) have provided a regulated, accessible channel for institutional capital to flow directly into Bitcoin. This capital is often focused solely on Bitcoin as a digital store of value or portfolio diversifier, largely ignoring the more speculative altcoin market.
• Narrative Strength: Bitcoin's core narrative as "digital gold" – a decentralized, scarce, censorship-resistant store of value – has gained traction, particularly in environments of macroeconomic uncertainty or inflation concerns. This narrative is unique to Bitcoin and doesn't necessarily extend to most altcoins, which often have different value propositions (utility tokens, DeFi platforms, etc.).
• Regulatory Clarity (Relative): While regulatory landscapes are still evolving globally, Bitcoin generally enjoys a greater degree of regulatory clarity (often classified as a commodity in key jurisdictions like the US) compared to many altcoins, which face ongoing scrutiny regarding their potential classification as securities. This perceived lower regulatory risk can make Bitcoin more attractive to cautious investors.
• Flight to Quality: During periods of market uncertainty or following negative events within the broader crypto space (like exchange collapses or protocol exploits), investors may rotate capital from riskier altcoins into the perceived safety and established network effect of Bitcoin.
•
This decoupling has profound implications. For investors, it means diversification within the crypto space is becoming more complex; owning altcoins is no longer a guaranteed way to amplify Bitcoin's gains. For Bitcoin, it suggests a maturation of its asset class status, attracting capital based on its unique properties rather than just general crypto market sentiment. This potentially makes Bitcoin's price action more robust and less susceptible to negative developments in obscure corners of the altcoin market.
Part 4: Mining Difficulty Adjustment – A Breather for the Network's Backbone
The Bitcoin network's health and security rely on miners who dedicate vast computational power to validating transactions and adding new blocks to the blockchain. The "Difficulty" is a crucial network parameter that automatically adjusts roughly every two weeks (every 2016 blocks) to ensure that new blocks are found, on average, every 10 minutes, regardless of how much total mining power (hash rate) is connected to the network.
• How it Works: If blocks are being found too quickly (more hash rate online), the difficulty increases, making it harder to find the next block. If blocks are being found too slowly (hash rate has dropped), the difficulty decreases, making it easier.
• Recent Trend: The report notes that difficulty had increased in the four previous adjustments, indicating a sustained rise in the total hash rate competing on the network.
• Expected Drop: Now, on-chain data forecasts an almost 5% drop in difficulty for the upcoming adjustment. This implies that a noticeable amount of hash rate has recently come offline.
•
Why might hash rate decrease, leading to a difficulty drop?
• Profitability Squeeze: Mining profitability is determined by the price of Bitcoin, the miner's electricity costs, the efficiency of their mining hardware (ASICs), and the current network difficulty. If Bitcoin's price stagnates or drops while difficulty remains high (or energy costs rise), less efficient miners or those with higher operating costs may become unprofitable and shut down their rigs.
• Hardware Cycles: Older generation ASICs become obsolete as newer, more efficient models are released. A difficulty drop might reflect a temporary lull before newer hardware is fully deployed or older hardware being permanently retired.
• External Factors: Regional energy price fluctuations, regulatory changes affecting mining operations in certain areas, or even extreme weather events impacting large mining facilities can temporarily reduce the global hash rate.
What are the implications of a difficulty drop?
• A Break for Miners: For the remaining miners, a lower difficulty means they have a slightly higher chance of finding the next block with the same amount of hash power. This can improve their profitability, potentially reducing the need for them to sell mined Bitcoin immediately to cover operational expenses. Reduced selling pressure from miners is generally considered a positive market factor.
• Network Self-Regulation: It demonstrates the robustness of Bitcoin's design – the network automatically adjusts to maintain its target block time, ensuring consistent transaction processing regardless of fluctuations in mining participation.
• Not Necessarily Bearish: While a significant drop could signal miner capitulation in a deep bear market, a moderate drop after a period of sustained increases might simply be a healthy cooldown or consolidation phase in hash rate growth, allowing the ecosystem to adjust.
This expected difficulty drop, therefore, provides a welcome respite for miners, potentially easing selling pressure and showcasing the network's adaptive capabilities.
Part 5: Technical Signals and Historical Echoes – Stochastic RSI, Taker Ratio, and the Gold Fractal
Beyond the broader indicators and market dynamics, specific technical signals and historical chart patterns are adding fuel to the bullish fire:
• Bitcoin Stochastic RSI: The Stochastic RSI is a momentum indicator that uses RSI values (rather than price) within a stochastic oscillator formula. It ranges between 0 and 100 and is used to identify overbought and oversold conditions, but often more effectively in identifying strengthening momentum. A signal suggesting "brewing bullish momentum" likely means the Stochastic RSI is rising from oversold levels or showing a bullish crossover, indicating that underlying momentum (as measured by RSI) is accelerating upwards. Such signals often precede periods of strong price appreciation.
• Taker Buy/Sell Ratio (Binance): This ratio measures the aggression of buyers versus sellers executing market orders (takers) on a specific exchange (in this case, Binance, a major hub for crypto trading). A "sharp increase" in the Taker Buy Ratio (or Buy/Sell Ratio) signifies that buyers are aggressively hitting the ask price to acquire Bitcoin, willing to pay the market price rather than waiting for their limit orders to be filled. This indicates strong immediate demand and buying pressure, often interpreted as a bullish signal suggesting conviction among buyers.
• Bitcoin Mirroring Gold's Breakout Structure: This is a fascinating observation based on fractal analysis – the idea that chart patterns can repeat themselves across different time scales and different assets. The claim is that Bitcoin's current price structure (consolidation patterns, corrections, subsequent recovery) closely resembles the structure Gold exhibited before one of its major historical breakouts. If this fractal pattern holds true, it suggests Bitcoin might be in the final stages of consolidation before a significant upward move, mirroring Gold's past trajectory. This analysis leads to the specific, albeit highly speculative, prediction of a potential new ATH occurring in Q2 2025. While historical parallels are not guarantees, they provide a compelling narrative and roadmap for traders looking for historical context.
• Sandwiched Between Support & Resistance: This describes the immediate technical battleground. Bitcoin's price is currently caught in a range defined by a significant support level below (a price floor where buying interest has previously emerged) and a major resistance level above (a price ceiling where selling pressure has previously intensified). The outcome of this battle is critical. Can the bulls, bolstered by the positive indicators and dynamics discussed, muster enough strength to break decisively above resistance? Or will the bears successfully defend that level, potentially leading to another rejection or further consolidation? This price zone represents the current line in the sand.
Part 6: Synthesis and Outlook – Weighing the Evidence for a New ATH
Synthesizing these diverse factors paints a complex but potentially bullish picture for Bitcoin:
• The Bullish Case: Multiple historically reliable indicators are signaling conditions that preceded past rallies. A local bottom appears confirmed, providing a stable base. Bitcoin is increasingly decoupling from the riskier altcoin market, potentially attracting more focused institutional capital via ETFs. A looming drop in mining difficulty could ease selling pressure from miners. Specific technical indicators like the Stochastic RSI and Taker Buy/Sell Ratio point towards growing buying momentum and aggression. Furthermore, a compelling (though speculative) historical parallel with Gold's breakout structure offers a potential roadmap towards a new ATH, perhaps by Q2 2025.
• The Hurdles and Risks: Despite the bullish signals, significant resistance levels lie ahead, representing areas where sellers have previously overwhelmed buyers. Macroeconomic uncertainty (inflation, interest rates, geopolitical events) can always impact risk assets like Bitcoin. Regulatory developments, while potentially clarifying for Bitcoin, remain a source of potential volatility. The crypto market is inherently volatile, and unforeseen events ("black swans") can rapidly alter market sentiment. The Gold fractal is a historical observation, not a guarantee.
Conclusion:
Bitcoin currently stands at a fascinating juncture. The confluence of bullish indicators flagged by analysts, the apparent confirmation of a local bottom, the significant decoupling from altcoins driven partly by institutional flows, the potential easing of pressure on miners via a difficulty drop, and specific technical signals like the Stochastic RSI and Taker Buy Ratio collectively build a strong case for optimism. The comparison to Gold's historical breakout adds another layer of intrigue, offering a specific (though speculative) timeline for a potential new All-Time High.
However, optimism must be tempered with caution. Major resistance levels loom large, representing the immediate challenge for bulls. The broader macroeconomic and regulatory environments remain key variables. While the indicators suggest brewing momentum and historical patterns offer encouraging parallels, breaking through established resistance and embarking on a sustained rally towards a new ATH is never a certainty in the volatile world of cryptocurrency.
The coming weeks and months will be crucial in determining whether the bullish signals translate into decisive price action. Can the bulls overcome the resistance that currently sandwiches the price? Will the decoupling trend continue to funnel capital into Bitcoin? Will the mining landscape stabilize favorably? The answers to these questions will likely determine if the whispers of an incoming ATH, potentially mirroring Gold's path towards Q2 2025, become a roar or fade back into the market noise. The stage seems set, the indicators are aligning, but the final act is yet to be written.

BTC IT'S TIME TO ...Hello friends
Due to the entry of buyers and the breakdown of the trading range, we can open a buy position in the direction of the trend and with capital and risk management.
*Trade safely with us*

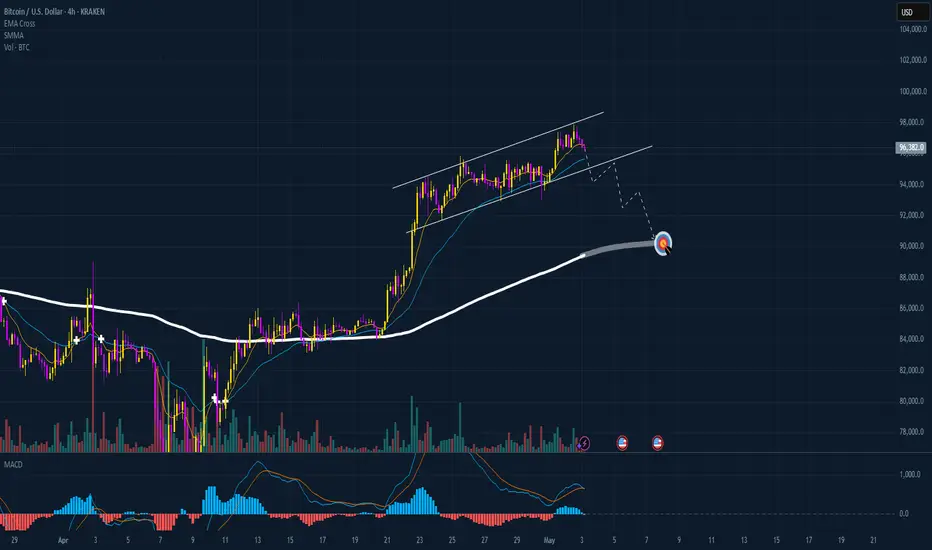
BTC HAVE A HIGH PROBABILITY TO FALL DOWN!!!The BTC starts looking weak and it's perfect time to long for a short. We are almost at the top of this run from last weeks and we can see that BTC made a perfect divergence pattern. My indicator shows me also that we are entering a mid-term bearish trend and there is a high chance that we are gonna fall much deeper than in last weeks. My target is clear and I'm holding my strategy so I wait for the price to hit my SMA line like it was in the last days but now I wait for the price to hit the SMA line at 4H chart because we didn't hit it since 2 weeks so in this moment we can see even in a few candles that the price is gonna touch it. I am actually in the short and waiting for the price to go for my target, we also have a weekend so the price will be probably slow but everything can happen. In my opinion next week are gonna be red and the price should touch my target. I recommend to watch a 1H and 2H chart and looking when price will hit the SMA line on these timeframes because my target is set in a 4H chart but we can book profits even when the price will hit the SMA at 1H and at 2H chart. Be careful and stay focused.
$100k Bitcoin IMMINENT? Price Ignites After Major Surge!The cryptocurrency market is once again crackling with energy, and at the heart of the storm stands Bitcoin (BTC). The world's largest and original cryptocurrency is staging a remarkable comeback, shattering recent resistance levels and reigniting fervent speculation about its potential to not only revisit but decisively conquer the psychologically potent $100,000 milestone. Following a period of consolidation and downward pressure, a powerful surge has propelled Bitcoin to its highest price point in over ten weeks, signaling a potential paradigm shift in market sentiment and trading behavior.
The Breakout: Shaking Off Recent Slumber
The recent price action has been decisive. Bitcoin climbed as much as 3.1% to achieve a weekly high of $97,483. This marks the most robust price level observed since February 21st, representing a significant break from the sideways and sometimes downward trajectory that characterized parts of the preceding weeks. The memory of Bitcoin crossing the $100,000 threshold on February 7th is still fresh, adding weight to the current push towards that level.
This upward momentum provides a stark contrast to the market conditions seen earlier. There is downward pressure attributed to geopolitical factors and economic policies, such as potential tariff implementations, which had previously triggered sell-offs impacting both traditional stock markets and the digital asset space. Furthermore, the market had to digest a significant correction following Bitcoin's earlier peak. While the specifics of past peaks can be debated based on different exchange data, the narrative of a significant pullback followed by the current strong recovery is clear. Bitcoin weathered a period where it seemed momentum might stall, but the bulls have evidently returned with renewed vigor.
Shifting Market Dynamics: From Macro-Driven to Momentum-Fueled
Perhaps one of the most crucial insights from the current rally is the apparent shift in what's driving price action. For much of the past year or two, Bitcoin's price movements often seemed heavily correlated with macroeconomic factors – inflation data releases, central bank interest rate decisions, geopolitical tensions, and regulatory pronouncements. While these factors undoubtedly still play a role, the current surge suggests a transition towards a market more heavily influenced by internal dynamics: spot market demand and trading momentum.
There are traders who are increasingly reacting to price action itself, buying into strength and potentially creating a self-reinforcing cycle. The focus is less on predicting the next Federal Reserve move and more on the immediate supply and demand dynamics visible on exchanges.
Bitcoin isn't entirely decoupled from macro trends, but its internal market structure, particularly the influence of new financial instruments like ETFs and strong spot buying, is asserting greater influence on short-to-medium term price discovery.
The ETF Factor: Opening the Floodgates for Capital
The launch and subsequent success of spot Bitcoin ETFs in the United States have been a game-changer, and their impact is arguably a primary catalyst for the current bullishness. These regulated investment vehicles provide traditional investors and institutions with a familiar and accessible way to gain exposure to Bitcoin without directly holding the underlying asset. The result has been a torrent of new capital flowing into the market.
There has been a staggering inflow of over $3.2 billion entering Bitcoin and Ethereum tracking ETFs in the preceding week alone. BlackRock's Bitcoin Trust ETF (IBIT), a major player in the space, recorded nearly $1.5 billion in inflows during that period, marking its highest weekly intake for the year according to Bloomberg data.
These inflows are not just numbers on a spreadsheet; they translate directly into buying pressure in the spot market. ETF issuers must purchase actual Bitcoin to back the shares they issue to investors. This sustained, large-scale buying provides a powerful tailwind for the price, absorbing sell orders and driving the market upwards. The success of these ETFs also lends legitimacy to Bitcoin as an asset class, potentially encouraging further adoption and investment from previously hesitant institutional players. The "demand" aspect of the current rally is heavily underpinned by this ongoing ETF phenomenon.
Options Market Signals: Betting Big on $100,000
Further evidence of the bullish sentiment surrounding Bitcoin, particularly the $100,000 target, comes from the derivatives market, specifically options trading. Options contracts give traders the right, but not the obligation, to buy (call option) or sell (put option) an asset at a specific price (strike price) before a certain expiration date.
According to data from Coinglass and the major crypto options exchange Deribit, demand for upside options has surged. Notably, call options with a $100,000 strike price exhibit the most significant open interest across various expiration dates. Open interest represents the total number of outstanding contracts that have not yet been settled. High open interest in $100k call options indicates that a large number of traders are positioning themselves to profit from Bitcoin reaching or exceeding this level. While options data reflects expectations rather than guarantees, such concentrated betting on a specific upside target underscores the powerful psychological pull of the $100k mark and the conviction held by a significant segment of the market.
Warming Up: Reading the Technical and On-Chain Pre-Rally Signals
Beyond the ETF flows and options market sentiment, analysts are pointing to various technical and on-chain indicators suggesting Bitcoin is indeed "warming up" for a potentially larger move, exhibiting signals seen before previous major breakouts. This aligns with the theme of "Bitcoin Flashing Pre-Rally Signals Seen Before Major 2024 Breakouts."
• Technical Analysis:
o Breaking Resistance: The surge above the 10-week high ($97,483) was a critical technical breakout, overcoming a level that had previously capped price advances. Holding above this level turns former resistance into potential support.
o Moving Averages: Traders watch moving averages closely. A "Golden Cross" (where a shorter-term moving average, like the 50-day, crosses above a longer-term one, like the 200-day) is often considered a strong long-term bullish signal. While specific configurations vary, bullish alignment of key moving averages often precedes sustained rallies.
o Momentum Indicators: Indicators like the Relative Strength Index (RSI) and Moving Average Convergence Divergence (MACD) can signal building momentum. An RSI breaking above key levels without yet reaching extremely overbought territory, or a bullish MACD crossover, can suggest further upside potential.
o Volume Confirmation: Crucially, significant price breakouts should ideally be accompanied by strong trading volume, indicating conviction behind the move. Analysts look for volume confirmation to validate the strength of the rally.
• On-Chain Analysis: On-chain data provides insights into the behavior of Bitcoin holders and network activity.
o Exchange Outflows: Sustained periods where more Bitcoin is withdrawn from exchanges than deposited often suggest investors are moving coins to private wallets for long-term holding ("HODLing"), reducing the immediately available supply for sale.
o Accumulation Trends: Metrics tracking the behavior of large holders ("whales") and long-term holders can reveal accumulation patterns. Increased buying from these cohorts is typically seen as bullish.
o Supply Dynamics: Indicators looking at the supply held by short-term versus long-term holders, or metrics like the Long-Term Holder Spent Output Profit Ratio (LTH-SOPR), can gauge whether significant profit-taking is occurring that could stall a rally. A low LTH-SOPR might suggest long-term holders are not yet selling aggressively.
o Funding Rates: In the perpetual futures market, positive funding rates generally indicate that traders holding long positions are paying those holding short positions, suggesting a bullish bias in the derivatives space.
When multiple technical and on-chain indicators align, as some analysts suggest is happening now, it builds a stronger case that the market is preparing for a significant move, lending credence to the "pre-rally signals" narrative.
Mapping the Path to $100k and Beyond: Three Potential Scenarios
While the current momentum is palpable, the path forward is never certain. Analysts are mapping various possibilities, acknowledging both the bullish potential and the inherent risks. Here are three broad scenarios that could unfold:
1. The Momentum Continuation Scenario: Fueled by continued strong ETF inflows, positive market sentiment amplified by the $100k narrative, and potentially favorable (or at least neutral) macroeconomic developments, Bitcoin continues its ascent relatively unimpeded. It decisively breaks the $100,000 barrier, potentially triggering a wave of Fear Of Missing Out (FOMO) from retail investors and further institutional interest. In this scenario, the market quickly looks towards higher targets, exploring price discovery in uncharted territory above $100k (or above its previous ATH depending on the data source used). Key challenges would be maintaining buying pressure and overcoming psychological resistance levels beyond $100k.
2. The Consolidation and Recharge Scenario: Bitcoin's rally meets significant resistance near or just below the $100,000 level. Profit-taking increases, and early ETF buyers might look to secure gains. Instead of a sharp rejection, the price enters a period of consolidation – trading sideways within a defined range or experiencing a moderate pullback. This phase allows the market to digest recent gains, build a stronger base of support (potentially around the recent breakout level near GETTEX:97K or slightly lower), and allows moving averages to catch up. If support holds and buying demand re-emerges (perhaps triggered by fresh ETF inflows or positive news), this consolidation could form the launchpad for the next sustained leg up towards and beyond $100k. This scenario tests the resilience of the buyers.
3. The Macro Headwind or Correction Scenario: Despite the strong internal dynamics, external factors reassert control. An unexpected negative catalyst emerges – perhaps significantly worse-than-expected inflation data forcing a hawkish central bank response, a major geopolitical escalation, unforeseen regulatory action against crypto, or a sharp downturn in traditional markets triggering widespread risk-off sentiment. Alternatively, the rally could simply run out of steam, hitting a "sell wall" at $100k that overwhelms buying pressure, leading to a sharper correction back towards lower support levels ($90k, $85k, or even lower). This scenario underscores the ever-present volatility and risk in the crypto market, reminding investors that parabolic runs can face abrupt reversals.
The Crucial Question: Can BTC Buying Demand Meet the Challenge?
Ultimately, whether Bitcoin successfully retests and surpasses $100,000 hinges on the sustainability of the current buying demand. Several factors support continued demand:
• Ongoing ETF Flows: As long as institutions and retail investors continue allocating capital to spot Bitcoin ETFs, this provides a consistent source of buying pressure.
• Growing Adoption Narrative: Each price surge and new institutional product launch reinforces the narrative of Bitcoin's growing acceptance and potential role as a store of value or portfolio diversifier.
• Halving Effect (Long-Term): While the Bitcoin Halving (reduction in new supply issuance) is a past event, its long-term supply-constricting effects are believed by many to contribute to price appreciation over time.
• Potential Retail FOMO: A decisive break above $100k could capture mainstream media attention and trigger a wave of buying from retail investors fearing they might miss out on further gains.
However, potential headwinds exist:
• Profit-Taking: Investors who bought at lower levels, including early ETF participants, may look to lock in substantial profits as the price approaches major milestones.
• Regulatory Uncertainty: While ETFs marked progress, the broader regulatory landscape for crypto remains complex and subject to change globally.
• Macroeconomic Risks: Inflation, interest rates, and potential recessionary fears haven't disappeared and could resurface to dampen risk appetite.
• Market Saturation/Exhaustion: Rallies can lose momentum if buying power becomes exhausted without fresh catalysts.
The interplay between these forces will determine if the current buying wave has the strength and endurance to overcome sell pressure and propel Bitcoin into six-figure territory sustainably.
Conclusion: A Critical Juncture for Bitcoin
Bitcoin stands at a fascinating and potentially pivotal juncture. The recent surge, breaking a 10-week high and pushing towards the $100,000 horizon, is fueled by a powerful combination of factors unlike those seen in previous cycles. The institutional validation and massive capital inflows brought by spot Bitcoin ETFs represent a fundamental shift, seemingly driving a transition towards momentum and spot-demand-based trading. Bullish signals from the options market and various technical/on-chain indicators add fuel to the fire, painting a picture of a market "warming up" for potentially significant further gains.
Yet, the path to $100,000 and beyond is fraught with challenges. Market history teaches that parabolic advances often face corrections, and the ever-present risks of macroeconomic shifts and regulatory developments cannot be ignored. The sustainability of the current buying frenzy, particularly the crucial ETF inflows, will be rigorously tested as Bitcoin confronts the immense psychological and technical resistance clustered around the six-figure mark.
Whether Bitcoin achieves a swift breakout, undergoes a period of consolidation, or faces a pullback remains to be seen. However, the current price action and underlying market dynamics have undeniably reignited excitement and placed the $100,000 target firmly back in the spotlight, marking a critical chapter in Bitcoin's ongoing evolution within the global financial ecosystem. Investors and observers alike will be watching intently to see if the current surge has the power to meet the demand challenge and etch a new all-time high into the history books.
Disclaimer: The information presented in this article is for informational and educational purposes only. It is based on the analysis of the provided source material and general market knowledge. It does not constitute financial advice. Investing in cryptocurrencies involves significant risk, including the potential loss of principal. Readers should conduct their own thorough research and consult with a qualified financial advisor before making any investment decisions.

#BTC/USDT Update. Bitcoin is currently trading around a key resistance zone.
The immediate support lies near $95,554, while a confirmed breakout above $97,300 could trigger an uptrend toward $104,000.
Until then, trade with caution.
DYOR. NFA.

BTC DOMINANCEBitcoin dominance could break down at this point, potentially signaling the start of an exceptional altseason.

Bitcoin Monthly TargetsBitcoin BTC 4-year cycle is set to conclude within the golden ratios, using both the 2010 and 2022 lows as reference points. Based on historical patterns, the projected target range is 127K - 143K, aligning with previous cycle behavior.

NZDJPY DETAILED ANALYSIS TECHNICAL AND FUNDAMENTALS NZDJPY is currently trading near 85.80, forming a textbook falling wedge pattern on the daily chart. This structure typically signals a bullish reversal, and price action is nearing the apex, suggesting an imminent breakout. A confirmed breakout above the upper trendline could initiate a strong bullish wave, with a medium-term target set at 95.000.
Fundamentally, the New Zealand dollar is supported by expectations of stable monetary policy from the Reserve Bank of New Zealand, while the Japanese yen faces pressure due to the Bank of Japan's continued dovish stance. This divergence in monetary policies favors NZD strength against JPY, aligning with the bullish technical setup.
Technical indicators, including the Relative Strength Index (RSI) and Moving Average Convergence Divergence (MACD), are showing signs of bullish momentum. A decisive close above the wedge's resistance line would confirm the breakout, potentially attracting further buying interest and accelerating the move toward the 95.000 target.
In summary, NZDJPY is poised for a bullish breakout from the falling wedge pattern, supported by both technical and fundamental factors. Traders should monitor for a confirmed breakout and consider positioning accordingly to capitalize on the anticipated upward movement.
