BTC/USD Long Setup – Bounce from Demand Zone Towards $80K TargetKey Zones
Demand Zone (Buy Zone)
🔵 $74,250 – $75,000
Strong support area
Buyers previously stepped in here
Marked for potential entry
Resistance Zone
🟣 $77,300 – $77,600
Mid-level resistance
Could cause a short pullback
Watch for breakout or rejection
Target Point
🎯 $80,273.49
Potential upside: +6.68% gain
Previous supply/structure zone
Take Profit (TP) zone
Stop Loss
⛔ $74,247.07
Just below the demand zone
Protects against invalid setup
Trade Idea
1. 🔽 Price expected to drop into demand zone
2. 🔄 Wait for bullish confirmation (e.g. bounce or engulfing candle)
3. 📈 Enter long position near $75,000
4. ⬆️ Ride it up through resistance
5. ✅ Target = $80,273 | ❌ Stop = $74,247
Btcupdate

Bitcoin Is About To SkyrocketHello, Skyrexians!
It looks like BINANCE:BTCUSDT has finally finished its correction. On the daily time frame we have the confirmation, now we are waiting for weekly close to make sure. With our prediction next wave to the upside is going to be the altcoin season wave, a lot of negative around the Trump's tariffs also confirms that.
Let's take a look at the weekly chart and remember our global forecast. The wave which has been finished in March 2024 was just a wave 1. Now price is printing wave 3. Notice that the minimal target for the wave 3 has been completed. This is the Fibonacci 1 level. Even if wave 3 has been already finished we will see higher high in the wave 5. But the main scenario is that this wave will be finished at 1.61 Fibonacci level, approximately at $140k. Anyway we will see which scenario market choose when Bitcoin will breaks $110k. Now we want to see the confirmation on the weekly by the green dot on Bullish/Bearish Reversal Bar Indicator .
Best regards,
Skyrexio Team
___________________________________________________________
Please, boost this article and subscribe our page if you like analysis!

BTC/USD Bullish Breakout Setup – Targeting $85,477 with 5.62% UpThe price has recently surged above both the 30 EMA (red) and 200 EMA (blue), signaling a strong bullish move.
The EMAs are beginning to turn upward, particularly the 30 EMA, suggesting short-term bullish momentum.
Key Levels Identified
Entry Zone (Purple Support Zone):
Around $80,105 – a potential buy zone after a pullback.
Labeled with STOP LOSS, indicating the invalidation level if price drops below this zone.
Target Zone (Purple Resistance Zone):
Around $85,477 – this is the target level, marked as “EA TARGET POINT”.
Offers a potential move of +5.62% or 4,551.83 points.
Price Action
Price broke above a previous resistance (now support) and has pulled back slightly.
The projected move suggests a bullish continuation after a minor pullback and consolidation.
Risk-Reward
Good risk-reward ratio implied with the large gap between the stop loss and target.
Stop loss is tight, just below the purple support zone (~$80,105).
Projection
The blue lines and annotations suggest a bullish play, with an expected upward movement after retesting the support.
✅ Possible Trade Idea
Buy Zone: ~$80,105 (on a confirmed retest)
Stop Loss: Slightly below $80,105
Target: ~$85,477
Expected Move: +5.62%
🔍 Additional Notes
Keep an eye on price behavior around the support zone—confirmation (e.g., bullish candle pattern or rejection wick) strengthens the entry.
The strong move leading to the breakout suggests high momentum, which could mean limited pullback.
News or macro developments could invalidate technicals—be aware of external factors.

Is Bitcoin holding up or sell-off coming soon?CME:BTC1!
Surprisingly, the price of bitcoin and bitcoin futures have held up well compared to stocks given that Bitcoin is a high risk, highly volatile crypto currency.
It is almost as if hedge funds, and other investors have not had to liquidate their BTC exposure due to margin calls.
Open Interest has been stable and average daily volume is holding up. This can be viewed by accessing the CME Bitcoin Open Interest and Volume .
What is next for Bitcoin futures?
As noted in our analysis, CME bitcoin futures are currently trading below the key level 2024 mid-range.
Key Levels:
2024 Mid-Range, Key LIS: 79655
2024 till YTD CVPOC: 71705
Support Zone: 63140 - 57275
2024 till YT CVAL: 57275
Scenario 1: Further Downside - technical breakdown
We expect further downside and move towards our support zone marked on the chart. Enter short on a pull back towards mid-range with stops above high of Apr 3rd, 2025.
Example Trade 1:
• Short Entry: 79000
• Stop: 85240
• Target: 60000
• Risk: 6240
• Reward: 22000
• Risk/Reward Ratio: ~ 3R
Scenario 2: Reclaim mid-range and consolidate
In this scenario, if the price gets back above 2024 mid-range and stays above, we expect the price to range between 90K to 80K.
Example Trade 2:
• Long Entry: 80000
• Stop: 74630
• Target: 89000
• Risk: 5370
• Reward: 9000
• Risk/Reward Ratio: ~ 1.68 R
Important Notes:
• These are example trade ideas not intended to be a recommendation to trade, and traders are encouraged to do their own analysis and preparation before entering any positions.
• Stop losses are not guaranteed to trigger at specified levels, and actual losses may exceed predetermined stop levels.
• NFA does not have regulatory oversight over spot cryptocurrencies or virtual currencies derivatives traded on unregulated/decentralized exchanges.
Glossary Index for all technical terms used:
YTD: Year to Date
LIS: Line in Sand
CVPOC: Composite Volume Point of Control
CVAL: Composite Value Area Low
Green Zones: Bull/ Buyers support zones

BTC/USD Long Setup – Bounce from Demand Zone Towards $80K TargetKey Zones
Demand Zone (Buy Zone)
🔵 $74,250 – $75,000
Strong support area
Buyers previously stepped in here
Marked for potential entry
Resistance Zone
🟣 $77,300 – $77,600
Mid-level resistance
Could cause a short pullback
Watch for breakout or rejection
Target Point
🎯 $80,273.49
Potential upside: +6.68% gain
Previous supply/structure zone
Take Profit (TP) zone
Stop Loss
⛔ $74,247.07
Just below the demand zone
Protects against invalid setup
Trade Idea
1. 🔽 Price expected to drop into demand zone
2. 🔄 Wait for bullish confirmation (e.g. bounce or engulfing candle)
3. 📈 Enter long position near $75,000
4. ⬆️ Ride it up through resistance
5. ✅ Target = $80,273 | ❌ Stop = $74,247

BTC at a Critical Inflection Point – Bulls vs. BearsBitcoin is currently trading around $77,644, sitting right between two major trendlines:
🟢 Long-Term Bullish Support – This green ascending trendline has held since late 2023, providing key support throughout BTC’s macro uptrend.
🔴 Medium-Term Bearish Resistance – The red descending trendline has capped price since the 2025 highs, forming a clear structure of lower highs.
We're now at a pivotal confluence zone where these two trendlines intersect. Price recently bounced off the green support, but it's struggling to decisively break above the red resistance.
🔍 Key Scenarios:
✅ Bullish Breakout:
A strong daily close above the red trendline could confirm bullish continuation.
Targets: $84K, GETTEX:92K , and potentially ATH breakout above $100K.
❌ Bearish Rejection:
Rejection at resistance may lead to a retest of the green trendline (~$74K).
A breakdown from there opens the door to GETTEX:64K –$60K, or even deeper pullbacks.

BTC/USD 1H Chart Analysis – Bearish Setup with SBR Rejection🔵 Key Zones & Levels:
🔷 SBR Zone (Support ➡ Resistance):
Price Range: ~$81,000–$83,000
🛑 Stop Loss: $83,002.31 (Just above resistance)
Expecting sellers to step in here if price retests this level
🟠 Mid-Range Zone:
Current price is consolidating just below SBR zone
Could form a lower high before dropping
🟦 Target Zone (Support Area):
🎯 Target Price: ~$75,000
Previous demand area – price bounced hard from here before
🔁 Trade Plan:
📉 Bias: Bearish
📍 Entry: Near current price or after retest of SBR zone
🛑 Stop Loss: $83,002.31
🎯 Target: $75,000 (approx -8.33%)
✅ Summary:
Risk-Reward: Appears solid (R:R > 2:1)
🕵️♂️ Watch for: Fakeouts or rejections in the SBR zone
🔻 Potential Move: -6,804 points if plan plays out

BTC/USDTafter reclaiming the 50-week ema,btc enters acceration.
if it fails to hold,then it's a bear market.

$$$ BTCUSD MACRO-BULLISH $$$ 1W CHART $$$BITFINEX:BTCUSD 1W Chart
There are many reasons to look at this weekly chart and see that there's absolutely no reason to be bearish on Bitcoin yet.
Holding strong r/s flip support.
Holding regression trend.
Holding parabolic trend.
Stoch RSI at the bottom.
Weekly bullish divergence.
Assuming this plays out in a way that's similar to the last local bottom, the current target is around $134k-$135k.
It would take a lot to invalidate all of these bullish indicators, but if that does somehow happen, with a CLOSE of the weekly candle that invalidated these, then It's pretty much definitely over for a loooong time.
NFA blah blah blah..

Bitcoin Technical Breakdown – Bearish Channel in Motionhello guys.
🔻 1. Bearish Channel
Bitcoin is currently respecting a downward-sloping channel with lower highs and lower lows.
Every attempt to break the upper boundary has been met with rejection, confirming bearish pressure.
🔁 2. Retest of Former Trendline
The former ascending trendline (drawn from 2023’s bottom) was broken and recently retested as resistance, failing to flip it back to support.
This retest often signals confirmation of trend reversal.
🧱 3. Critical Support Zone: $62K– FWB:65K
This zone served as a strong accumulation range in the past and aligns with the current downside target.
____________________________
🔮 What’s Next?
Based on this pattern and price behavior:
Bitcoin may continue its bearish descent, following the projected zig-zag pattern in the channel.
The next significant bounce area lies around $64,000, aligning with both volume-based support and previous breakout zones.

BTC Possible buying opportunity Possible buying opportunity if Weekly 50 SMA and Fib level 61.80% hold the price.

Bitcoin Lost 50 SMA overnight, what next ? - still BULLISH.In a week where I am still expecting the beginnings of a bounce, we saw a Major Drop overnight.
This has pushed PA below the 50 SMA that I was hoping PA would bounce off, as it had previously.
So, Whats Next ?
It is not as bad as it may appear but CAUTION is a Very Very good idea.
There are a number of lines of support below and if we do not find any soon, 73K is the next line of Support. then down to 71K and ultimately, the long term line at 64K, though I still doubt we will get that low.
But FEAR is BIG...be a Vulture..Buy the remains of people Fear...Bitcoin IS a Scarce asset and people Still want it.
The Weekly MACD
The MACD is now in the bounce Zone. Yes, it may drop below neutral if this "Tariff Fear" continues. But Technically, We now have the ability to bounce once sentiment turns
On a slightly more bearish side is the fact that Histogram has dived deep and Red. The Bears are biting and has momentum
The RSI Relative Strength Index
Like the MACD, the RSI is now in an area where it has bounced in the past and yet, it can still drop further before we reach Neutral ( 30 line ) . It has to be said, the RSI is a bit behind the MACD in that it has a later date when it could reach Neutral. There is no guarantee that Neutral will hold RSI up....
Other Markets are struggling also
The DXY $ has had a sustained drop but is near an area of support. I am watching this closely.
Normaly, we see DXY and BTC move in opposite directions but we have seen both Recover at the same time, The lines between the teo are getting blurred.
GOLD - has been doing well for some omnths
However, in th elast 2 weeks, Gold has been selling off also and saw a steep drop towards the end of last week. Will be very interesting to see where this goes this week
The fact that Gold was selling, shows that investors were comfortable to leave a safe haven.
Lets see if that changes this weel
Conclusion for BITCOIN HOLDERS
This could all sound a little scary for Bitcoin and it should be taken as a HUGE Warning that we Lost the 50 SMA Support. This does open up the possibility of further drops and it may well happen
We are currently heading towards major support at 73K
This is an area I said we could hit a few weeks back and so I am not in a bad state of mind just yet.
If we Loose 71K, I will get uncomfortable.
The Lower timeframes are very much heading to OVERSOLD and so we shold get some support here and then we wait to see if Fear takes hold further.
This week, we Get the FOMC minutes and then Inflation data coming out of the USA
Thsi could Tip the balance either way, depending on the data
For me, I am NOT Selling Just yet.
I imagine many Short term holders will be and these coins will be snapped back up
We wait to see how today plays out
BUY THE DIP

Bitcoin BTC - Buy The News, Correction Is Almost Over Hello, Skyrexians!
The anticipated move has happened, BINANCE:BTCUSDT has retested the recent low and its dominance continues growing, alts are bleeding. When this nightmare will be finished and do we have any chance to see the reversal now?
Let's take a look at the daily time frame. As we pointed out earlier Bitcoin has printed wave 1 inside larger degree wave 3 and after that dropped in the wave 2. We have already told you 2 times that correction is over when price was next to $77-78, but multiple retests are not forbidden. 0.61 Fibonacci zone is the place where correction can be finished, so it can dump up to $73k. Two facts we need to rely on to find the correction bottom are: bullish divergent bar and the first green column on Awesome oscillator in conjunction with the divergence.
Best regards,
Skyrexio Team
___________________________________________________________
Please, boost this article and subscribe our page if you like analysis!

Bearish Flag, Bitcoin (4H)Bitcoin has broken a bearish flag in medium time frames. If a rebound comes would be an opportuinty to get short positions.
The problem with Bitcoin is not only the bearish flag currently working on. It has a change of character in daily time frame which I posted a lot about it another of my analysis.
I don't think the values of assest is cheap at the moment. In fact, they're about to get cheaper a lot in coming days.
For now, 76400 is looking like a specific target for the main flag formation.
Thanks for reading.

BITCOIN SEEMS TO FOLLOW THIS PATH TOWARDS 120k !!!According to elliott wave count, If BTC has completed it's macro wave (IV), then we can expect it moving to complete it's macro wave (V).
In this case if recently impulse move is counted as micro wave (i), then we can expect reversal from 81-79K region very soon.
Otherwise, if micro count gets Invalid, then reversal can be expected from up to 76-70k .
Important key level is breakout of 95k which would confirm reverse in trend.

btcusd sell scalpingbtcusd sell scaliping
reason is 1hr support touch
so sell side passiblity high change

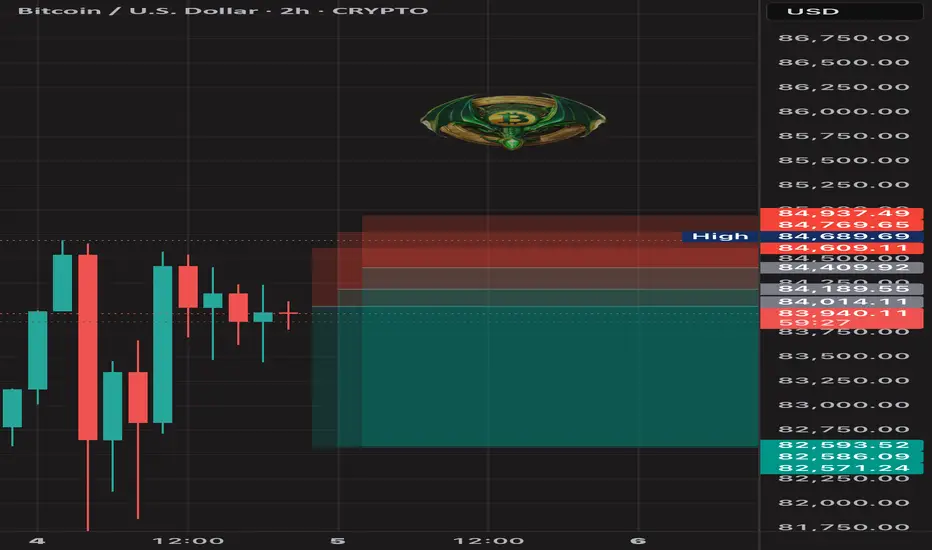
BTC SHORT TP 82,600 04-04-2025🚨 Bitcoin is showing weakness on the lower timeframes, specifically the 1-hour and 2-hour charts, so I'm looking for a short position with a take profit (TP) set at 82,700, giving us a solid 3RR.
You can start entering now and average your position as it develops. Since this analysis is based on the 1-hour timeframe, we should see results within the next 15 to 19 hours. If we run out of time, I'll keep you updated with the latest analysis!
Make sure to follow me to stay in the loop and keep generating those green profits! 💰🔥
Bitcoin Bullish Continuation Towards $128KBTC/USD | 1D Chart | April 2025
📊 Technical Analysis:
Bitcoin is maintaining its bullish structure within a well-defined ascending channel. The price has bounced off the lower trendline (green), which has provided strong support multiple times (see green arrows).
Currently, BTC is consolidating near $83,800, and a breakout from this zone could initiate the next impulsive move towards the midline and upper trendline resistance (~$128,000).
Support Levels: ~$80,000 (trendline)
Resistance Levels: ~$90,000, ~$110,000, and ~$128,000
Bullish Trigger: A confirmed breakout above $90,000 could signal strong continuation
🌍 Fundamental Analysis:
Bitcoin Halving (April 2024): Historically, BTC rallies post-halving due to reduced supply. The next supply shock could fuel a rally.
Institutional Demand: Spot Bitcoin ETFs continue to see record inflows, with firms like BlackRock and Fidelity accumulating BTC aggressively.
Macroeconomic Factors: With inflation concerns persisting, investors are turning to Bitcoin as a hedge, pushing prices higher.
📈 Trade Idea:
Entry: $84,000 (Breakout Confirmation)
Stop Loss: $79,000 (Below Trendline)
Target Range: $110,000 – $128,000 (Channel Resistance)

Bitcoin vs. Nasdaq: BTC Shows Signs of Decoupling Amid US Stock
For years, the narrative surrounding Bitcoin’s price action has been inextricably linked to the performance of traditional financial markets, particularly the tech-heavy Nasdaq Composite. Often moving in lockstep, Bitcoin was viewed by many as a high-beta asset, amplifying the gains during bullish periods and suffering even steeper losses when risk sentiment soured in equities. However, recent market movements have sparked a crucial question among investors and analysts alike: is Bitcoin finally beginning to forge its own path, decoupling from the gravitational pull of U.S. stocks as they face mounting headwinds?
The past few weeks have witnessed a notable divergence. While U.S. stock markets, reeling from a confluence of factors including escalating geopolitical tensions stemming from a potential “Trump tariff war,” persistent inflation concerns highlighted by Federal Reserve Chair Jerome Powell’s hawkish warnings of “higher inflation and slower growth,” and broader macroeconomic anxieties, have experienced a significant downturn – shedding a staggering $3.5 trillion in value – Bitcoin has demonstrated a surprising degree of resilience, even posting gains in some instances. This nascent divergence has ignited a wave of optimism among Bitcoin proponents who have long yearned for the digital asset to be recognized and traded based on its own fundamental merits, rather than as a mere proxy for risk-on sentiment in the equity markets.
The concept of Bitcoin decoupling from traditional assets has been a recurring theme in the cryptocurrency space. The original thesis for Bitcoin, after all, positioned it as a decentralized, censorship-resistant store of value and a hedge against traditional financial system vulnerabilities. Its finite supply, its independence from central banks and government policies, and its inherent scarcity were touted as key differentiators that would eventually lead it to trade independently. However, the reality of the past few years has often painted a different picture, with institutional adoption bringing increased correlation with established asset classes.
The current shift, however tentative, offers a glimmer of hope for those who believe in Bitcoin’s unique value proposition. The factors contributing to the stock market slump – trade war anxieties, inflation fears, and the prospect of tighter monetary policy – arguably strengthen the case for Bitcoin as an alternative asset. In times of economic uncertainty and currency debasement concerns, the fixed supply and decentralized nature of Bitcoin could become increasingly attractive to investors seeking a safe haven outside the traditional financial system.
Furthermore, the increasing maturity of the Bitcoin market, with the development of more sophisticated trading instruments, greater institutional participation, and a deeper understanding of its underlying technology, may be contributing to its growing independence. As Bitcoin gains broader acceptance as a legitimate asset class, its price discovery mechanisms may become less reliant on the sentiment driving traditional equity markets.
However, it is crucial to approach this apparent decoupling with a degree of caution. While the recent divergence is encouraging for Bitcoin bulls, it is too early to definitively declare the long-awaited break has finally arrived. Market correlations can be fluid and influenced by a multitude of factors. A sudden shift in global risk sentiment or a significant negative event specific to the cryptocurrency space could easily re-establish the link between Bitcoin and traditional assets.
Adding a layer of complexity to the current narrative is the warning from some analysts regarding a potential Bitcoin price correction. Despite the recent resilience, multiple BTC price forecasting models have pointed towards a scenario where Bitcoin could fall back to its 2021 all-time high of around $70,000 in a relatively short timeframe – some even suggesting this could occur within the next ten days. This potential “crash risk,” as one analyst termed it, is attributed to various technical and market cycle indicators.
The notion that $70,000 could represent Bitcoin’s “practical bottom,” as suggested by some, highlights the inherent volatility and speculative nature of the cryptocurrency market. Even if Bitcoin is beginning to decouple from traditional equities, it remains susceptible to its own unique set of risks and price swings. Factors such as regulatory developments, network security concerns, and shifts in investor sentiment within the crypto space can still exert significant influence on its price.
Therefore, while the current divergence between Bitcoin and the struggling U.S. stock market offers a compelling narrative and fuels the hopes of long-term Bitcoin holders, it is essential to maintain a balanced perspective. The confluence of factors driving the stock market decline could indeed be creating an environment where Bitcoin’s unique characteristics become more appealing, leading to a sustained period of independent price action. However, the inherent volatility of the cryptocurrency market and the potential for a significant correction remind investors that the journey towards true decoupling is likely to be a complex and potentially bumpy one.
In conclusion, the recent market dynamics present a fascinating juncture for Bitcoin. The initial signs of decoupling from the crumbling U.S. stock market, driven by a confluence of macroeconomic anxieties and the potential for Bitcoin to act as an alternative store of value, are undeniably encouraging for those who believe in its long-term potential. However, the warnings of a potential price correction underscore the inherent risks within the cryptocurrency space. Whether this nascent decoupling marks a definitive shift in Bitcoin's market behavior or proves to be a temporary divergence remains to be seen. Investors would be wise to monitor these trends closely, remaining cognizant of both the potential for independent growth and the ever-present risks associated with this dynamic and evolving asset class. The coming weeks and months will be crucial in determining whether Bitcoin can truly forge its own path in the face of traditional market turmoil.

Navigating BTC Volatility Storm: Buy, Hold, or Flee?Bitcoin's recent price action has been reminiscent of a rollercoaster, leaving investors grappling with a whirlwind of conflicting signals. From sharp drops mirroring stock market turmoil to the looming "death cross," the cryptocurrency's trajectory is shrouded in uncertainty. Is this a prime buying opportunity, a warning to retreat, or simply another bout of the volatility that defines Bitcoin?
The past few days have been a stark reminder of Bitcoin's inherent volatility. Reports of an 8% drop, coupled with the US stock market shedding $2 trillion in value, sent ripples through the crypto sphere. The catalyst? Concerns surrounding potential US tariffs and their impact on the global economic outlook. This sudden shift in market sentiment triggered a sell-off, reminiscent of the COVID-19 crash in 2020, during which Bitcoin’s pre-pandemic gains evaporated.
Adding to the unease is the looming "death cross," a technical indicator that occurs when the 50-day moving average crosses below the 200-day moving average. Historically, this pattern has signaled bearish momentum. The 2022 death cross, for example, precipitated a significant price drop of nearly 20%. Conversely, "golden crosses," where the 50-day moving average crosses above the 200-day moving average, have historically signaled bullish momentum, triggering rallies of over 500% in 2020 and 2021.
Currently, Bitcoin's 50-day moving average is edging closer to this critical crossover, prompting widespread speculation. Is this a repeat of 2022, or will the market defy historical patterns? The answer, as always, is complex and contingent on a confluence of factors.
One significant factor is the strength of the US dollar. While the dollar's strength can often negatively impact Bitcoin, the current increase in the money supply could potentially counteract this effect, creating a bullish flag pattern. The dollar's inflation may become a catalyst for Bitcoin as a store of value. The global market dynamics are currently shrouded in uncertainty, making it difficult to predict the long-term impact of these factors.
The recent price drops have pushed Bitcoin towards the $80,000 mark, with some analysts predicting a potential fall to $71,000. However, this level could also represent a "sizeable bounce," acting as a strong support zone for Bitcoin. The concept of an "oversold bounce" also comes into play. After a period of intense selling pressure, markets often experience a relief rally as traders capitalize on discounted prices. Whether this materializes remains to be seen.
Is it a Good Time to Buy Bitcoin?
The decision to buy, hold, or sell Bitcoin depends on an individual's risk tolerance, investment strategy, and understanding of the market. Here's a breakdown to consider:
• For the Long-Term Investor:
o Bitcoin's long-term potential remains a compelling narrative. Its decentralized nature, limited supply, and growing adoption continue to attract institutional and retail investors.
o Price volatility is an inherent part of the Bitcoin journey. Historically, periods of sharp declines have been followed by significant rallies.
o Dollar-cost averaging (DCA) can mitigate the impact of volatility by investing a fixed amount at regular intervals, regardless of the price.1
o The strength of the US dollar may become a catalyst for Bitcoin as a store of value.
• For the Short-Term Trader:
o The current volatility presents opportunities for skilled traders to profit from price swings.
o Technical analysis, including monitoring moving averages and support/resistance levels, is crucial for identifying potential entry and exit points.
o However, short-term trading is inherently risky and requires a deep understanding of market dynamics.
o The "death cross" should be monitored carefully.
• For the Cautious Investor:
o The current market uncertainty may warrant a more conservative approach.
o Diversifying investments across different asset classes can help mitigate risk.
o Staying informed about market developments and avoiding emotional trading decisions is essential.
The Death Cross: A Warning or a False Alarm?
The "death cross" is a significant technical indicator, but it's not a foolproof predictor of future price action. Historical data show that while it can signal bearish trends, it's not always accurate. Market conditions, investor sentiment, and macroeconomic factors can all influence Bitcoin's trajectory.
Ultimately, the Bitcoin market remains highly speculative. The current volatility, driven by a confluence of factors, underscores the importance of careful research, risk management, and a long-term perspective. While the "death cross" and market fluctuations may cause short-term panic, the long-term potential of bitcoin, and it's reaction to the weakening dollar, may still produce long-term gains.

BTCUSD: Ready to Soar or Collapse?Hi Traders ! Possible Entries in BTCUSD (1H):
✅ Buy: If the price bounces off the lower line of the smaller ascending channel and breaks above 85,000 with volume. Additional confirmation if the RSI recovers above 60.
❌ Sell: If the price breaks down the smaller ascending channel, especially if it falls below 84,800. Extra confirmation if the RSI crosses below 50.
📢 Disclaimer: Not financial advice. Manage your risk properly.

Can it hit 89,000 again?The price trend of BTC has once again become the focus of global investors' attention.
Previously, BTC experienced a period of consolidation, during which the bulls and bears engaged in repeated games. Now, the bulls of BTC have risen strongly, unleashing powerful upward momentum.
With a swift and fierce move, it has broken through the key resistance level of 85,000 at one stroke. This breakthrough is like a fuse igniting the market, and the upward trend has spread rapidly. It is expected that it will further challenge the range of 87,000-89,000 in the future.
The market has been extremely volatile lately. If you can't figure out the market's direction, you'll only be a cash dispenser for others. If you also want to succeed,Follow the link below to get my daily strategy updates

Bitcoin (BTC/USD) Price Analysis: Bearish Breakdown Ahead?🔥 Bitcoin (BTC/USD) 1-Hour Chart Analysis 🔥
🔹 Trend Analysis:
🟡 Price was moving in an ascending channel 📈 but has broken below the trendline.
🟠 A retest of the broken trendline is happening, suggesting a potential drop 📉.
🔹 Trade Setup:
🔽 Short Entry: Expected rejection from the trendline.
❌ Stop Loss: $85,671 - $85,710 (Above resistance).
✅ Take Profit Target: $81,386 - $81,347 (Bearish target 🎯).
🔹 Indicators & Confirmation:
📊 EMA (9) at $84,254 → Acting as resistance 🚧.
🔄 Break & Retest Pattern → Typical for a bearish continuation 🛑📉.
🔹 Conclusion:
⚠️ Bearish Bias: If the price rejects the trendline, it could drop towards $81,386 🎯.
🚨 Invalidation: If the price breaks above $85,710, the short setup is canceled ❌.
