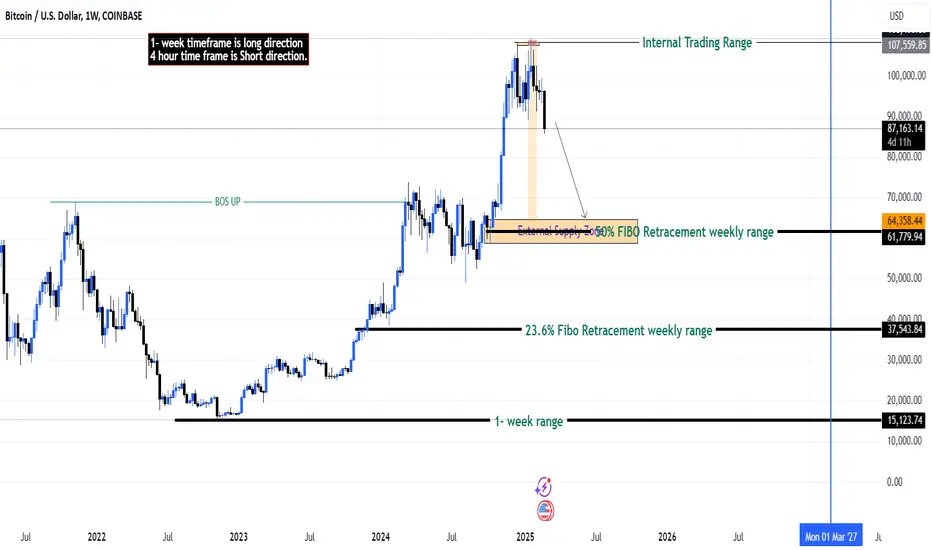
Broad View on Bitcoin - FxDollars - 26/02/2025Educational Analysis says BTCUSD may move DOWN from this range, according to my technical.
Broker - COINBASE
Because the BTCUSD pair showed some bullish weakness, it finally did liquidity, which was taken out on buy-side orders to show a sign of a downtrend, and I am looking to counter-trend this position.
Let's see what this pair brings to the table for us in the future.
Please check the comment section to see how this turned out.
DISCLAIMER:-
This is not an entry signal. THIS IS ONLY EDUCATIONAL PURPOSE ANALYSIS.
I have no concerns with your profit and loss from this analysis.
I HAVE NO CONCERNS WITH YOUR PROFIT OR LOSS,
Happy Trading, Fx Dollars.
Btcupdate
btc still bearish#BTCUSD, price have break below the main range which needs correction.
We hope to see price reaching 84k-82k but firstly double breakout below 87600 will drop the price there and stop loss at 88600.
Above 89300 holds bearish zone but if price multiple reverse there possible 91k will retest back.

One Last Leg Up (BTC to 100k zone)Bitcoin has been ranging for quite a really long period.
The break below that 4H trendline signified a long road to 50k. But for the meantime let's enjoy one last leg up to 100k zone. 🚀🚀

Bitcoin at a Critical Level: Will Support Hold or Break?CRYPTOCAP:BTC is currently accumulating within a marked zone, fluctuating within a broad range of approximately $17,800. The previous resistance line has now acted as support, indicating a key retest level.
If BTC fails to hold this support, a further decline toward the key support zone could be expected. The RSI is near 42.83, suggesting neutral momentum, with no strong bullish signs yet.
A breakdown below this range could trigger a bearish move, while a breakout above resistance would confirm bullish continuation.
DYOR, NFA
Thank you for your attention! If you found this valuable, please hit the like button and share your thoughts in the comments below.

Bitcoin Plummets: ETF Exodus, Liquidations, and Global Jitters
Bitcoin's recent plunge below the $90,000 threshold, a level unseen since November 2024, has sent ripples of concern through the cryptocurrency market. This sharp correction is attributed to a confluence of factors, including persistent ETF outflows, a surge in leveraged liquidations, and mounting geopolitical tensions, creating a volatile environment that has shaken investor confidence.
The most immediate catalyst for Bitcoin's decline has been the sustained outflows from US-listed Bitcoin ETFs. These exchange-traded funds, which had previously fueled Bitcoin's ascent by providing institutional investors with easy access to the cryptocurrency, have recently witnessed a reversal in sentiment. Investors, possibly reacting to broader market anxieties and profit-taking, have begun withdrawing funds, putting downward pressure on Bitcoin's price. This outflow signals a shift in institutional appetite, raising questions about the sustainability of the previous bullish momentum.
Adding fuel to the fire, the crypto market has experienced a significant wave of liquidations. Over $1.3 billion in leveraged positions were wiped out as Bitcoin's price plummeted. These liquidations, which occur when traders using borrowed funds are unable to meet margin requirements, exacerbate price volatility by triggering cascading sell orders. The sheer volume of liquidations underscores the high degree of leverage prevalent in the crypto market, highlighting the inherent risks associated with such trading strategies.
Furthermore, macroeconomic uncertainties are contributing to the risk-off sentiment permeating financial markets. The recent strengthening of the Japanese yen, often seen as a safe-haven asset, reflects investor concerns about global economic stability. Similarly, the dip in Nasdaq futures suggests a broader aversion to risk in traditional equity markets, which often spills over into the crypto space. The re-emergence of US-China trade tensions adds another layer of uncertainty, as any escalation could have far-reaching economic consequences, impacting investor sentiment and asset valuations.
The technical outlook for Bitcoin remains precarious. Analysts are closely monitoring the $85,000 support level, which, if breached, could trigger a further sell-off. The potential for over $1 billion in long liquidations below this level suggests that a significant drop is possible. Some analysts are even warning of a potential free fall to $81,000 if the $85,000 support fails to hold, indicating a severe test of market resilience.
Moreover, a more dire prediction posits that Bitcoin could potentially drop below $70,000, erasing gains made since the US election. This scenario, while alarming, highlights the vulnerability of Bitcoin to macroeconomic factors and investor sentiment. The prospect of a significant correction raises concerns about the stability of the crypto market and its ability to withstand external shocks.
The current market conditions serve as a stark reminder of the inherent volatility of cryptocurrencies. While Bitcoin has demonstrated remarkable resilience in the past, its price remains susceptible to a wide range of factors, including ETF flows, leveraged trading, and global economic conditions. Investors must remain vigilant and exercise caution in navigating this turbulent landscape.
The recent downturn underscores the importance of risk management in cryptocurrency trading. Leveraged positions, while offering the potential for amplified gains, also carry the risk of substantial losses. The high degree of leverage prevalent in the market can exacerbate price swings, leading to rapid liquidations and further downward pressure.
Furthermore, the growing correlation between traditional financial markets and the crypto space highlights the need for investors to consider broader macroeconomic factors. Changes in interest rates, inflation, and geopolitical tensions can all impact investor sentiment and asset valuations.
In conclusion, Bitcoin's recent tumble below $90,000 reflects a confluence of factors, including ETF outflows, leveraged liquidations, and global economic uncertainties. The market remains highly volatile, and further price swings are possible. Investors should exercise caution and prioritize risk management in navigating this challenging environment. The ability of Bitcoin to recover from this downturn will depend on a variety of factors, including the resumption of ETF inflows, a reduction in leveraged trading, and a stabilization of global economic conditions. The coming weeks will be critical in determining whether Bitcoin can regain its footing or succumb to further downward pressure.

Turning BTC into Revenue: MicroStrategy's Innovative ApproacMicroStrategy's Wild Ride: Navigating Bitcoin's Volatility with a "Yield" Strategy
MicroStrategy (MSTR), the enterprise software company that famously pivoted to a Bitcoin acquisition strategy, has seen its stock price plummet by roughly 16% year-to-date. This downturn mirrors the broader volatility experienced by Bitcoin, which has faced significant headwinds amidst rising interest rates and macroeconomic uncertainty. However, despite the short-term turbulence, a significant portion of stock analysts remain bullish on MicroStrategy's long-term outlook, primarily due to the company's innovative "Bitcoin yield" strategy.
MicroStrategy's bold decision to adopt Bitcoin as its primary treasury reserve asset, spearheaded by former CEO Michael Saylor, has inextricably linked its fortunes to the cryptocurrency's performance. When Bitcoin surges, MSTR typically follows suit, and conversely, downturns in the crypto market exert downward pressure on the stock. This direct correlation has made MSTR a high-beta play on Bitcoin, offering investors amplified exposure to the digital asset's price fluctuations, both positive and negative.
The recent decline in MSTR's stock price can be attributed to several factors. Firstly, the Federal Reserve's aggressive interest rate hikes to combat inflation have dampened investor appetite for riskier assets, including cryptocurrencies. This has led to a significant sell-off in the crypto market, dragging down Bitcoin's price and, consequently, MSTR's valuation.
Secondly, concerns about regulatory scrutiny in the cryptocurrency space have added to the market's unease. Increased regulatory oversight and potential crackdowns on crypto exchanges and projects can create uncertainty and dampen investor confidence.
Lastly, general market sentiment towards growth stocks and technology companies has been bearish, further contributing to MSTR's decline. As a company closely associated with the tech sector and the volatile cryptocurrency market, MicroStrategy has been particularly vulnerable to these broader market trends.
Despite these challenges, the bullish sentiment from stock analysts stems from MicroStrategy's unique approach to generating "Bitcoin yield." This strategy involves utilizing the company's substantial Bitcoin holdings to secure loans and generate revenue through various financial instruments.
One key component of this strategy is the use of Bitcoin-backed loans. MicroStrategy has successfully leveraged its Bitcoin holdings to obtain loans at favorable interest rates, effectively monetizing its digital assets without selling them. This allows the company to generate cash flow while maintaining its long-term Bitcoin position.
Furthermore, MicroStrategy is exploring other avenues to generate Bitcoin yield, such as participating in staking and lending platforms. These activities allow the company to earn interest or rewards on its Bitcoin holdings, further enhancing its revenue streams.
Analysts argue that this "Bitcoin yield" strategy provides MicroStrategy with a sustainable business model, even during periods of Bitcoin price volatility. By generating revenue from its Bitcoin holdings, the company can mitigate the impact of price fluctuations and maintain its financial stability.
Moreover, the company's continued accumulation of Bitcoin, even during price downturns, demonstrates its long-term commitment to the cryptocurrency. This unwavering belief in Bitcoin's future potential is seen by many analysts as a strong signal of confidence.
However, the "Bitcoin yield" strategy is not without its risks. The crypto lending market is still relatively nascent and subject to regulatory uncertainties. Counterparty risk and the potential for loan defaults are also factors that could impact MicroStrategy's financial performance.
Another element that is important to consider is the level of debt Microstrategy has taken on. The company has funded its Bitcoin purchases through debt offerings, and while the "Bitcoin yield" strategy is designed to cover the interest payments, a prolonged bear market could put pressure on the company's balance sheet.
The success of MicroStrategy's strategy hinges on the long-term appreciation of Bitcoin. If Bitcoin's price continues to rise, the company's Bitcoin holdings will increase in value, and its "Bitcoin yield" strategy will become even more profitable. However, if Bitcoin's price stagnates or declines, the company's financial performance could be negatively impacted.
In conclusion, MicroStrategy's stock price has experienced significant volatility in line with Bitcoin's performance. While the recent downturn has raised concerns, stock analysts remain optimistic about the company's long-term prospects, citing its innovative "Bitcoin yield" strategy. This strategy, which involves leveraging Bitcoin holdings to generate revenue, provides MicroStrategy with a unique business model that could potentially mitigate the impact of Bitcoin's volatility.
However, investors should be aware of the risks associated with this strategy, including regulatory uncertainties, counterparty risk, and the potential for loan defaults. The success of MicroStrategy's strategy ultimately depends on the long-term trajectory of Bitcoin's price. As the cryptocurrency market continues to evolve, MicroStrategy's ability to adapt and navigate these challenges will be crucial to its future success.

BTC LONG Great entry opportunity, important support. I expect at least a bounce. After waiting for a long time, I believe we are finally in a good zone. Don't forget to protect the trade.

What's next can we expect from Bitcoin???Bitcoin after making All-time-high is being trading in a long range. According to range trading rule, btc is currently trading under the range low.
Now, if we see range low reclaim, then we can see btc making new ATH (green line).
If btc doesn't holds it's support, then we may probably see btc tapping into it's fvg and from there we can expect great reversal (blue line).
bad case scenario if btc dumps below 80K (major CME gap region) (yellow line).

Bitcoin Overextended? Key Levels & 15-Min Chart Setup Revealed!📈 Bitcoin seems overextended right now. 🔑 In my opinion, it's testing key support levels. I'm watching for a retrace into the midpoint of the previous price swing for a potential short opportunity. 🎥 In the video, I break down key insights on the trend, market structure, and price action, and show exactly what I'm looking for on the 15-minute chart for an entry. 🚨 Not financial advice! 📉

Bitcoin BTC Breaking Structure? Key Levels & Trade Setup!👀 👉 In this video, we analyze Bitcoin (BTC) and its recent price action. The four-hour chart shows a bearish break of structure, and my short-term bias remains bearish. I'm waiting for a short entry, aiming for previous lows highlighted in the video. This is not financial advice.

BTC/USDT 1H: Bearish Rejection – Accumulation in Play !!BTC/USDT 1H: Bearish Rejection – Accumulation in Play, Await Reversal Confirmation?
🚀 Follow me on TradingView if you respect our charts! 📈 Daily updates!
Current Market Structure:
Price at $94,189, showing bearish momentum after rejection from $98.8K.
Market structure remains bearish following a break of the previous swing low at $95.2K.
Hidden bearish divergence on RSI is evident, with RSI making lower highs while price holds equal highs.
Market Maker Activity:
Smart Money appears to be accumulating at these levels based on volume profile.
Accumulation suggests potential for a reversal if key support at $93.2K holds.
Trade Setup (Confidence 8/10):
Entry: $94,200 - $94,400 zone.
Targets:
T1: $96,400 (previous support)
T2: $98,200 (supply zone)
Stop Loss: $93,200 (below recent swing low).
Risk Score: 7/10 – Moderate risk, considering weekend volatility.
Recommendation:
Wait for reversal confirmation with a 1H close above $94.8K before entering long positions.
Maintain tight stops and scale in entries as the setup offers an attractive risk/reward provided $93.2K support holds.
🚀 Follow me on TradingView if you respect our charts! 📈 Daily updates!

Bitcoin Holds Strong: $100K Breakout or Pullback Ahead?#Bitcoin Update
Bitcoin remains in a tight consolidation phase after rebounding from key support.
Support at $93,700 Holding: BTC has successfully defended the ascending trendline and 200 EMA, showing strong buyer interest around this level.
Range-bound movement: The price continues to hover between the ATH resistance and the lower support, forming a key accumulation zone.
Breakout Watch: A daily close above the $100,000 resistance could lead to a breakout, while a failure to hold support may trigger a correction.
Traders should keep an eye on BTC’s next move, as volatility could increase soon.
DYOR, NFA
#BTC #Crypto

BITCOIN : Important support for the price of the last hope!hello friends
With Bit analysis, we have two scenarios:
1_ The price will return to the important support of 92 thousand dollars or even 90 thousand dollars and from there I will see the growth of the new wave of bit.
2- The important support price should break and continue to fall, and within the specified range with confirmation, we can enter a new upward wave.
What do you think? Will important support be lost?
In our opinion, due to the continuation of the trend and because the volume of sales has not happened, the first scenario is more likely and its target is 115-120 thousand dollars.
*Trade safely with us*

RUNEUSDT Strong Support Zone – 300%-400% Gains Potential!RUNEUSDT is currently trading at a strong support level, which presents a significant opportunity for potential upside. Support levels act as critical price points where demand is expected to be strong enough to prevent further declines. The fact that RUNEUSDT is holding well at this support level suggests that the price may reverse course and initiate a rally. With solid volume backing this level, there is a good chance that RUNEUSDT could see substantial gains in the coming weeks, with projections of 300% to 400%+ if the price rebounds and continues to surge from here.
The support level is crucial as it indicates that buyers are stepping in and absorbing the selling pressure, preventing the price from breaking lower. The good volume accompanying this consolidation adds to the strength of this support zone, making it more likely that RUNEUSDT will bounce higher once it consolidates further. The growing investor interest suggests that traders are starting to recognize the potential in this project, which could trigger a wave of buying pressure once the price moves past key resistance levels. With the projected gains of 300% to 400%+, this makes RUNEUSDT an asset to keep an eye on for those looking to capitalize on potential explosive moves.
RUNEUSDT's position at the strong support level also indicates that the current downtrend might be coming to an end. If the price successfully breaks above the resistance level that has formed after the support zone, it could signal the beginning of a significant upward trend. This is supported by the increasing investor interest in the project, which further suggests that market sentiment is turning positive. If the price rebounds and gains momentum, the target of 300% to 400%+ is within reach, making this an exciting setup for traders looking for high-reward opportunities.
Investors should keep a close watch on RUNEUSDT as it holds at this critical support level. A successful bounce off this level, combined with strong volume and buying interest, could signal the start of a major rally. With the potential for significant returns and an improving market sentiment around this crypto pair, RUNEUSDT presents a promising opportunity for those seeking high-potential trades in the market.
✅ Show your support by hitting the like button and
✅ Leaving a comment below!
Your feedback and engagement keep me inspired to share more insightful market analysis with you!

Bitcoin Outlook for the YearBitcoin Outlook for the Year
The main support level is at 93,368. As long as we hold above it, two main upside targets remain open: 126,500 and 195,241. However, if we break below this supp and retest it from below, there is a high probability that the path to 57,000–60,000 will open.
That’s it. You don’t need any other indicators to make money in crypto)

Bitcoin's Volatility Lull: Is a Major Breakout Imminent?Bitcoin, the undisputed king of cryptocurrencies, finds itself in a peculiar state of limbo. While the broader financial world buzzes with geopolitical uncertainty and economic shifts, BTC's price action has settled into a remarkably narrow range, leading to a significant drop in implied volatility. This period of relative calm, however, is juxtaposed with significant undercurrents: a major exchange hack, strategic accumulation by corporate giants, and the ever-present debate over Bitcoin's next major price movement.
One of the most notable observations is the near-record low implied volatility. Implied volatility, a measure of the market's expectation of future price swings, has dwindled, suggesting traders are anticipating less dramatic price fluctuations. This quietude is unusual for Bitcoin, a notoriously volatile asset. Traditionally, such suppressed volatility often precedes a significant breakout, either upward or downward. The current stasis could be a coiled spring, ready to unleash a surge of price action when the right catalyst emerges.
Adding another layer of complexity is Bitcoin's rangebound trading. Despite the recent Bybit hack, which raised concerns about exchange security and potential market instability, Bitcoin has remained remarkably resilient within its established trading corridor. This resilience, however, has also bred a sense of unease among traders and analysts. The lack of a decisive break in either direction has left many wondering whether this consolidation is a period of accumulation or a sign of waning momentum.
The Bybit hack, while disruptive, appears to have had a limited impact on Bitcoin's overall price trajectory. This suggests that the market may be becoming more adept at absorbing such shocks, a sign of its growing maturity. Nevertheless, the incident serves as a stark reminder of the inherent risks associated with centralized exchanges and the importance of robust security measures.
Amidst this backdrop of low volatility and rangebound trading, the pronouncements of prominent traders and corporate players are adding fuel to the fire. A crucial narrative revolves around the $106,000 price level. According to some analysts, this threshold represents a critical juncture for Bitcoin. A successful reclaim of this level would, they argue, signal the beginning of a new phase of price discovery, potentially leading to substantial gains.
However, the path to $105,000 + is far from certain. Counterarguments suggest that a significant dip to $80,000 remains a distinct possibility. This perspective highlights the inherent uncertainty of the cryptocurrency market, where technical analysis and fundamental factors can often provide conflicting signals. The potential for a sharp correction underscores the importance of risk management and the need for traders to remain vigilant.
On the bullish side, MicroStrategy's Michael Saylor continues to make waves with his unwavering commitment to Bitcoin. The company's "21/21" plan, which involves ongoing Bitcoin accumulation, is progressing steadily following a recent $2 billion convertible note offering. Saylor's bullish stance and his company's strategic acquisitions have become a significant market force, providing a powerful vote of confidence in Bitcoin's long-term potential.
MicroStrategy's approach is not merely speculative; it is a calculated bet on Bitcoin's role as a store of value and a hedge against inflation. This strategy has resonated with other institutional investors, contributing to the growing acceptance of Bitcoin as a legitimate asset class. The company's continued accumulation efforts are likely to exert upward pressure on Bitcoin's price, particularly if demand from other sources increases.
The confluence of these factors – low implied volatility, rangebound trading, the $105,000+ debate, and MicroStrategy's aggressive accumulation – creates a fascinating and potentially explosive dynamic. The low volatility could be a temporary lull before a significant price movement, while the rangebound trading indicates a period of indecision that will eventually resolve itself.
The $105,000+ level represents a critical test for Bitcoin. A successful breach of this threshold could trigger a wave of buying, propelling the price to new highs. Conversely, a failure to reclaim this level could lead to a significant correction, potentially validating the bearish predictions of a dip to $80,000.
In the meantime, MicroStrategy's continued accumulation provides a strong foundation of support for Bitcoin's price. The company's strategic approach and its commitment to long-term holding suggest that it is not swayed by short-term price fluctuations.
In conclusion, Bitcoin's current state is a complex interplay of conflicting signals. The low implied volatility and rangebound trading create an atmosphere of uncertainty, while the $105,000+ debate and MicroStrategy's accumulation provide clear points of focus. The cryptocurrency market is poised for a potential breakout, and the direction of that breakout will likely be determined by the interplay of these factors. Whether Bitcoin will reclaim $105,000+ or dip to $80,000 remains to be seen, but one thing is certain: the next chapter in Bitcoin's story is about to unfold.

BTCUSDBTC still have some more correction before any upside. As long as 91K is intact we are good to go up.


The New Baseline: Bitcoin Is Going Higher (New 2025 ATH #s)Good afternoon my friend, we have a new baseline.
Bitcoin has been consolidating above 90K for three months. We are about to move higher. Bitcoin is set to move higher, much higher in the coming weeks and days. Whenever there is a drop, the strongest support ever will be found around $90,000 and $94,000. Bitcoin will never move below/lower than this range. This is our new baseline.
The next advance is here now but still not yet present on the chart.
The ByBit hack was a major event and yet, the market is so strong that Bitcoin bottomed around 95K. This after the biggest hack in the history of the Cryptocurrency market. This confirms that sellers have no force, the bulls are strong and ready to buy-everything. The bulls have been accumulating and will continue to accumulate long-term. This is it.
A common question goes as follows, "When can I buy Bitcoin?"
"Can I buy now?"
The price to buy Bitcoin for long-term holders, spot traders and accumulators is within the $90,000 and $100,000 price range. We still have one or two more days left to go but it seems $90,000 is now something of the past, impossible to buy Bitcoin at this price. It is gone. It is not available anymore. Think long-term.
We are entering a new bull-market. A major bullish-wave within an already very strong bullish phase. Bull-bullish-bullish in short.
The lowest level after 17-December 2024 peak price stands at $89,268 on a wick. The lowest close $92,541.
Starting 18-November 2024, Bitcoin has never closed below $90,000 and it is likely that Bitcoin will never, ever, visit this level again.
After the bull-market bull-run and bullish phase the bear-market the follows is likely to bottom higher, but this is still too far away.
The new All-Time High in 2025 is not set in stone, it has not been decided. All the numbers I've been sharing is all speculation. The market can go for longer and higher than anything we expect, it is truly unpredictable. It cannot go lower though. We know for sure that Bitcoin will not peak below 150K. We have a minimum range of 160,000 to 180,000 with 200,000 also possible and who knows... Cryptocurrency is new and young.
I just wanted to tell you that you can rest easy because the best is yet to come.
We are only getting started. We are about to experience long-term growth. It will be the most profitable and most exciting we've seen in years. Everything is about to speed up.
Give it time. Now, buy and hold.
We are on the verge of incredible change.
Positive change. This is the evolution of finance.
You are in the right place at the right time.
Imagine the Internet, but on steroids. That's BTC.
Namaste.

I want to warn you about $BTCI understand that it's impossible to predict the exact peak down to the last cent unless you have some insider data. I see the global sentiment. I see that companies are currently obsessed with the BTC ETF mania and risk, while others are paralyzed by fear, throwing up their hands and saying, "That's it, we're done." I believe that, most likely, the global high is here. We've seen the same wedge pattern form in 2021, 2013, and 2017, which signaled one thing—the bull market was over.
There's no altseason, but at the very least, there will be opportunities to reclaim profits because there will still be short squeezes. However, that’s just a momentary event. We see everything falling, and then suddenly, altcoins start shooting up—this is a sign that the end has come for the market.
I've already thought about where to escape and what to do. I have plans A, B, C, and D, but only one of them is positive. The rest are about pure negativity in the world, which will only continue to escalate.

BTCUSD: Short-Term Rebound Before Extending Bearish TrendIn line with previous analysis, BTC remains within a Symmetrical Channel Down pattern, signaling a potential continuation of its downward trend into early 2025. The price is currently approaching a minor support level at 94,992, which could trigger a short-term rebound.
If buying pressure strengthens, BTC may see a technical rebound toward the minor resistance at 98,768, aligning with the upper boundary of the Symmetrical Channel Down. However, as long as the price remains below this level, the broader trend remains bearish, with a potential decline toward the key 2025 support level at 92,102.
Traders should monitor price reactions at these critical levels for confirmation of the next move.
Previous analysis

XIBTUSDT Falling Wedge Breakout – 140%-150% Gains XIBTUSDT has recently completed a breakout from a Falling Wedge pattern, a bullish technical formation that indicates a potential shift from a downtrend to an uptrend. The Falling Wedge is characterized by converging trendlines where the price consolidates before making a strong move to the upside. With the breakout now confirmed and supported by good volume, the price of XIBTUSDT is expected to continue its upward momentum. The breakout signals that the market sentiment is shifting, and traders are anticipating substantial gains, with projections of 140% to 150%+ if the price continues to rally.
The breakout from the Falling Wedge is an important technical signal, especially when accompanied by good volume. The increased trading activity supports the idea that the breakout is not a false move and suggests that the upward trend has the strength to continue. As XIBTUSDT pushes higher, key resistance levels will be tested, and if they are broken, the price could accelerate toward its projected gain levels. With growing investor interest and positive technical indicators, XIBTUSDT is one of the more exciting crypto pairs to watch for significant upside potential.
Investor interest in XIBTUSDT is rising as more market participants recognize the breakout and the potential for high returns. The strong volume confirms that this breakout is legitimate, and the price could continue to climb as more traders enter the market. The Falling Wedge pattern often leads to explosive price action, and with the good volume supporting this move, the likelihood of a sustained rally is high. The anticipated 140% to 150%+ gain further reinforces the belief that XIBTUSDT could be in the early stages of a strong bullish move.
Traders should continue to monitor key resistance and support levels as the price action unfolds. If XIBTUSDT can maintain its momentum and break through further resistance, it could offer substantial returns for those who have positioned themselves early. With the current technical setup and growing investor interest, XIBTUSDT is a promising asset to track for those seeking high-reward opportunities in the crypto market.
✅ Show your support by hitting the like button and
✅ Leaving a comment below!
Your feedback and engagement keep me inspired to share more insightful market analysis with you!

BTCUSDT BUYING SETUP IN 4-H TAHello Guys Here Is Chart Of BTCUSD
Support: Around 94300 - 94000
Target: 98500
Resistance: Around 98600 - 99000
This setup indicates potential bullish momentum, provided Bitcoin successfully holds the support level and breaks above the resistance.
