BTC Bitcoin HTF Bullish Structure & Potential Trade Setup👀 👉 A detailed analysis of Bitcoin (BTC) on the weekly and daily charts highlights a bullish market structure. Further upside potential is anticipated, provided a retracement occurs as outlined in the video. In this session, we examine the trend, price action, market structure, and a possible trade opportunity. ⚠️ This video is for educational purposes only and is not intended as financial advice.
Btcupdate

Bitcoin's Midweek Liquidity Play Detailed Analysis Bitcoin's Price Analysis Based on Current Market Conditions
1. Bullish Price Action from CPI Triggers
Recent Consumer Price Index (CPI) data has provided a significant bullish trigger, aligning with the market's expectation of reduced inflationary pressures. This macroeconomic indicator is a key driver, as it reassures investors about the Federal Reserve's potential to maintain or reduce interest rate hikes. Bitcoin's price has reacted positively, with a clear bullish breakout, showing strength in its upward trajectory. The CPI induced move is critical as it reflects institutional confidence and a shift in liquidity toward risk-on assets like Bitcoin.
2. Midweek Reversal Dynamics
Retailer FOMO at Play
Historically, Wednesday and Thursday are pivotal days for Bitcoin's price action, often characterized by reversals. This behavior is driven by a mix of institutional repositioning and retail traders' emotional responses. Currently, retail traders appear to be in a state of FOMO (Fear of Missing Out), entering positions aggressively as Bitcoin pumps. This scenario creates a ripe environment for market makers to exploit, as over leveraged long positions begin to dominate. A liquidity sweep targeting stop loss clusters below current support levels is highly probable.
3. Stop-Loss Sweep and Liquidity Dynamics
The chart indicates that a significant number of stop-loss orders are concentrated around the $98,600 level, just below recent support. This aligns with a 4-hour imbalance zone, which remains untested. Market makers are likely to drive the price down to this level to fill pending orders and collect liquidity. Such a move would shake out weak hands before the price regains upward momentum.
Following the liquidity sweep, a strong pump is expected toward the $102,400 zone, a key area of interest where previous imbalances and institutional orders are likely stacked. This zone serves as a springboard for the next leg of the rally.
4. Projection to Key Levels: $108,362 and Beyond
Once liquidity at $98,600 is absorbed and the $102,400 zone is reclaimed, Bitcoin is poised to target the next major resistance at $108,362. This level aligns with a confluence of technical factors, including previous highs and Fibonacci extensions. Breaking this resistance would open the path to the $110,000 psychological level, further validating the bullish macro trend.
Bitcoin's price action is entering a critical phase influenced by macroeconomic triggers, market structure, and liquidity dynamics. Traders should remain cautious of midweek reversals and liquidity sweeps, while positioning for potential upside targeting $108,362 and beyond. Proper risk management is essential, given the market's high volatility and the potential for unexpected deviations.

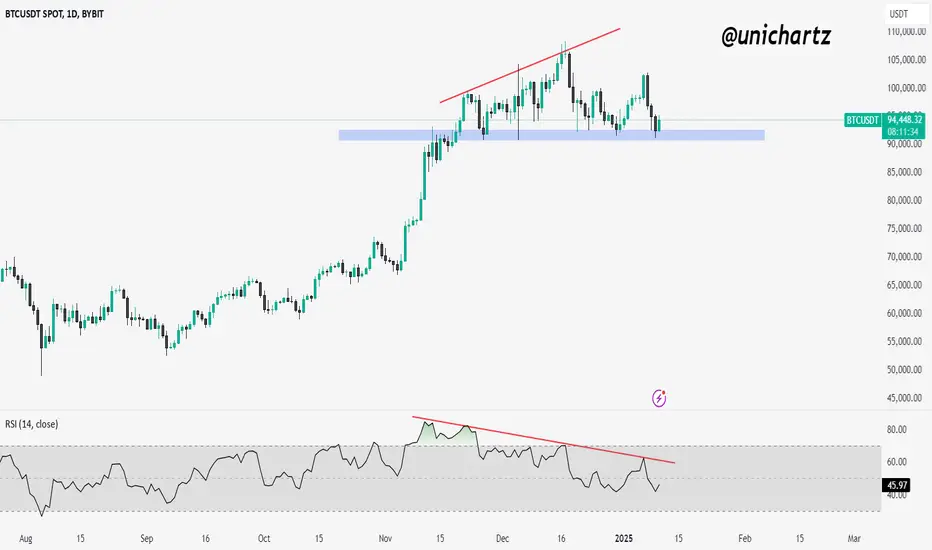
Bitcoin Updatebtc has formed:
- ascending channel in blue and broke it
- while retesting the channel btc also formed a head and shoulders setup
- descending trendline in red
we're waiting for a candle to close below the neckline an retesting it so we enter a short (sell) trade
Follow us or more ideas an updates

BTC UP OR DOWN READ CAPBitcoin is at a pivotal point, where a breakout from its current level could spark a major rally, boosting investor confidence and driving significant upward momentum. However, if it fails to hold this crucial support, it risks heightened selling pressure, which could result in a sharp and prolonged downward trend in the market.

BTCUSDT Trade LogBTCUSDT – 4H/1D Kijun Breakout
Price Action: We’ve seen a triple tap on the Daily Kijun that marked strong resistance. The breakout and daily close above on January 6th, 2025 confirms a bullish signal. Now, price is hovering around the 4H/D Kijun confluence, creating a favorable area to watch for a retest and potential bounce.
Trade Idea (Long):
– Enter on retest of the 4H/D Kijun if we see supportive wicks or bullish confirmation.
– Risk: 1% of account.
– Reward: 1:2 RRR target (take profit near key swing high or FVG fill).
Macro News Watch: This is a big macro news week. Stay alert for unexpected volatility that could invalidate the setup. If price closes back below the Kijun levels, be prepared to manage or exit the trade accordingly.

BTC on the Edge Falling Wedge Breakout & CPI Impact Awaited !The chart shows Bitcoin (BTC/USDT) on the 4-hour timeframe, moving within a falling wedge pattern
The falling wedge pattern is a bullish continuation/reversal formation, where the price compresses within converging trendlines. BTC has been respecting the pattern's boundaries, suggesting a potential breakout. The immediate resistance zone at $97,200 has been tested multiple times, but the price has faced consistent rejections, indicating strong selling pressure in this area.
For a bullish breakout, we need a 4-hour candle close above $97,200. If this happens, it could trigger a strong upward momentum, with a target potentially extending towards the $104,000 region, aligning with previous highs.
The presence of CPI (Consumer Price Index) data release today adds an external factor of volatility. Economic data like CPI can significantly impact the market sentiment, especially in crypto, as it reflects inflation levels and can influence risk-on or risk-off market behavior.
Traders should exercise caution and consider these key factors
Monitor the wedge breakout closely.
Await a confirmed 4-hour candle close above $97,200 before entering a long position.
Use proper risk management, as the market is expected to be volatile due to the CPI data.
BTC is on the verge of a potential breakout. However, external factors like CPI data can amplify volatility. Wait for confirmation and trade cautiously.

2 Months Till BTC reaches 95kUPDATE!!!!
Hello Fellow Traders,
I hope That Everyone Follows This Forecast To make some big Profits!
Here is a Full Updated Analysis & Forecast For BTCUSD.
Right Now I'm Still Bearish on BTCUSD for Short Term, But When it Reaches Around 20K I will Look for a Long Term BUY opportunity!
The Best way to follow my Analysis is if the following conditions apply.
Conditions -
1. Wait for the Market to Show you some Rejection / Confirmation / Direction
2.Wait for confirmation(Price Action Confirmation Aka . Pinbar , Bullish or Bearish engulfing / Break of structure Aka Support Or Resistance)
3.Do your Own analysis! (Draw Trend Lines / Support & Resistance Zones / SND )
4.Always Use Risk Management (Risk 1% of your capital)
5.Entry Should be Made on The 4H Timeframe (Only if you have Confirmation)
6.Trade at own risk.
Let Me know if you have any Questions or Comments Below!
Please Support My ideas & Educational Posts with a Like and Comment ❤️
Link to chart
See You in the next Analysis!
Global Fx Education

BITCOIN BUY OR SELL READ THE CAP"Bitcoin is showing a limited buying opportunity with strong indicators leaning towards a potential sell-off; investors should proceed with caution, keeping a close eye on market trends and resistance levels."

Bitcoin (BTCUSDT) 2500% Done @ 10X Leverage!Bitcoin MASSIVE LONG Trade Caught!
The move from $27,200 to $96,100 represents an approximately 250% gain. At 10x leverage I took, this is a clear 2500% massive gain!
This large rally indicates strong bullish momentum caught using the Risological Options Trading Indicator , with consistently higher highs and higher lows on the daily chart.
Use caution if momentum slows—prolonged consolidation or reversal signals might appear around such a major milestone.
Despite short-term pullbacks, BTC’s overall trend remains firmly bullish on the daily timeframe. The uptrend is supported by strong demand and increasing volume, often associated with sustained rallies.

BTC Breaks Highs: Bullish Trend Shift Possible ContinuationBTC has broken the previous high, signaling a shift in the trend. This marks a bullish change of character, and I'm watching for a retrace on the lower timeframe with a potential continuation to the upside. Keep an eye on a Fibonacci pullback to the 50-61.8% level on the previous four-hour swing for a possible bullish entry. This is not financial advice.

Resistance Broken? BTC Aims for $96K!Falling Trendline Breakout
Bitcoin has broken above a descending trendline resistance, indicating a potential shift in momentum from bearish to bullish.
Entry Zone
The recommended buy zone is $91,500 to $90,500. Price is currently within this range, making it an ideal area for a long entry.
Stop Loss
A tight stop-loss at $89,500 helps minimize downside risk if the breakout fails.
Targets
Target 1: $92,000
Target 2: $93,000
Target 3: $94,000
Target 4: $95,000
Target 5: $96,000
Risk Management
Stop-loss placement is critical to avoid potential losses, with a strong downside risk below $89,500.
Recommendation
Watch for a sustained close above the breakout level and monitor volume confirmation for continued upside momentum. This trade aligns well with a bullish reversal structure and offers multiple profit-taking levels.

Bitcoin's Double Bottom Reversal1.Double Bottom Formation
Bitcoin has formed a double bottom pattern, signaling a potential bullish reversal.
The second bottom was created around $89,200, which acts as a strong support level.
2.Neckline Resistance at $91,200
The neckline of the double bottom pattern is at $91,200.
A daily close above $91,200 is crucial to confirm the breakout and initiate an upward move.
3.Bullish Scenario
If the price successfully breaks and closes above the neckline, a long position can be considered.
The breakout could lead to a potential price target of higher resistance zones, depending on momentum.
4.Risk Management:
If the price fails to sustain above $91,200, a retest of lower support ($89,200) could occur.
5. Key Levels to Watch
Support: $89,200
Resistance : $91,200 (neckline)
Bitcoin is showing signs of a bullish reversal from the double bottom pattern. Keep a close eye on the neckline breakout for confirmation before entering long positions.

What’s Next for BTC: $99K or $84K?Good Morning, Trading Family!
What’s Next for BTC: $99K or $84K?
Here’s the game plan: if BTC corrects up to $93K, $94K, or $96K, it could then pull back down to the $84K marker. But if BTC breaks $96K, we could see it climb to $99K.
This Sunday, I’m hosting a webinar on how emotions can hurt your trading and how to take control of your mindset for better results.
Send me a message or check out my profile for details. If this added value to your trading, like, comment, and share it with someone who needs it.
Kris/Mindbloome Exchange
Trade What You See

What to Expect from Bitcoin in 2025? BEARISH TREND #BTC 13-01-25Bitcoin already started BEARISH TREND, so far #BTC gave us bearish reversal signal, at the same time it is forming Bearish Trend for 2025.
Thank you and Good Luck to all traders of #BTC and crypto!

BTCUSDT: Red Lines Mark the Short-Term Shorting Zones
BTCUSDT: Red Lines Mark the Short-Term Shorting Zones 🚨
As you can see here: I shorted 102.500 level last time. I'm not going to build new position but I want to give some weak points on the chart.
We’re looking at key red lines on the chart—prime zones for short-term shorting opportunities. These aren’t just random lines; they’ve been carefully selected based on market dynamics. Let’s break it down:
Strategic Short Zones: The red lines represent areas where sellers are likely to step in. These are not long-term plays but quick, tactical shorts.
Market Context Matters: Always consider the broader trend. While these zones are ideal for shorts, confirmation from lower timeframes (like 1H or 15M) is essential.
Tools for Precision: I’ll use CDV, volume profile, and liquidation heatmaps to ensure the setup aligns with market sentiment.
Pro Tip: These short-term trades require agility—monitor price action closely and take profits quickly. The market rewards those who plan ahead and execute with precision.
Get ready, trade smart, and let’s make this another winning move. Boost, comment, and follow for more insights! 💥
Let me tell you, this is something special. These insights, these setups—they’re not just good; they’re game-changers. I've spent years refining my approach, and the results speak for themselves. People are always asking, "How do you spot these opportunities?" It’s simple: experience, clarity, and a focus on high-probability moves.
Want to know how I use heatmaps, cumulative volume delta, and volume footprint techniques to find demand zones with precision? I’m happy to share—just send me a message. No cost, no catch. I believe in helping people make smarter decisions.
Here are some of my recent analyses. Each one highlights key opportunities:
🚀 RENDERUSDT: Strategic Support Zones at the Blue Boxes +%45 Reaction
🎯 PUNDIXUSDT: Huge Opportunity | 250% Volume Spike - %60 Reaction Sniper Entry
🌐 CryptoMarkets TOTAL2: Support Zone
🚀 GMTUSDT: %35 FAST REJECTION FROM THE RED BOX
🎯 ZENUSDT.P: Patience & Profitability | %230 Reaction from the Sniper Entry
🐶 DOGEUSDT.P: Next Move
🎨 RENDERUSDT.P: Opportunity of the Month
💎 ETHUSDT.P: Where to Retrace
🟢 BNBUSDT.P: Potential Surge
📊 BTC Dominance: Reaction Zone
🌊 WAVESUSDT.P: Demand Zone Potential
🟣 UNIUSDT.P: Long-Term Trade
🔵 XRPUSDT.P: Entry Zones
🔗 LINKUSDT.P: Follow The River
📈 BTCUSDT.P: Two Key Demand Zones
🟩 POLUSDT: Bullish Momentum
🌟 PENDLEUSDT.P: Where Opportunity Meets Precision
🔥 BTCUSDT.P: Liquidation of Highly Leveraged Longs
🌊 SOLUSDT.P: SOL's Dip - Your Opportunity
🐸 1000PEPEUSDT.P: Prime Bounce Zone Unlocked
🚀 ETHUSDT.P: Set to Explode - Don't Miss This Game Changer
🤖 IQUSDT: Smart Plan
⚡️ PONDUSDT: A Trade Not Taken Is Better Than a Losing One
💼 STMXUSDT: 2 Buying Areas
🐢 TURBOUSDT: Buy Zones and Buyer Presence
🌍 ICPUSDT.P: Massive Upside Potential | Check the Trade Update For Seeing Results
🟠 IDEXUSDT: Spot Buy Area | %26 Profit if You Trade with MSB
📌 USUALUSDT: Buyers Are Active + %70 Profit in Total
🌟 FORTHUSDT: Sniper Entry +%26 Reaction
🐳 QKCUSDT: Sniper Entry +%57 Reaction
📊 BTC.D: Retest of Key Area Highly Likely
This list? It’s just a small piece of what I’ve been working on. There’s so much more. Go check my profile, see the results for yourself. My goal is simple: provide value and help you win. If you’ve got questions, I’ve got answers. Let’s get to work!

Bitcoin is BULLISHSee how Bitcoin did not take out the blue B leg, it also created bullish divergence on 4hr tf.

BITCOINBTC next reaction will be expected at 98K level. Once 98K is tapped we will see the reaction and decide if its further upside to down as an impulse

BTC Price Forecast: Will Accumulation Zones Lead to a 50% Surge?We are analyzing a BTC/USD weekly chart where the price is holding strong support above the rising trendline, marked in blue.
First Scenario:
After breaking out of the resistance trendline, the price rallied by 135%, as shown in the first green box. Notably, there was a small accumulation phase in the red-marked zone before the breakout.
Second Scenario:
Currently, the price is steadily moving upward, forming another small accumulation zone within the red-marked area. This pattern suggests a potential continuation of the bullish trend.
Outlook:
Based on these observations, the price could potentially rise an additional 50% from current levels. The Stochastic RSI supports this view, aligning well with the momentum seen in both scenarios.
Conclusion: The strong trendline support, recurring accumulation zones, and favorable momentum indicators point to further upside potential.

Bitcoin BTC Has Almost Finished Correction: $89k soon!Hello, Skyrexians!
In our recent analysis we told that this correction will not be finished without reaching GETTEX:89K , it almost impossible! Several days ago BINANCE:BTCUSDT surges above $102k which caused a lot of optimism on the market, but all these traders has been banished by the sudden dump. Why this drop was expected and promised GETTEX:89K will be reached anyway.
Let's take a look at the daily time frame. We can see the after reaching wave 3 top corrective wave 4 has been started. Wave 4 is a zigzag ABC. Corrective wave B has been finished exactly at 0.61 Fibonacci. Now price is forming wave C. This wave has the minimal target at 0.38 Fibonacci at $89k. There we can expect the signal on Bullish Reversal Bar Strategy to make sure with the high probability that correction is over and the next target is $120k. As always, alerts from this indicator are automatically replicated on my accounts. You can find the information in our article on TradingView . You can see the sniper entries for this indicator before.
Best regards,
Skyrexio Team
___________________________________________________________
Please, boost this article and subscribe our page if you like analysis!

BTC Consolidates Near Support Amid Bearish SignalsBitcoin is currently trading near a crucial horizontal support zone, as marked on the chart. The price recently pulled back from its highs, forming a bearish divergence on the RSI, which suggests weakening momentum. However, the key support level around $90,700–$92,500 is holding firm for now, providing potential for a bounce.
If BTC manages to sustain above this support zone, we could see a recovery attempt. However, a breakdown below this critical level might trigger further downside, with the next possible target around $85,000. Traders should closely monitor the RSI and volume for confirmation of either a bounce or a break below the marked support.
Bitcoin Idea!"🌟 Welcome to Golden Candle! 🌟
We're a team of 📈 passionate traders 📉 who love sharing our 🔍 technical analysis insights 🔎 with the TradingView community. 🌎
Our goal is to provide 💡 valuable perspectives 💡 on market trends and patterns, but 🚫 please note that our analyses are not intended as buy or sell recommendations. 🚫
Instead, they reflect our own 💭 personal attitudes and thoughts. 💭
Follow along and 📚 learn 📚 from our analyses! 📊💡"

637% BTC Profit Secured Ride the Crypto Wave with Us !!!!🎉 Profit Alert!
Our BTC Long Position has delivered exceptional returns, booking 637% profit (20x leverage) on a partial exit. If you've been following my insights and trade setups, you’re likely celebrating significant gains by now! 🪙💵
If you haven’t followed us yet, you’re literally missing out on life changing opportunities! i would say 😎
This is the power of disciplined trading and precise analysis. But we’re not done yet! The trade is still active with the remaining position, safeguarded by setting the Stop Loss (SL) at the Breakeven Price, ensuring risk free potential for further gains.
This is what we do consistently identifying opportunities and executing strategies to maximize profits. If you’ve benefitted, it’s time to spread the word! Share our page with your network, boost this post, and help us grow this community of successful traders.
Stay tuned for more high quality setups and actionable insights. The journey to financial success doesn’t end here it only gets better. 🚀
Here is where Traders Thrive
Thank you for your continued trust and support! 💪

Bitcoin is at a critical point - Consider this very seriously!!Hey family! Welcome to the wild world of cryptocurrencies, where the market can swing from one extreme to another in the blink of an eye. Crypto trading is known for its high volatility, which means prices can go up or down dramatically in short periods. Right now, many traders are buzzing with excitement, expecting Bitcoin to go on a bullish run. However, in such a dynamic market, it's always wise to consider the other side of the coin. Given the current sentiment, there's a good chance we might see some bearish moves too. So, while we're all hoping for the best, let's keep our eyes open for potential dips and prepare accordingly. Let's dive into today's analysis with that in mind!
Overview
This report provides a detailed technical analysis of Bitcoin (BTC) against Tether (USDT), focusing on the Ichimoku Cloud and chart pattern formation in combination.
Head and Shoulders Pattern
Pattern Description: The chart shows a Head and Shoulders pattern, which is a bearish reversal pattern following an uptrend. It consists of three peaks: the left shoulder, the head, and the right shoulder.
Identification on Chart:
Left Shoulder : Formed around mid-November.
Head : Formed in Mid December, peaking at approximately $108,000+.
Right Shoulder: Currently forming as of Jan 10, 2025, with a peak slightly lower than the head formed on Jan 7th.
Neckline : The neckline is drawn at the price level where the dips occur between these peaks and it is a wise choice to take the price zone as a whole in to consideration instead of just a specific price level. By this the neckline zone can be taken as between $89,800 & $92,400. A breakout below this level suggests a strong trend reversal.
Ichimoku Cloud Analysis
The Ichimoku Cloud, or Ichimoku Kinko Hyo, provides insights into support/resistance, momentum, and trend direction .
Here's the breakdown:
Kumo (Cloud): The cloud is formed by two lines, Senkou Span A and Senkou Span B, projected 26 periods into the future.
Current Cloud: The price has recently broken below from the upper cloud support, which was acting as support, and heading to the bottom of the cloud. This breakout below the cloud is a bearish signal indicating potential further downside.
Future Cloud : The future cloud (shaded area ahead) is sloping upwards, which traditionally would suggest bullish momentum, but given the current price action below the cloud and the reddish color it created, it might imply a false bullish signal or a potential resistance if the price attempts to recover.
Tenkan-sen (Conversion Line) and Kijun-sen (Base Line):
Tenkan-sen : This line (blue) is the average of the highest high and lowest low over the last 9 periods. It's currently below the Kijun-sen, reinforcing the bearish sentiment.
Kijun-sen: This line (red) is the average of the highest high and lowest low over the last 26 periods. The price is below both lines, indicating bearish momentum.
Chikou Span (Lagging Span) : This line shows the current price action shifted back 26 periods, providing a historical perspective.
Position: The Chikou Span is below the price action from 26 periods ago, which is another bearish signal.
Kijun-sen Cross : The Tenkan-sen crossing below the Kijun-sen while both are below the cloud strengthens the bearish outlook.
Key Price Levels
Breakout Level: $89,800 (Neckline)
Current Price: Around $92,750
Resistance: Cloud top around $95,000 - $97,000 - $100,000.
Support : Below the neckline, potential support around $85,000 to $82,000.
Volume Analysis
Volume: While high/average volume during the formation of the head might suggests strong participation, the volume during the right shoulder formation is lower, possibly indicating reduced buying interest.
Last Note : As a confluence the Trend Strength Index is also showing a declining movement both the weekly and daily charts even though it it at floor levels on the 4 Hr chart. This basically tells us that we might see some dip movements in the following days if volume continue dumping like it does in the past 3 1D candles.
Conclusion
Using the Ichimoku Cloud, we observe several bearish signals for Bitcoin:
The price is below the cloud, indicating bearish momentum.
The Tenkan-sen is below the Kijun-sen, and both are below the cloud, reinforcing the bearish trend.
The Chikou Span is below past price action, further confirming the bearish scenario.
Despite the future cloud showing an upward slope, the current price action suggests a continuation of the downtrend, with the Head and Shoulders pattern serving as a strong bearish indicator. Traders should consider this analysis in light of overall market conditions, keeping in mind that while the Ichimoku provides comprehensive insights, market sentiment and external factors also play crucial roles. Watch for any potential retest of the neckline or cloud for further confirmation of the trend.
But instead of the bearish breakout to the downward, if Bitcoin can rebound from the current price level, it is going to be yet another strong bullish move for a formation of a megaphone which is unlikely though.
For risk management, always consider using stop-loss orders, especially in volatile markets like cryptocurrency.
Stay Tuned for further updates.
With Regards.
CTE.
