BitcoinBTCUSD ( Bitcoin / U.S Dollar )
Bullish Channel as an corrective pattern in Short Time Frame
Fibonacci Level - 78.60%
Break of Structure
Strong Resistance Level
Change of Characteristics
Btcupdate

Bitcoin Sits at Key Support Level Bitcoin price remained under pressure, forming a head and shoulders pattern, even after major purchases by companies like MicroStrategy and Tether. The BTC/USD pair remained below 95,000, meaning that it has retreated by over 13% from its highest point this year. Bitcoin fell even after MicroStrategy and Tether bought more Bitcoins, a sign of confidence for the coin. MicroStrategy bought 2,138 coins, bringing the total holdings to 446,400. Tether bought more coins, bringing the total holdings to 82,454. At the same time, spot Bitcoin ETFs continued seeing inflows. Bitcoin fell because of the ongoing risk-off ...

BTC dip buy could be coming read captionIt sounds like you're referring to the potential opportunity to buy Bitcoin (BTC) during a market dip, as fear and uncertainty in the market often drive prices lower. This strategy is commonly known as "buying the dip."
Here are some considerations if you're thinking about this:
1. Market Sentiment
Fear, uncertainty, and doubt (FUD) can create opportunities to buy BTC at a discount. Keep an eye on news, market trends, and sentiment indicators like the Crypto Fear & Greed Index.
2. Technical Analysis
Look for support levels or areas where BTC has previously bounced back.
Use tools like RSI (Relative Strength Index) to identify oversold conditions.
3. Risk Management
Only invest what you can afford to lose, as BTC can be highly volatile.
Consider dollar-cost averaging (DCA) to reduce the impact of short-term price fluctuations.
4. Cloud Mining or Storage
If you're referring to cloud services, ensure they're reputable before investing in mining or storage solutions. Many scams exist in this space.
Would you like help analyzing current BTC trends or guidance on tools for tracking crypto prices? c

Ether Poised to Outshine Bitcoin in 2025: A Deep Dive
The cryptocurrency market is a dynamic and ever-evolving space, with Bitcoin and Ether leading the charge. While Bitcoin has long held the crown as the dominant cryptocurrency, Ether, the native cryptocurrency of the Ethereum network, is increasingly being seen as a strong contender for future growth and potential market dominance. Several factors suggest that 2025 could be the year that Ether truly comes into its own, potentially outperforming Bitcoin in terms of price appreciation and adoption.
Ethereum's Technological Advancements
Ethereum's shift to a proof-of-stake (PoS) consensus mechanism with the Merge in 2022 was a landmark event. This transition significantly reduced Ethereum's energy consumption and laid the groundwork for future scalability improvements. The upcoming "Surge," "Verge," "Purge," and "Splurge" upgrades aim to enhance Ethereum's transaction processing capabilities further, making it more efficient and cost-effective for users. These technological advancements are crucial for Ethereum's long-term growth and its ability to handle increasing transaction volumes.
The Rise of Decentralized Finance (DeFi) and NFTs
Ethereum's blockchain serves as the foundation for a vast ecosystem of decentralized applications (dApps), including DeFi protocols and non-fungible tokens (NFTs). The DeFi sector has witnessed explosive growth in recent years, with Ethereum leading the way in terms of total value locked (TVL). NFTs have also gained immense popularity, with Ethereum being the primary platform for their creation and trading. The continued growth of these sectors is expected to drive demand for Ether, as it is the primary currency used within the Ethereum ecosystem.
Institutional Adoption and Regulatory Clarity
Institutional investors are increasingly showing interest in the cryptocurrency market, and Ethereum is attracting a significant portion of this attention. The approval of spot Ether ETFs in mid-2024 has further legitimized Ether as an investment asset, making it more accessible to both institutional and retail investors. As regulatory clarity surrounding cryptocurrencies improves, institutional adoption is expected to accelerate, further driving demand for Ether.
Bitcoin's Limitations and Challenges
While Bitcoin remains the most well-known cryptocurrency, it faces certain limitations that could hinder its growth potential. Bitcoin's primary use case is as a store of value and a digital currency, while Ethereum offers a much broader range of functionalities through its smart contract capabilities. Additionally, Bitcoin's energy-intensive proof-of-work (PoW) consensus mechanism has raised environmental concerns, which could become a more significant issue as regulatory scrutiny on cryptocurrencies intensifies.
Ether's Potential for Outperformance
Several analysts and industry experts believe that Ether has the potential to outperform Bitcoin in 2025. The combination of Ethereum's technological advancements, the growth of DeFi and NFTs, increasing institutional adoption, and the limitations of Bitcoin's technology could create a perfect storm for Ether's price appreciation. While Bitcoin is expected to continue its growth trajectory, Ether's unique value proposition and its central role in the expanding Web3 ecosystem could give it a significant edge.
Conclusion
The cryptocurrency market is known for its volatility, and predicting future price movements with certainty is impossible. However, based on the current trends and developments, Ether appears to be well-positioned for significant growth in 2025. The Ethereum network's ongoing technological advancements, its thriving ecosystem of dApps, and the increasing interest from institutional investors all point towards a bright future for Ether. While Bitcoin will likely remain a dominant force in the cryptocurrency market, Ether's potential for outperformance in 2025 cannot be ignored.
Disclaimer: This article is for informational purposes only and should not be considered investment advice. The cryptocurrency market is highly volatile, and investors should conduct their research and consult with a financial advisor before making any investment decisions.


Bitcoin (BTC): Is $83K Just the Start of a Bigger Drop?Bitcoin is showing signs of heading lower, and the next few levels could be make-or-break. Let’s break it down simply so you know what to watch.
What’s Happening Right Now?
The market’s pointing downward, and we’re eyeing FWB:83K –$85K as the first target. If BTC doesn’t hold there, things could get rough.
Where BTC Could Go Next
- FWB:83K –$85K: This is the next stop. If Bitcoin can’t bounce here, the selling could pick up.
-$70K: A deeper drop, and a key support level where buyers might step in.
-$55K: The worst-case scenario for now, but also a spot where we could see some recovery.
The Big Picture
We’re also seeing a head and shoulders pattern, which is a strong clue that prices might keep dropping. Let’s wait and see how the market reacts as we approach FWB:83K –$85K.
What’s the Plan?
-Watch FWB:83K –$85K carefully—it’s the first key level.
-If BTC doesn’t hold, prepare for $70K or even $55K.
-Be patient and trade what you see, not what you hope.
If you liked this breakdown, hit like or follow. Got questions about Bitcoin or another chart? DM me—I’d love to help.
Feeling stressed about trading or struggling with burnout? Let’s chat. I’m here to help you stay focused and balanced so you can trade with confidence. Let’s tackle this together!
Kris/ Mindbloome Exchange
Trade What You See

Expired BTC.USD Weekly outlook. 1st WK JAN 2024Expired BTC.USD Weekly outlook. 1st WK JAN 2024
> BEARISH 📉 HIT
Prior Week Closed Price: 96,904
This Week Target Price: 92,883
Strike Price: 92,501 on DEC 30, 2024
Upper Range: 102,843
Lower Range: 82,922

BTC Dominance updateHere’s a simplified version of the explanation:
---
**BTC Dominance Update: Key Insights**
This chart shows the movement of Bitcoin dominance over time, highlighting important patterns and potential scenarios:
1. **Resistance Line**:
- BTC dominance has reached a long-term resistance line (Point B), where it’s likely to face rejection.
2. **Wedge Break**:
- The ascending wedge pattern has broken down (Point A), which is usually a bearish signal.
3. **Next Move (ABC Pattern)**:
- There’s a possible ABC correction forming, with dominance likely to drop further towards lower support levels (Point C).
4. **Market Impacts**:
- If BTC dominance falls, altcoins might perform better, offering opportunities in the altcoin market.
**Conclusion**:
Keep an eye on the key resistance and support levels shown in the chart. These movements will provide clues for Bitcoin and altcoin trends.
---

BitcoinBTCUSD ( Bitcoin / U.S Dollar )
Order Block
Bullish Channel as an corrective pattern in Long Time Frame
Completed " 12345 " Impulsive Waves
Break of Structure
Change of Characteristics

BTC at a Critical Juncture: Should You Top Up Your Long Position🚨 BTC at a Critical Juncture: Should You Top Up Your Long Position? 🚨
Bitcoin's price action looks fragile as we enter the year's final days. With BTC hovering near the $92,000 - $87,000 support zone , traders are closely watching whether this key area will hold — or if a break below $90,000 will open the floodgates for further downside.
The Setup: What's Happening Now?
BTC is trading at $93,070 , testing major support.
Failing to hold $92,000-$87,000 could invalidate bullish setups and signal a bearish reversal.
The market is thin due to the holiday season, increasing the risk of snap volatility and liquidity sweeps .
Key Factors to Watch
1. Critical Support Zone:
The $92,000 - $87,000 range is where buyers have historically stepped in to push BTC higher.
A break below $90,000 would be a bad sign for BTC and may lead to downside targets of nearly $80,000 .
2. Indicators:
Momentum Reversal Indicator (MRI): No strong bullish reversal signal yet. Look for a Green Setup progression or daily price flip confirmation.
RSI: If RSI approaches oversold levels (~30), it could signal an opportunity to DCA or add to your long position.
3. Macro Risks:
Upcoming unemployment data may inject volatility into an already illiquid market .
The broader risk-asset sentiment remains cautious, with global liquidity conditions weighing on bulls.
Trading Decision: Should You Add to Longs?
Yes, IF:
BTC successfully tests and rebounds from $92,000 - $87,000 .
Look for supporting signals like a Green Setup progression or bullish divergence on RSI.
No, IF:
BTC breaks below $90,000 on high volume.
This would invalidate the current support zone, signaling more downside potential.
Risk Management Tips
Stop-Loss: Place it just below $87,000 to minimize risk.
Take-Profit: Target $95,000 - $100,000 , but scale-out gradually if resistance strengthens.
Leverage: Use 2x leverage cautiously , ensuring proper risk control.
Closing Thoughts
BTC is at a make-or-break moment. The $92,000 - $87,000 support zone could be a solid entry point for long positions if it holds — but a breakdown would bring downside targets like $80,000 into play.
What's your take on BTC's price action this week? Are you adding to your long position or waiting for confirmation? Let's discuss this in the comments below! 👇

Bitcoin back to 70K?Bitcoin Heading toward to 70K, On Daily TF CISD, But Monthly Candle Also Closing in Previous Candle Range. No More Bullrun

BTC DOM wants to grab liquidity before fallBTC DOM wants to grab liquidity before fall. This means Dump for Alt coins is coming

BTC view to 86k!BTC from BBMA point of view
Daily is valid CSAK Sell with clear momentum sell in H4.
As for now; H4 is having re-entry sell at its MA High is aiming for lower BB at 93500 in short term.

Is BTC Preparing for a Bearish Move?Look at the 1H chart and i see bearish flag and pole pattern... what you think?

Bitcoin's Path: $70K Correction Imminent
Alright, let's use the historical data on that BTC/USD weekly chart as a foundation for my forecast. After seeing the way Bitcoin has moved in the past, I want to use that data to make some educated guesses on what might happen next.
Key Points from Our Historical Analysis
Here are the key points I'm using for my forecast:
Large Bull Cycles: Bitcoin has shown the ability to make huge moves upwards, with gains reaching 500% or more. I will be mindful of this upside potential as a key point of my plan.
Significant Corrections: Every major bull run has always been followed by a major correction, often with drawdowns of 50%, or even 80%. I understand that these corrections are not random, they are part of the natural price action of BTC.
Recent Move: The recent move to 100k was a major sign of bullish activity.
My Bitcoin Forecast:
Based on these historical patterns and my understanding of market dynamics, here's my outlook for the next major move for Bitcoin:
Anticipated Correction: Given the recent strong move, and the fact that we are entering the $100k psychological price point, I anticipate a significant pullback from current levels. I want to see a test of the $80k range, and possibly even the $60k range.
Estimated Drawdown: Based on prior drawdowns, I expect to see a retracement of at least 30%-50% from the recent high (100k), which can bring the price down to a range between $50,000 and $70,000.
Next Bullish Upside: After this retracement, I anticipate another bull phase. The percentage gained on these next phases may be less than the previous, but there is still potential for a massive move. I will be looking for confirmation of a reversal in trend before I jump back into a trade.
Potential Upside Target: If this retracement does not go below the 60k mark, and then moves upwards, I would then start to target $150,000 as a mid term target.
My Strategy for the Coming Months:
Patience: I will be patient, and I will not chase the price upwards. I will wait for the market to confirm a clear trend before placing any new trades.
Risk Management: I will be using a stop loss at all times, to manage my risk during these periods of high volatility.
Confirmation: I will wait for the technical indicators and price action to confirm any upside moves.
Important Notes:
Not Exact Science: This is a forecast and not an exact science. No one can predict the future. This is simply an estimate using technical analysis to show the most probable outcome.
External Factors: Other factors not shown in the chart, such as news events and market sentiment may have an impact to prices.

BTC pullback before inauguration?Merryy Christmas guys and upcoming New Year!
Seems like we gonna meet New Year w BTC lower than100k...
Looks a bit scary, but here is in short what we have:
1) Daily MA cross. Which is bearish sign
2) Divergence between raising BTC channel and volumes
3) If the price will follow the red line move, it will form double top pattern 🥲
My expectations: I think we could correct to Fib zone around 0,236 (87k zone) and after we should check. But anyway seems like correction should happen before to continue growing and this we most likely gonna see after inauguration.
What you think guys? Help me dispel this scary picture 😅

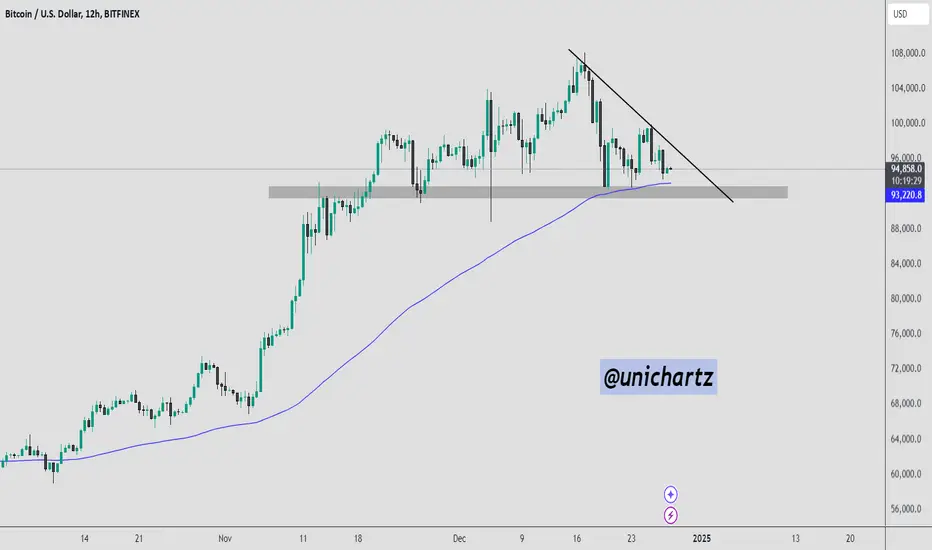
Bitcoin Battles Between Key Support and Resistance – What’s NextBitcoin is currently trading near $94,500, resting on a strong confluence of support. The price is testing the 100 EMA on the 12-hour chart, which aligns with a critical horizontal support zone around $93,000. At the same time, a descending trendline is acting as resistance, keeping the price under pressure.
A breakdown below the marked support zone could trigger a sharp decline toward the next significant level around $88,000. On the other hand, if BTC holds this support and breaks above the descending trendline, it could signal a bullish reversal, pushing the price back toward $98,000 and potentially higher.
BTC shows a 6% potential in the last 3 days of 2024.It seems we are back to the initial thesis, which is great since we already profited from the previous trade entry. Now, it feels like we’re seeing the same situation unfold again. Key indicators such as the Bollinger Bands, the 50-day moving average, the volume spikes from November 13th, sufficient corrections, and the support lines are all aligning similarly.
On a fundamental note, I’d like to add the following: with just three days left until the end of 2024, there’s the “Santa Rally” phenomenon, along with the prevailing sentiment in crypto communities that it would be exciting to close the year with BTC reaching $100k. Such a milestone could act as a psychological boost, potentially fueling a strong movement for the entirety of 2025.
The $100k level is also a significant psychological barrier. Taking all this into account, I believe this is a good opportunity to enter a position with the potential for short-term profit—up to 6%—over the next few days.
However, we need to take into account the 80% correlation with the S&P 500, which is currently at its peak levels. That said, hedge funds and institutional investors are closing deals to meet their KPIs, which could provide additional support.
Hopefully, this will sustain the overall positive vibe for the last 3 days of the year.
Yours sincerely,
Mister iM

Tide Turning For Bitcoin? Reserves And Netflows Show ReversalBitcoin, the world's first and most well-known cryptocurrency, has experienced a rollercoaster ride since its inception. From its meteoric rise to its dramatic crashes, Bitcoin has remained a topic of fascination and debate for investors and financial analysts alike. In recent times, several factors have contributed to a sense of uncertainty surrounding Bitcoin's future, including regulatory scrutiny, market volatility, and concerns about its environmental impact. However, recent developments, such as increasing institutional adoption and positive netflows, suggest that the tide may be turning for Bitcoin.
Bitcoin Institutional Adoption Accelerates as ETFs Show Investor Appetite
One of the most significant indicators of Bitcoin's growing acceptance is the increasing interest from institutional investors. Traditionally, institutional investors have been hesitant to invest in Bitcoin due to its volatile nature and lack of regulatory clarity. However, as the cryptocurrency market matures and regulatory frameworks become clearer, more and more institutions are beginning to see the potential of Bitcoin as an investment asset.
This growing institutional interest is reflected in the recent surge in for Bitcoin exchange-traded funds (ETFs). ETFs are investment funds that track an underlying asset, such as a stock index or a commodity. They offer investors a convenient way to gain exposure to an asset without having to directly own it.
Recent Reserves and Netflows Indicate Market Reversal
In addition to increasing institutional adoption, recent data on Bitcoin reserves and netflows also suggest that the market may be reversing. Bitcoin reserves refer to the amount of Bitcoin held on cryptocurrency exchanges. A decrease in Bitcoin reserves indicates that investors are withdrawing their Bitcoin from exchanges, which is often a sign of accumulation and a bullish signal.
Netflows, on the other hand, refer to the difference between the amount of Bitcoin entering and leaving exchanges. Positive netflows indicate that more Bitcoin is entering exchanges than leaving, which can be a sign of selling pressure and a bearish signal.
Recent data shows that Bitcoin reserves have been declining, while netflows have turned positive. This combination of factors suggests that investors are accumulating Bitcoin and that selling pressure is decreasing. These are both positive signs for the Bitcoin market and could indicate that a reversal is underway.
Bitcoin Price Analysis: Navigating Volatility and Key Levels
Despite these positive developments, Bitcoin's price remains volatile and subject to market fluctuations
It has been noted a potential 'head and shoulders' pattern, a bearish technical indicator, which could lead to a significant price drop. This pattern suggests that Bitcoin's price could fall to as low as $80,000.
However, there maintain a more bullish outlook, emphasizing the importance of the $90,000 level. It is argued that if Bitcoin can maintain this level, it could pave the way for further price appreciation. Conversely, if Bitcoin fails to hold this level, it could trigger a sell-off and push the price down to $80,000.
Conclusion: A Cautious but Optimistic Outlook for Bitcoin
In conclusion, several recent developments suggest that the tide may be turning for Bitcoin. Increasing institutional adoption, as evidenced by the surge in Bitcoin ETF filings, indicates a growing acceptance of Bitcoin as an investment asset. Positive netflows and declining reserves further support this notion, suggesting that investors are accumulating Bitcoin and that selling pressure is decreasing.
However, it is important to remain cautious. Bitcoin's price remains volatile, and various factors could impact its future performance.13 The cryptocurrency market is still relatively young and subject to regulatory changes, technological advancements, and shifts in investor sentiment.
Therefore, while the recent developments are encouraging, it is crucial to approach Bitcoin with a balanced perspective. Investors should conduct thorough research, understand the risks involved, and make informed decisions based on their individual circumstances and risk tolerance.
Overall, the outlook for Bitcoin appears cautiously optimistic. The increasing institutional adoption, positive netflows, and declining reserves suggest that the market may be reversing. However, it is important to remain vigilant and adapt to the ever-changing dynamics of the cryptocurrency market.

Bitcoin Faces Key Test: Will It Bounce or Drop to $85K?#Bitcoin is staying above the 0.236 Fibonacci retracement level at $94,300, with the 50-day moving average near $93,000 providing support.
If these levels hold, CRYPTOCAP:BTC could start moving up again toward $108,000. But if it drops below, it might fall to the 0.382 Fibonacci level at $85,600.
Watch these key levels for Bitcoin's next move!
DYOR, NFA
#Crypto

BTC Gaining StrengthOn the 4hr timeframe BTC shows increasing momentum with price making higher lows, and RSI making higher lows - both an indication of gaining momentum.
On the daily timeframe BTC shows hidden bullish divergence as price is making higher lows, while RSI shows lower lows.
Both timeframes point towards an indication that we could be at bottom already.
Get ready for a new year rally!

Back to the Roots: BitcoinAs predicted in the previous analysis, Bitcoin was rejected at **$100k** and is now approaching a cycle low. 📉
📊 Current Analysis:
❌ We’re not at the bottom yet, and it’s not time to buy.
🔵 The 1-day indicator (dark blue line) is currently at **68** and looks poised to reverse to the downside, signaling a potential cycle break.
⏳ Even if this doesn’t happen, the 1-day cycle will need approximately a week to return to the **20 range**, marking Bitcoin’s 60-day cycle low.
📍 The low could form anywhere between **$85k and $91k**.
💡 Remember: **Cycles don’t predict prices; they provide timing bands for tops and bottoms.**
🔮 Next Cycle Outlook:
⚠️ The upcoming 60-day Bitcoin cycle doesn’t look promising:
1️⃣ The **1-week indicator** spent a significant amount of time above **80** and is now trending downward.
2️⃣ This cycle reflects the general trend for the next 1-2 months and currently leans **bearish**.
3️⃣ We may need more time before the market reverses to the upside.
✨ Despite this, there are intriguing opportunities in the market right now. More details are available in the **Premium group**.
✅ Stay safe, trust the cycles, and build your wealth.💪
Let me know if you’d like further tweaks! 🚀

Bitcoin at a Crossroads: Testing Key TrendlinesBitcoin’s current price action places it at a decisive technical level, where historical and recent trendlines converge. This area holds significant implications for the future direction of the market.
🔍 Key Observations from the Chart
The Two Trendlines in Focus
Old Trendline: This line, originating from the previous bull market, acts as a critical long-term support. Its historical significance makes it a widely-watched level for market participants.
Young Trendline: This trendline represents the momentum of the latest bullish recovery. A break here could signal a potential shift in sentiment.
Liquidity Cluster Around $92,500
A clear liquidity zone lies just below the current price. Such zones often attract price action as market makers seek to clear stop-losses or gather liquidity before determining the next move.
Imbalance Zones Below
Imbalances between $85,000 and $70,500 are visible on the chart. These areas represent inefficiencies in price action that could serve as potential targets if support levels fail.
🎯 Levels to Monitor
Support Levels:
Young Trendline (~$93,800): The first line of defense for bulls.
Old Trendline (~$93,800): A breach here would signal a deeper retracement.
Liquidity and Imbalance Targets:
Liquidity Zone: $93,000-$92,000.
Imbalance Zone 1: $85,000–$81,600.
Imbalance Zone 2: $74,400–$70,600.
Resistance Levels:
If BTC bounces, watch for reactions near $98,000 and $100,000 as short-term resistance.
🤔 What Could Happen Next?
Scenario 1: Support Holds
If the trendlines hold, BTC could see a recovery toward $98,000 or higher, maintaining its bullish structure.
Scenario 2: Break Below Support
A loss of the young and old trendlines may lead to a retest of the liquidity zone at $92,500.
If this level fails, the imbalance zones below become the next logical targets.
Volatility Ahead
With price so close to these key levels, whale activity and stop-hunting wicks are likely. Traders should prepare for possible fakeouts before the true direction becomes clear.
⚡ Key Takeaway
Bitcoin’s position near these converging trendlines makes this a crucial moment. Whether the supports hold or price dips to fill lower imbalances, the upcoming moves will provide important clues about market sentiment heading into the new year.
Patience and risk management are essential in this environment. Stay neutral, observe the price reaction to these levels, and let the market reveal its hand.
