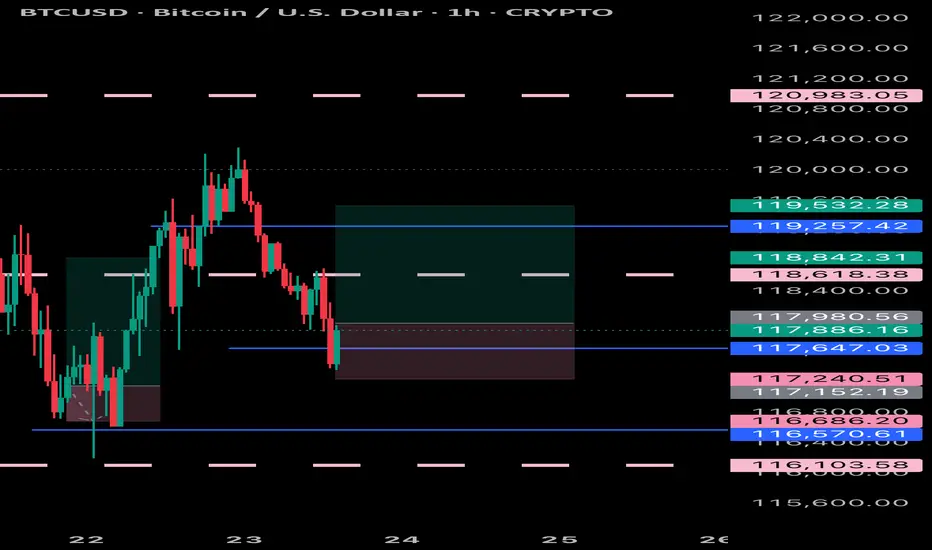
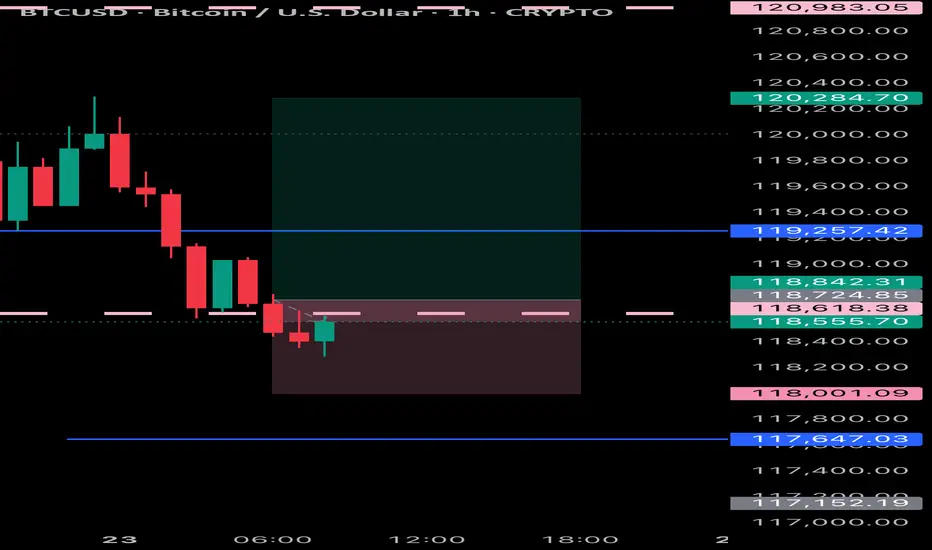
BITCOIN UPDATE Bitcoin seems to be preparing to fix its lows so it’s time to target a trade to the up side because, it had dropped to a fair amount of lows
BTCUSD-TRADE
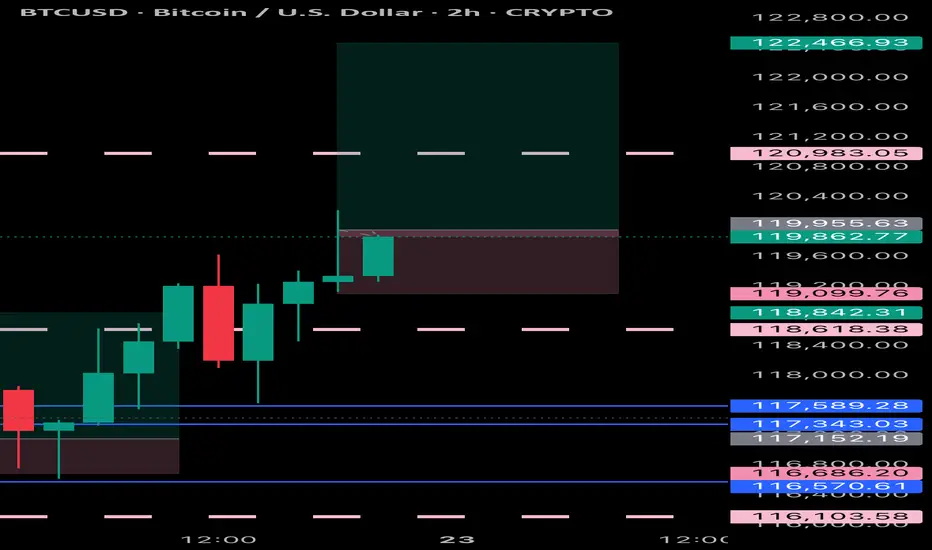
BTCUSD RECAPBITCOIN has preformed as expected in short period of time can continue even more to the up side but will wait for good entries
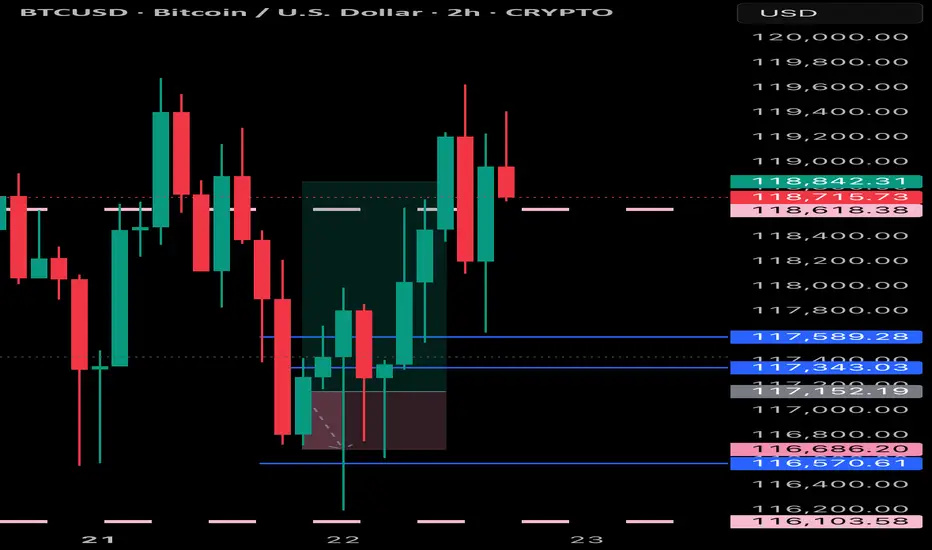
BTCUSD BTCUSD still expecting some good run within to the up side as there’s a new higher price that’s not been touched
BTCUSDTHi everyone
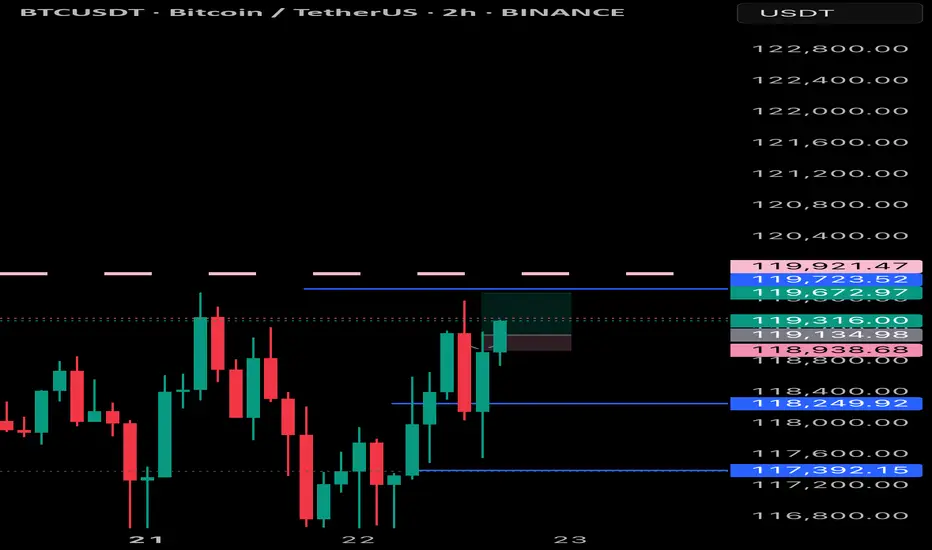
nice move , yeah!
here are the levels that you can consider in your trading.
In my opinion every correction could be a good opportunity to buy.
have fun
DYOR!

BTCUSD – continuing to buy as breakout confirms bullish setupBTCUSD is forming a classic “cup and handle” pattern, now breaking above key resistance. Price is holding within an upward channel, and if momentum stays strong, the next target could reach 160,000 and beyond.
It might seem hard to believe, but the structure points to continued bullish momentum. I’m not missing this opportunity and continue to build long positions as this breakout develops.

$$$ BTCUSD MACRO-BULLISH $$$ 1W CHART $$$BITFINEX:BTCUSD 1W Chart
There are many reasons to look at this weekly chart and see that there's absolutely no reason to be bearish on Bitcoin yet.
Holding strong r/s flip support.
Holding regression trend.
Holding parabolic trend.
Stoch RSI at the bottom.
Weekly bullish divergence.
Assuming this plays out in a way that's similar to the last local bottom, the current target is around $134k-$135k.
It would take a lot to invalidate all of these bullish indicators, but if that does somehow happen, with a CLOSE of the weekly candle that invalidated these, then It's pretty much definitely over for a loooong time.
NFA blah blah blah..

BTC/USD – Bearish Rejection, Targeting SupportChart Analysis:
BTC/USD is trading within a descending channel, showing a bearish trend.
Price recently tested the resistance zone but faced rejection.
A strong sell signal is indicated, suggesting a move towards the support level around $79,877.
If price breaks below support, further downside is possible.
Trading Plan:
Sell below resistance with a target at support.
Watch for confirmation signals before entering a position.
If price breaks above resistance, a trend reversal could be possible.

BTCUSD - Consolidation Likely to Resolve with Bullish BreakoutThe Bitcoin/USD 4-hour chart displays a consolidation pattern after recovering from the March lows near $77,000, with current price action hovering around $83,928. Following a recent test of resistance at $86,500, a minor pullback appears to be underway, but the higher probability move remains to the upside as indicated by the directional arrows on the chart. The price has been forming a series of higher lows since the March 11 bottom, suggesting accumulation and underlying bullish momentum. Key to this outlook is the strong support established by the blue reaction zone near $76,000-$78,000, which has successfully contained selling pressure. Traders should monitor for a potential shallow retracement before the anticipated push toward the orange resistance level at $87,650, which represents the next significant hurdle. A decisive break above this resistance would likely trigger an acceleration in buying momentum and confirm the bullish scenario, potentially opening the path toward retesting the $90,000-$92,000 region in the coming sessions.
Disclosure: I am part of Trade Nation's Influencer program and receive a monthly fee for using their TradingView charts in my analysis.

Btc scenario 1.1.2025For btc i am waiting for sfp confirmation if sfp is valid then it is likely that the price can start rising to a new ath if we are able to break through the monthly level at a price of around 96k then i see the closest tp around 100k and above 100k there is a large amount of liquidity

BTCUSD Try To Formation of Triangle 30M possible Blackout Mode In btcusdt or BTCUSD 30M time try to formation triangle
And make blackout mode
This for information you can use it for pattern find

BTCUSD BTCUSD
Open: 64000
SL: 63000
TP: 70000
==================================
Disclaimer: Any content in this text does not constitute investment advice. This text provides an objective description of the market situation and should not be considered an offer to sell or a solicitation to buy.
Any decisions made based on the information provided in this text are your personal responsibility. Any investments made or to be made should be analyzed based on your financial situation and personal goals.

Btcusd signal Bitcoin (BTC) is recognised as the world's first truly digitalised digital currency (also known as a cryptocurrency). The Bitcoin price is prone to volatile swings; making it historically popular for traders to speculate on. Follow the live Bitcoin price using the real-time chart, and read the latest Bitcoin news and forecasts to plan your trades using fundamental and technical analysis.

BTCUSD BULLISH TREND Hey there on 4hTF The BTCUSD has fallen today from 66000 to 64000 now also we can see bullish candle which is support area from 63300 and looking for there again buy side
So as we can enter for long position in these area

EURJPY BEARISH CANDLEHey there on 1htF the EURJPY looking for short area 165.700 and other short area 166.200
So we can see that can be manipulation candle and go downside like as waterfall
We observe from these areas can be now touch with bias and make your target

GBPJPY Bearish Candle Hey there on 1htF The GBPJPY has looking for downside now as there we can see it has continue has moving 191 to 194 so we can now again see downside area from here to reach target soon

Btcusd sell confirm signal Bitcoin (BTC) is recognised as the world’s first truly digitalised digital currency (also known as a cryptocurrency). The Bitcoin price is prone to volatile swings; making it historically popular for traders to speculate on. Follow the live Bitcoin price using the real-time chart, and read the latest Bitcoin news and forecasts to plan your trades using fundamental and technical analysis.
Bitcoin Price (BTC) Real-Time Live Price confirm Chart sell

Btcusd sell confirm Bitcoin (BTC) is recognised as the world’s first truly digitalised digital currency (also known as a cryptocurrency). The Bitcoin price is prone to volatile swings; making it historically popular for traders to speculate on. Follow the live Bitcoin price using the real-time chart, and read the latest Bitcoin news and forecasts to plan your trades using fundamental and technical analysis.
Confirm Chart sell

Bitcoin maybe a lower lowAnother lower low is possible to occur!
I have 3 reasons:
1- An important zone is broken.
2- Based on 2017 memory, It is possible for Bitcoin to come a bit lower.
3- A blue trend line is drawn, It is also possible to retouch the trend line.
On the other hand it is also possible for Bitcoin to not act same as 2017 and It can form an accumulation phase.

EURUSD - Long IdeaPrice (USD) has been so strong as of late, looking for a "reversion to mean" on this one. This is my trade idea.
Here is the trade idea narrated.
1% Risk 2:1RR
Happy Trading.

BTC possible Long setup.As I wrote days ago, nothing changes from my bias.As long as 19000 holds I will still be expecting BTC to take out EQH of 20500 on 4hr &1hr timeframe and the Daily FVG of around 21500 or possibly 22000.
Possible Long entry 18600; reason: unmitigated OB around that price range.

BNX: GOING ON THE CYCLE WAY Small update for BNX.
The coin is still in the green cycle.
The question is only when we are going to break out above 200 USD
188/232/332 are important targets.
