Bitcoin Soars Past $122K, But a "Digital Fort Knox" Threat LoomsThe cryptocurrency market is in the throes of a historic rally, a tidal wave of capital and confidence that has propelled Bitcoin beyond the formidable $122,000 mark. Now trading within 1% of its all-time high, the world’s premier digital asset is riding a powerful current shaped by two monumental events: a surprisingly favorable executive order from the White House and a relentless cascade of inflows into spot Bitcoin ETFs. This surge has ignited euphoria across the financial world, with even the second-largest cryptocurrency, Ether, touching highs not seen since its 2021 peak.
Yet, beneath the glittering surface of this bull run, a profound and unsettling question is taking shape. As institutional giants and corporate treasuries embrace Bitcoin, some of its most astute observers are sounding an alarm. They warn that this corporate adoption boom is creating a path that looks eerily similar to the one gold traveled in the 20th century—a path that ended with its effective nationalization and centralization in the vaults of Fort Knox. This growing concern posits that Bitcoin’s greatest triumph, its integration into the mainstream financial system, could become its ultimate vulnerability, presenting a new and potent centralization threat that challenges the asset's very soul. The market is now caught between the thrill of unprecedented price discovery and the chilling possibility that it is witnessing the rise of a digital Fort Knox.
The Anatomy of a Rally: A Perfect Bullish Storm
The recent price explosion was not a random event but the result of a powerful confluence of factors that have systematically validated Bitcoin’s role in the global financial landscape. The market sentiment has been overwhelmingly positive, driven by a one-two punch of regulatory encouragement and undeniable institutional demand.
First, a landmark executive order from the White House sent a clear signal that the United States is moving towards a framework of integration rather than opposition for digital assets. The order, widely seen as pro-crypto, has initiated a formal exploration of how to safely incorporate cryptocurrencies into the bedrock of American wealth: 401(k) retirement plans. For years, regulatory uncertainty has been the single greatest barrier holding back a true institutional deluge. This directive acts as a powerful de-risking event, providing a level of clarity and legitimacy that large-scale investors have been desperately seeking. The potential to unlock even a small fraction of the trillions of dollars held in retirement accounts has sent a jolt of optimism through the market, assuring corporations and funds that they are investing in an asset class with a government-acknowledged future.
Second, while the executive order provided the strategic tailwind, the tactical buying pressure has come directly from spot Bitcoin ETFs. These regulated financial products, which allow investors to gain exposure to Bitcoin through a traditional brokerage account, have been an unprecedented success. In a stunning display of demand over the last week, these funds have absorbed hundreds of millions of dollars in net inflows on consecutive days. To issue new shares, these ETFs must purchase the underlying Bitcoin from the open market, creating a massive and constant source of demand. This dynamic acts like a supply shock; as billions of dollars from mainstream investors flow through ETFs to chase a finite number of available coins, the price is algorithmically forced upward. The flow of funds into these products has become one of the most closely watched metrics, serving as a real-time indicator of institutional appetite and a direct driver of price action.
The Ghost of Gold: A Historical Warning for a Digital Age
Even as investors celebrate this new era of institutional acceptance, a chilling historical parallel offers a cautionary tale. The concern, articulated by prominent on-chain analysts, is that Bitcoin’s current trajectory is mirroring the centralization of gold that occurred in the United States, a process that ultimately subjected the precious metal to complete state control.
To grasp the gravity of this comparison, one must look back to President Franklin D. Roosevelt's Executive Order 6102, signed in 1933. Amidst the Great Depression, the order made it illegal for U.S. citizens to privately hold significant amounts of gold coins or bullion, compelling them to turn over their holdings to the Federal Reserve. The stated goal was to stabilize the economy, but the result was the mass transfer of a decentralized monetary asset from the hands of the people into the centralized vaults of the U.S. government. The nation's gold was consolidated, most famously at Fort Knox, giving the state absolute control over the physical supply.
Decades later, in 1971, President Richard Nixon delivered the final blow. With the "Nixon Shock," he unilaterally severed the U.S. dollar's convertibility to gold, effectively ending the Bretton Woods system that had anchored global finance. Having already secured control of the physical asset, the government was then free to change the rules of the system it underpinned.
The argument today is that Bitcoin could face a similar, albeit modern, fate. A 21st-century "nationalization" would not involve government agents seizing hardware wallets. It would be a far more sophisticated and systemic takeover, executed through the very financial instruments and institutions that are currently being praised for driving the bull market. The end result could be a scenario where a significant portion of the Bitcoin supply, while technically on a decentralized network, is effectively controlled by a handful of state-sanctioned entities.
This digital "Fort Knox" could be constructed through several vectors. The majority of Bitcoin purchased by ETFs and large corporations is not held in self-custody. Instead, it is entrusted to a small number of large, regulated custodians. These firms represent centralized points of control. A government could easily exert legal and regulatory pressure on these few custodians, compelling them to freeze, block, or even seize the assets they manage on behalf of millions of investors.
The ETFs themselves are a primary vehicle for this potential centralization. By concentrating hundreds of thousands of Bitcoin under the management of a few powerful financial firms like BlackRock and Fidelity, they make the asset supply vastly easier to regulate and control. It is far more efficient for a state to influence a handful of ETF issuers than to police millions of individual Bitcoin holders around the world.
Finally, the public companies that have famously added Bitcoin to their balance sheets are also part of this equation. As regulated entities, they must comply with government mandates. A state could enact policies that influence or dictate how these systemically important corporate treasuries are managed, effectively bringing them under state influence without ever formally seizing the assets.
Bitcoin’s Inherent Defense: Can Decentralization Hold the Line?
While the historical parallel to gold is compelling and sobering, it is not a perfect one. Bitcoin possesses unique technological attributes that provide a powerful defense against the kind of centralization that befell gold.
The most fundamental defense is the power of self-custody. Unlike gold, which is a physical object that is cumbersome to store and move securely, Bitcoin is pure information. An individual or entity that controls their own private keys holds a sovereign asset that is incredibly difficult to confiscate without their cooperation. This ability to "be your own bank" remains a powerful counter-force to the trend of custodial reliance.
Furthermore, the Bitcoin network is a globally distributed system. Miners, nodes, developers, and users are spread across dozens of countries, operating under a multitude of legal jurisdictions. No single government can unilaterally control the network or dictate its rules. An attempt by one major nation to implement draconian controls would likely trigger a mass exodus of capital and talent to more favorable jurisdictions, a powerful economic disincentive against overreach. The current global competition among nations to become "crypto hubs" demonstrates that governments are aware of this dynamic and are incentivized to create attractive, rather than punitive, regulatory environments.
This tension may ultimately lead to the bifurcation of the Bitcoin market. One tier could consist of the regulated, "paper" Bitcoin—held in ETFs and by public corporations, fully compliant, but subject to the rules and potential control of the traditional financial system. The other tier would be the sovereign, "physical" Bitcoin—held in self-custody by those who prioritize censorship resistance and decentralization above all else.
A Future Forged in Conflict
As Bitcoin knocks on the door of a new all-time high, the market is caught in a powerful paradox. The institutional adoption that has legitimized Bitcoin and driven its price to stratospheric levels is the very same force that introduces a systemic risk to its core principles. The celebration of the current rally is, in essence, a celebration of the construction of the very infrastructure that could be used to co-opt it.
The journey to $122,000 was paved with institutional capital and regulatory acceptance. The journey forward will be defined by a fundamental conflict: the battle between mainstream financial integration and the preservation of the decentralized ethos that made Bitcoin a revolutionary technology. The future of the world's most important digital asset will be forged in the crucible of this tension, determining whether it remains a truly sovereign asset for the people or becomes another tool in the arsenal of the centralized systems it was designed to disrupt.
Btcusdanalysis

Btc anticpated downside - short term price action explainedHere is a 15 min chart to follow up on the daily chart below (chart originated Aug 9th)
Now that my uspide has hit (within 1% and within the expected timeframe)... I have outline the anticipated path down to my lower target (red) T1.
I will turn very bullish after my red target gets hit.
May the trends be with you.

BITCOIN BULLS ARE GONNA DO THIS NOW!!!! (Fakeout Wick) Yello Paradisers! In this video, I've been updating Bitcoin price action and the Elliot Wave theory. I've been doing lots of advanced technical stuff. We've been going through channeling and updating ourselves about the most important support and resistance levels. We've been taking a look at the MACD histogram, the RSI, and the stochastic RSI. We've been professionally analyzing the volume; we've understood who is in power right now and what's going to happen next with the highest probability.
We've also been taking a look at what kind of confirmations we are waiting for in order for us to be able to open long or short positions.
Paradisers, make sure that you are trading with a professional trading strategy. Wait for confirmations, play tactically, and focus on long-term profitability, not on getting rich quick.
Remember, don’t trade without confirmations. Wait for them before creating a trade. Be disciplined, patient, and emotionally controlled. Only trade the highest probability setups with the greatest risk to reward ratio. This will ensure that you become a long-term profitable professional trader.
Don't be a gambler. Don't try to get rich quick. Make sure that your trading is professionally based on proper strategies and trade tactics.

$BB/USDT Breakout Could Fuel a 281% Rally.$BB/USDT has broken its long downtrend and is holding above the breakout.
If momentum continues, the price could target $0.48004, about 281% higher from here.
DYOR, NFA

$ALT/USDT Breakout Loading"NASDAQ:ALT has been in a downtrend for a long time, but it has been quietly consolidating for months.
Now it’s pushing towards a key trendline.
If it breaks out, we could be looking at a massive move toward $0.70951, which is over 1,500% from here.
DYOR, NFA

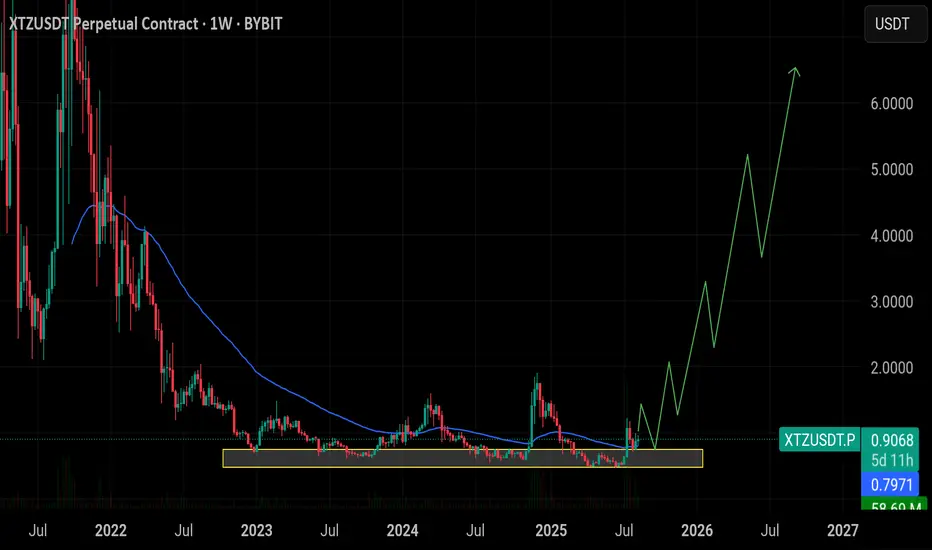
$XTZ Long-Term Accumulation AnalysisSEED_DONKEYDAN_MARKET_CAP:XTZ Long-Term Accumulation Analysis
🔸XTZ has been consolidating in a major accumulation zone between $0.50 – $0.76 for a long period, showing strong demand at lower levels. Current price is above this range, suggesting patience is needed for the bulk of entries — but partial exposure can be taken now to avoid missing upside.
🔸 Smart Entry Zone:
Primary accumulation entries remain between $0.50 – $0.76. Wait for a pullback into this range to add larger positions, but consider adding a small position at the current price to catch any early moves.
🔸 Upside Target: $6.00+
Once accumulation resolves, historical patterns point toward a potential rally to $3.00, $4.20, and eventually $6.00+.
🔸 Risk Level at $0.48:
A sustained break below $0.48 would invalidate the accumulation structure.
🔸 Outlook:
Add a light position now at 0.90 and , then wait for price to revisit the $0.50 – $0.76 zone before building the core position. Hold for long-term upside.
Btc hit my upside target perfectly. Now retrace to downside T1?On Aug 9th, I suggested that Btc would break the downward trend and head up to my upside target (green T1). It did so the next day. I then anticipated a retrace to either T1 or T2 based on historical data (see chart below)
My upside target hit within 1%. So now...with the highest probability, Btc may now retrace into T1 (1st red box). There's always a chance it can go lower, but based on price action I expect a bounce at T1. We may not get T2 (even though there is a higher historical probability).
There is still that 12% chance Btc is just up only from here (with NO retrace into T1).
***Let me know what target you think will be hit (T1 or T2), or if you think up only from here.
May the trends be with you

Arb / Usdt BINANCE:ARBUSDT
### 📊 **ARB/USDT (Daily Chart)**
* **💰 Current Price:** \~0.4580 USDT (+11.5% today)
* **🚧 Resistance Zones:**
* 🔹 **0.48–0.50** → key rejection area before.
* 🔹 **0.5697** & **0.6469** → major upside targets.
* **🛡 Support Levels:**
* 🔹 **0.42** → near rising trendline.
* 🔹 **0.3652** → strong historical support.
* **📈 Trend:** Riding an **ascending trendline** from July lows.
* **📊 Volume:** Strong buying spike → bullish momentum confirmed.
---
### 🔍 **What to Watch:**
✅ **Bullish:** Break & close above **0.50** → could aim for **0.57–0.64** fast.
⚠ **Bearish:** Rejection at 0.50 → possible pullback to **0.42** or **0.3652**.
---
⚠ **Disclaimer:**
*This is for educational purposes only, not financial advice. Always DYOR before trading.*

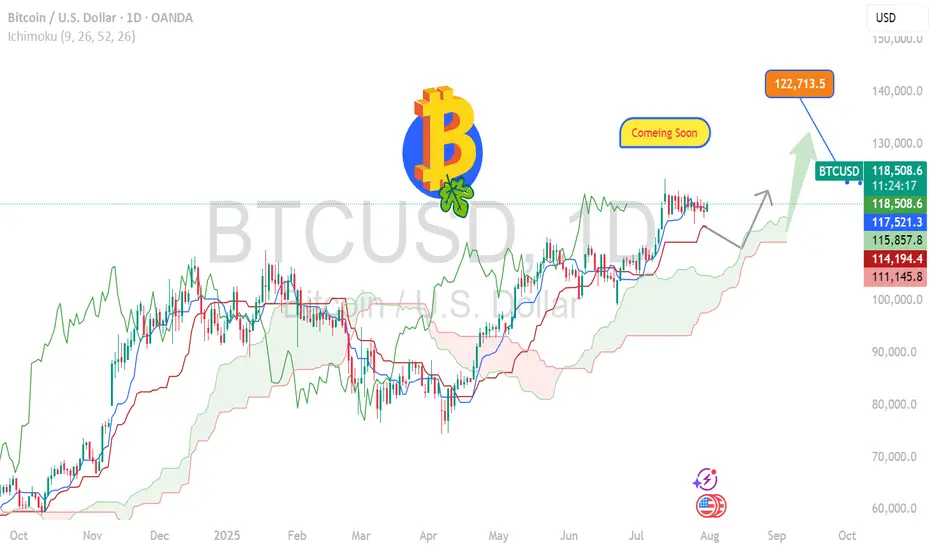
DeGRAM | BTCUSD exceeded $120k📊 Technical Analysis
● BTCUSD has broken above the 119.4k–119.9k support-turned-resistance zone, confirming a bullish channel breakout.
● Structure favors a climb toward the 129.4k resistance, with short-term pullbacks expected to retest the green support band before continuation.
💡 Fundamental Analysis
● ETF inflows hit a 3-month high as institutional interest in BTC strengthens amid rising inflation-hedge demand.
● On-chain metrics show increased miner accumulation, signaling confidence in higher future prices.
✨ Summary
Long above 119.4k. Targets 125k → 129.4k. Setup holds if price remains above 118.5k.
-------------------
Share your opinion in the comments and support the idea with a like. Thanks for your support!

BTC is heading to $130k+After 4 weeks of consolidation and strong liquidity grab from the weekly support BTCUSD started to rise to the upside with a bullish trend continuation showing possible upside bias. As 4h bull flag has broken the support and price started to trend, we may see this instrument reaching to $130k+?
A possible bullish trade is high probable!!

BTCUSD UPDATE Bitcoin has gone up and now I will close partial profits and secure what I have or even swing again to the up side

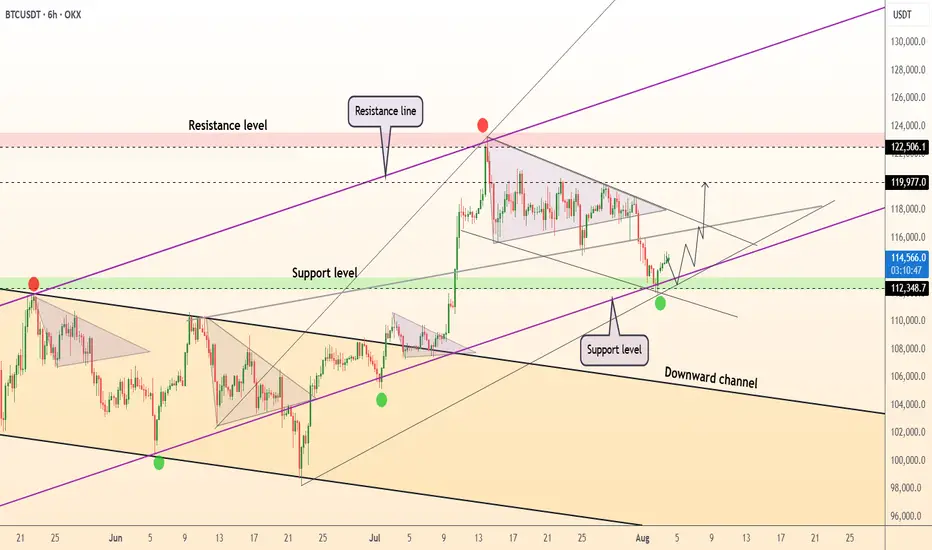
DeGRAM | BTCUSD reached the support level📊 Technical Analysis
● BTCUSD has bounced from confluence support at 112.3k–114.8k, reclaiming the ascending support line and validating the lower boundary of the rising triangle.
● Price action suggests a bullish continuation setup with targets at 119.9k and extension to the upper resistance near 122.5k–125k.
💡 Fundamental Analysis
● US labor data slowdown and dovish Fed commentary have pulled real yields lower, boosting crypto demand.
● Glassnode reports ongoing whale accumulation and rising stablecoin inflows, signaling positive capital rotation into BTC.
✨ Summary
Long above 114.8k. Targets 119.9k → 122.5k+. Setup invalidated on a break below 112.3k support.
-------------------
Share your opinion in the comments and support the idea with a like. Thanks for your support!
BITCOIN- Charging Towards 122k Momentum Building BTC/USD Long Setup – Targeting 122K 🔥
Bitcoin is holding strong above 118500, signaling bullish momentum.
✅ Price broke key resistance & forming higher lows.
🟢 Current structure favors buy-side continuation with next major target at 122000.
Support Zones:
🔹 117800 – intraday bullish retest
🔹 116500 – strong demand zone
Resistance Ahead:
🔸 120200 – short-term reaction
🔸 122000 – major target
🚀 Expecting bullish wave continuation.
If momentum sustains above 118K, 122K breakout highly probable!
#BTC #Bitcoin #CryptoSetup #BTCUSD #CryptoTrading #BTC122K #ChartAnalysis #BullishBreakout
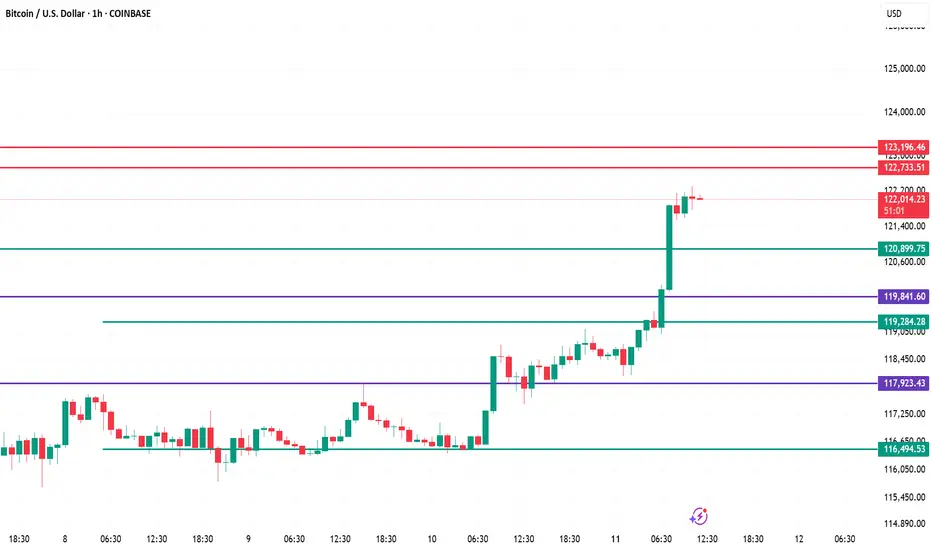
Bitcoin 1H Chart – Analysis
Current Momentum – Strong bullish breakout above key resistance zones 119,841 and 120,899, indicating aggressive buying pressure.
Immediate Resistance – Price is now approaching 122,733–123,196, a heavy supply zone; possible short-term profit booking area.
Support Levels – Nearest support now sits at 120,899, followed by 119,841. Holding above these keeps momentum intact.
Market Structure – Clear higher highs and higher lows; trend remains bullish unless price breaks below 119,284.
Trading Plan – Ride the uptrend with trailing stops; watch for reversal signals at 122,733–123,196 or continuation breakout above 123,200 for fresh upside.
Feeling the charts, forecast for August 13, 2025I am engaged in the extrasensory of stock charts, that is, feeling the energy of the future chart, this is a meditative technique, and the sensations are mainly tactile.
Forecast for August 13, 2025 time zone UTC, I feel two rather strong upward impulses at the very beginning and in the second half of the day.
At the moment, I do not analyze the prices, I only pay attention to the price movement impulses. I consider my forecast to be good if the outline of the real chart matches the outline of the chart that I have drawn as a forecast, that is, the direction and time period of the price movement are correctly indicated.

BTCUSD SCALP TRADEBitcoin will be scalping it carefully and as quick as possible and will just wait for a turn over to the upper side
Buy Bitcoin on a pullbackYesterday, Bitcoin quickly rose to near its previous high and then began to correct. It is still in an upward trend. From the hourly and 4-hour levels, we can see that Bitcoin is currently supported at 118,500. Before it falls below the rising channel, our trading strategy is still the same as before, going long on pullbacks.
Thank you all for your likes, comments and follows, we really appreciate it!

$AAVE / 1H Trade plan CRYPTOCAP:AAVE / 1H Trade plan 📊
Price just broke market structure after forming clean Equal Lows (EQL), signaling bearish intent.
Currently holding below the $296–$297 zone — my eyes are on a retracement into the $303 supply area for a potential short entry.
🛑 Bearish Plan:
🟢 Pullback Zone: $302–304
✅ Main Target: $269–272 📉
⛔ Invalidation: Above $313
If the 1H candle gives a strong close above $303, I won’t take the entry. But if it gets rejected, I’ll enter.
The game plan stays simple — execute the setup, ignore the noise. The chart is telling the story; we just need to follow the script.
CRYPTOCAP:AAVE

BTCUSD BITCOIN Bitcoin has now triggered my trade and now I await it, to return to the upside and provide profits , I shall partial close if necessary

This is it - Bitcoin weekly update August 11 - 17thFrom an Elliott Wave perspective, Bitcoin is currently unfolding a Cycle degree Wave C, which at the Primary degree is forming Wave A. At both the Intermediate and Minor degrees, price is also in Wave A. The minimum downside target for this structure lies at the 1.0 Fibonacci extension near $112K. Additional targets include the 1.236 extension at roughly $110K and the 1.618 extension near $106K.
Liquidity mapping reveals notable clusters at key levels. The $115.5K zone, highlighted by the red box on the chart, contains significant liquidity according to the heatmap. Additionally, order book data shows heavy bid accumulation around the $110K level — an area that also coincides with a daily Fair Value Gap (FVG). The Point of Control (POC) from the previous wave lies just below the red box, further reinforcing the bearish confluence.
From a derivatives standpoint, the recent impulsive rally in Wave b appears to have been largely driven by leveraged positions. Funding rates have started to decline from high positive levels, while open interest — after a brief surge — is now dropping, suggesting traders are unwinding positions rather than adding fresh exposure.
Spot ETF flows continue to show net inflows, but closer inspection reveals that these have been more FOMO-driven than strategic accumulation. Outflows were recorded at the local low of Wave a, while inflows spiked during the impulsive rise of Wave b — behaviour that often reverses as the market corrects. This increases the likelihood of inflows slowing or reversing during the expected downward leg.
The primary scenario anticipates that Bitcoin will continue lower. At the Primary degree, Wave A could terminate within the red liquidity box, where the liquidity cluster might act as a temporary buy wall. This could then lead to a corrective Wave B before a final Wave C to complete the larger structure. However, making precise forecasts beyond Wave A would be speculative at this stage.

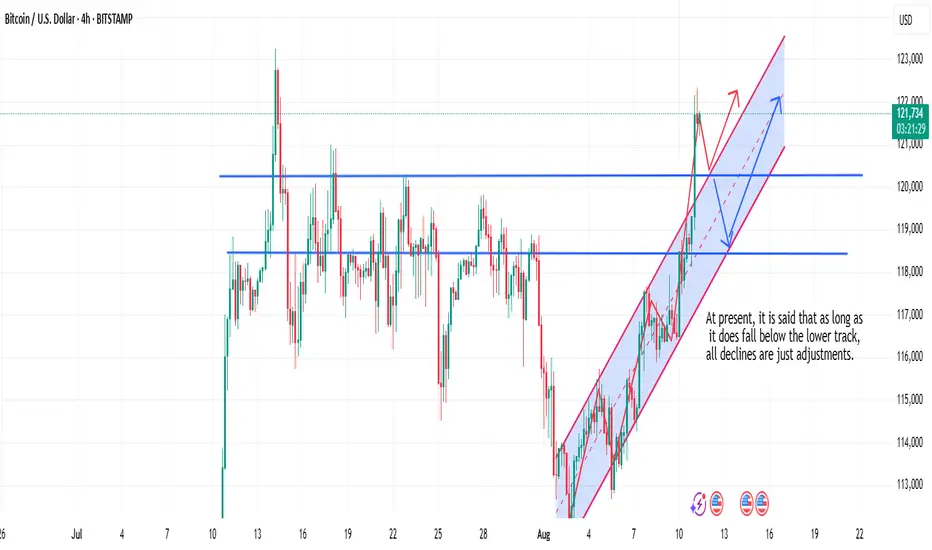
Bitcoin Trading StrategyAs mentioned yesterday, Bitcoin broke through the resistance level and rallied towards the previous high. It is now consolidating near today’s peak, showing some volatility.
From a technical perspective, the lower boundary of the 4-hour ascending channel—or the EMA20—suggests that bulls remain in control, with any pullback likely serving as consolidation before further upside. A decisive break above the prior high could trigger an acceleration in upward momentum.
Those holding positions should remain cautious of potential profit-taking amid this elevated consolidation, particularly around key weekly resistance zones.
In Summary
- Short-term strategy: Maintain a bullish bias on pullbacks as long as support holds, but consider taking partial profits near the previous high.
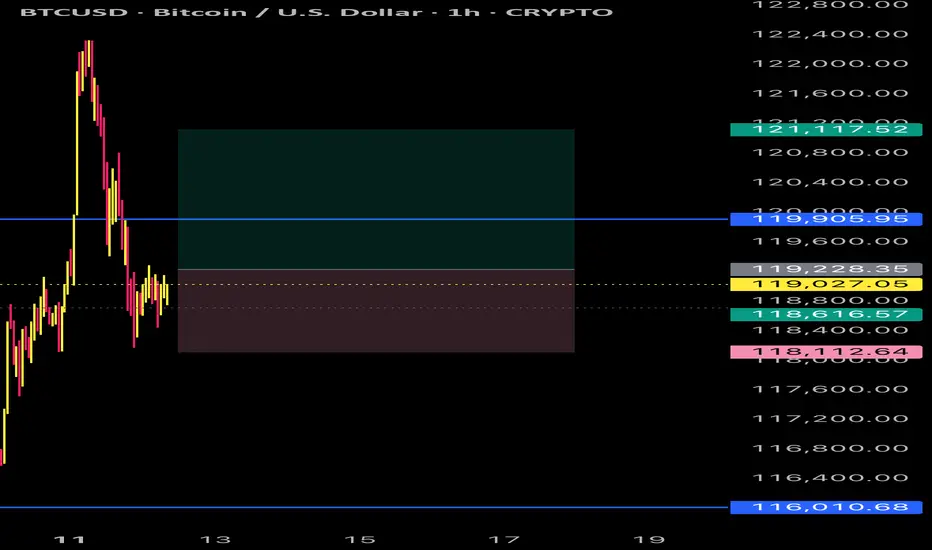
BTC Price Action Screams Sell — Is $115K Next?
• The move to $122.5k looks like a sharp liquidity grab / exhaustion wick rather than a sustained follow-through.
• Price failed to hold the top (small bearish candles after the spike) and is now sitting on/near a shallow support area — a classic place for sellers to press once momentum cools.
• Multiple prior “S” markers around the mid-$118k zone show persistent supply there; that same supply can re-assert as price retests.
• Bearish bias while price remains below the red supply zone (~$122.2–122.5k) and until it can reclaim & close above ~123k on 1H.
Key levels (read from the chart)
• Immediate resistance / supply zone: 122,200 – 122,501 (red box).
• Current price shown: 121,506.61.
• Support levels (dotted lines): 119,872.53 (first), 118,864.72 (second), 115,843.52 (stronger support / demand).
• Invalidation for the bearish plan: sustained close above ~123,000 (1H close).
Two actionable bearish setups (with exact math)
Setup A — “Rejection short” (preferred)
• Rationale: Wait for a retest/rejection of the red supply zone (122.2–122.5k).
• Entry: 122,200 (short on clear rejection candle)
• Stop: 123,000 (above the supply) → risk = 123,000 − 122,200 = 800 points.
• Targets:
o TP1 = 119,872.53 → reward = 122,200 − 119,872.53 = 2,327.47 → R:R = 2,327.47 / 800 = 2.91 : 1.
o TP2 = 118,864.72 → reward = 122,200 − 118,864.72 = 3,335.28 → R:R ≈ 4.17 : 1.
o TP3 = 115,843.52 → reward = 122,200 − 115,843.52 = 6,356.48 → R:R ≈ 7.95 : 1.
Setup B — “Breakdown short” (if price loses structure)
• Rationale: Trade the structure break — enter only after a clean breakdown below a nearby support retest.
• Entry: 121,000 (short once price decisively breaks and retests lower side)
• Stop: 122,000 → risk = 1,000 points.
• Targets: same support ladder:
o TP1 = 119,872.53 → reward = 121,000 − 119,872.53 = 1,127.47 → R:R = 1,127.47 / 1,000 = 1.13 : 1.
o TP2 = 118,864.72 → R:R ≈ 2.14 : 1.
o TP3 = 115,843.52 → R:R ≈ 5.16 : 1.
Short trade management / rules
• Position sizing: risk a fixed % of account per trade (e.g., 0.5–1%). Use the risk points above to size the position.
• Scaling: take ~25–40% at TP1, move stop to breakeven on first partial fill, trail rest to TP2/TP3.
• Confirmation: prefer one of these confirmations before entry — bearish 1H close below the short entry or clear rejection wick + volume spike to the upside followed by selling. (I can’t see live volume here — check it on your platform.)
• Invalidation: an hourly close above ~123k invalidates the bearish plan; flip bias to neutral/bull.
Why this is a high-probability bearish setup
• The rally was fast and left small-range candles after the spike — typical of exhaustion where liquidity was swept.
• Prior range had repeated sells around lower highs (S markers) — that supply doesn’t vanish; a failed breakout often returns to fill that liquidity.
• The downside targets are relatively close (TP1 is only ~1.63k points below current price, about 1.34%), so short targets are reachable without needing a large trend reversal.
(Example percent math shown exactly: current 121,506.61 − TP1 119,872.53 = 1,634.08 points → 1,634.08 ÷ 121,506.61 = 0.0134485 → ≈ 1.345% drop to TP1.)
Watchouts / final notes
• If BTC prints strong continuation volume on a push above 122.5k and holds >123k on hourly closes, the short edge is gone.
• Check 4H / daily to ensure this isn’t just a higher-timeframe bullish leg that will quickly absorb short pressure. If higher TF shows strong bullish structure, keep stops tighter.
• Not financial advice — treat this as a technical plan and adjust sizing/risk to your rules.
