Bitcoin Structurally Momentum Bullish – On-Chain Confirmed.⊢
⟁ BTC/USD – BINANCE – (CHART: 4H) – (June 27, 2025).
⟐ Analysis Price: $106,840.15.
⊢
⨀ I. Temporal Axis – Strategic Interval – (4H):
▦ EMA(9) – ($107,126.95):
∴ Current price is slightly below the EMA(9), indicating the beginning of intraday buyer fatigue;
∴ EMA(9) still curves upward, sustaining the recent bullish momentum, but showing signs of deceleration.
✴️ Conclusion: Short-term strength is weakening; potential micro-shift in sentiment underway.
⊢
▦ EMA(21) – ($106,574.03):
∴ EMA(21) acts as immediate dynamic support, now closely tested;
∴ Still sloping upward, suggesting buyers are attempting to defend the structure.
✴️ Conclusion: Tactical support remains intact - this is the battlefield line.
⊢
▦ EMA(50) – ($105,651.25):
∴ Mid-range structure confirms trend stability as price remains well above the EMA(50);
∴ EMA(50) direction remains mildly bullish, reinforcing medium-term control by buyers.
✴️ Conclusion: Medium trend unshaken; pullbacks remain controlled within bullish context.
⊢
▦ EMA(200) – ($104,890.51):
∴ Long-term baseline remains untouched, with price notably above;
∴ The slope of EMA(200) is stable and slightly positive.
✴️ Conclusion: Structural bullish foundation remains intact. No long-term threat detected.
⊢
▦ Ichimoku Cloud (9/26/52/26):
∴ Price remains above the Kumo cloud; Tenkan and Kijun are aligned in bullish formation, though beginning to flatten;
∴ Chikou Span remains free and clear above historical price — no conflict.
✴️ Conclusion: Structure is still bullish, but compression in the cloud signals potential pause in directional conviction.
⊢
▦ Volume (BTC) + MA(21):
∴ Volume sits below its 21-period moving average, indicating waning buyer participation;
∴ No breakout or capitulation candle - sentiment is reserved.
✴️ Conclusion: Lack of conviction - volume confirms indecision and pause in impulse.
⊢
▦ RSI + EMA9 – (RSI: 54.78 / EMA9: 59.70):
∴ RSI curves downward from the upper-neutral zone - momentum is retreating;
∴ RSI has crossed below its EMA(9), which typically signals fading bullish strength.
✴️ Conclusion: Momentum has weakened - buyers are hesitating.
⊢
▦ Stoch RSI – (K: 9.72 / D: 10.22):
∴ Oscillator is deep in the oversold region, preparing a bullish cross;
∴ No confirmation of reversal yet - early signal.
✴️ Conclusion: Setup for potential rebound exists, but signal remains unconfirmed.
⊢
▦ MACD – (MACD: 725.17 / Signal: 883.72 / Histogram: –158.55):
∴ MACD histogram turns increasingly negative, suggesting decay in momentum;
∴ Though MACD line remains above signal, curvature favors a bearish crossover soon.
✴️ Conclusion: Momentum fading; risk of technical crossover if weakness persists.
⊢
▦ OBV – (71.13M):
∴ OBV is flat and shows no divergence, suggesting balanced pressure;
∴ Movement remains parallel to EMA21, confirming neutrality.
✴️ Conclusion: Volume flow is not supporting a continuation; neutral.
⊢
🜎 Strategic Insight – Technical Oracle:
∴The structure remains bullish at the macro and medium levels;
∴ As evidenced by EMA alignment and Ichimoku posture. However, momentum signals are fading, and the current 4H candle lacks conviction;
∴ A breakout requires stronger volume and RSI reacceleration - until then, the tactical stance is suspended.
⊢
∫ II. On-Chain Intelligence – (CryptoQuant):
▦ 1. Exchange Netflow Total – (All Exchanges):
∴ Current readings show net outflows dominating, indicating coins moving out of exchanges - typically interpreted as holding behavior and bullish bias;
∴ No recent spike in inflows that would suggest imminent selling pressure or dump risk.
✴️ Conclusion: Exchange behavior is structurally bullish - environment favors accumulation.
⊢
▦ 2. Exchange Stablecoins Ratio – (All Exchanges):
∴ The ratio remains low and stable, meaning high stablecoin reserves vs. Bitcoin on exchanges - suggesting potential buying power in standby;
∴ No spike in the ratio - no immediate conversion from stablecoins into Bitcoin.
✴️ Conclusion: Stablecoins on standby confirm latent demand - supportive for bullish continuity if triggered.
⊢
▦ 3. Funding Rates – (All Exchanges):
∴ Funding is positive but mild, indicating long interest, yet not overheated;
∴ No excessive leverage detected - absence of speculative imbalance.
✴️ Conclusion: Derivatives market supports a healthy uptrend with no signs of crowd euphoria.
⊢
▦ 4. Estimated Leverage Ratio – (All Exchanges):
∴ Leverage ratio remains within neutral bounds, not expanding aggressively;
∴ Suggests market is currently not dominated by overleveraged positions.
✴️ Conclusion: The structure is stable - no systemic risk from forced liquidations.
⊢
▦ 5. Taker Buy/Sell Ratio – (All Exchanges):
∴ The ratio is slightly above 1.0 - meaning more aggressive buying than selling, but without dominance;
∴ Reinforces sentiment of cautious buying, not yet euphoric.
✴️ Conclusion: Taker flow confirms moderate bullish sentiment, no reversal pressure.
⊢
🜎 Strategic Insight – On-Chain Oracle:
∴ On-chain metrics align with structural bullishness;
∴ Netflows, leverage, and taker activity all support continuation;
∴ Importantly, stablecoin ratios signal dry powder remains available, meaning the market holds the potential energy for further upside - if volume and technical confirmation align.
⊢
⧈ Codicillus Silentii Strategic Note:
∴ In the discipline of silence, one waits as price tests its dynamic zone. The wise act after structure, not inside uncertainty;
∴ The chain speaks in whispers. Smart liquidity waits. The structure is armed - but momentum requires ignition. Not fear, not hope - signal.
⊢
𓂀 Stoic-Structural Interpretation:
∴ Structurally Bullish - (Tactically Suspended);
∴ The core architecture remains intact, but the absence of volume and declining oscillators justify a suspended stance for entry;
∴ On-chain and chart-based structures are aligned in bullish posture, but technical indicators remain in a suspended tactical phase. Awaiting breakout or deeper pullback for positioning.
⊢
▦ Tactical Range Caution:
∴ Watch $106,574 (EMA21) and $105,651 (EMA50) for reactive buying;
∴ Below $104,890 (EMA200) - structure weakens;
∴ Upside breakout requires volume reclaim above $107,330;
∴ Resistance: $107,330 / $108,200.
⊢
⧉
⚜️ Magister Arcanvm (𝟙⟠) – Vox Primordialis!
𓂀 Wisdom begins in silence. Precision unfolds in strategy.
⧉
⊢
Btcusdanalysis

#BTC/UST#BTC
The price is moving within a descending channel on the 1-hour frame, adhering well to it, and is on its way to breaking it strongly upwards and retesting it.
We are seeing a rebound from the lower boundary of the descending channel, which is support at 106,000.
We have a downtrend on the RSI indicator that is about to break and retest, supporting the upward trend.
We are looking for stability above the 100 moving average.
Entry price: 106,600
First target: 106,750
Second target: 107,000
Third target: 107,291

BTC LONG TP:108,600 26-06-2025Looks like a classic fakeout before a big move 💥
Entry between 105,800 – 106,450, targeting 108,400 – 108,900, with an average 3.5 RR.
🕐 Timeframe: 1H
⏳ Duration: Fast move
Context: Expecting a quick manipulation before an expansion toward 108,500 – 109,500. The only problem? The stop. Manage it based on your own strategy — this one’s spicy.
If the move doesn’t happen within the expected time, the setup is invalid.
We don’t use indicators, we’re not out here drawing lines or cute little shapes — I just give you a clean trade.

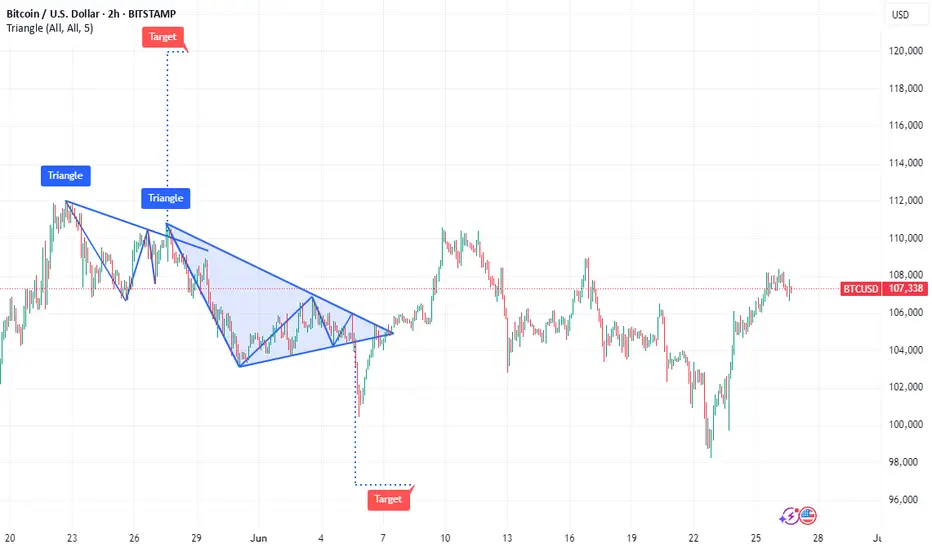
Bitcoin's Podium-Ready 'Bull Flag' Hints at Price Boom to $120KBitcoin's Podium-Ready 'Bull Flag' Hints at Price Boom to $120K
Bitcoin, the pioneering cryptocurrency that has redefined the financial landscape, continues to spark intense debate and fervent speculation about its future price trajectory. Amidst the sea of technical analyses and market predictions, a compelling pattern has emerged on Bitcoin's price chart: the 'bull flag.' This bullish continuation pattern, often seen as a precursor to significant upward price movements, has ignited excitement among Bitcoin proponents, fueling predictions of a potential surge to $120,000.
This article delves into the intricacies of the bull flag pattern, exploring its formation, characteristics, and implications for Bitcoin's price. We will analyze the current market conditions, considering the recent retreat from $108,000 and the overall sentiment of Bitcoin bulls. Furthermore, we will examine the factors that could either validate or invalidate the bull flag pattern, providing a nuanced perspective on the potential for Bitcoin to reach $120,000. By synthesizing these insights, we aim to offer a comprehensive overview of the technical and fundamental factors that could shape Bitcoin's price trajectory in the coming months.
Understanding the Bull Flag Pattern
The bull flag is a technical analysis pattern that signals a continuation of an existing uptrend. It is characterized by two distinct phases:
1. The Flagpole: This represents the initial strong upward movement in price. It is a sharp, almost vertical rally that establishes the overall bullish trend.
2. The Flag: This is a period of consolidation that follows the flagpole. The price moves sideways or slightly downwards, forming a rectangular or parallelogram-shaped pattern that resembles a flag. This consolidation phase allows the market to digest the initial rally and prepare for the next leg up.
The bull flag pattern is considered a bullish signal because it suggests that the initial uptrend is likely to resume after the consolidation phase. Traders often look for a breakout above the upper trendline of the flag as a confirmation signal to enter a long position.
Bitcoin's Bull Flag Formation
Bitcoin's price chart has exhibited a pattern that closely resembles a bull flag. The flagpole can be identified by the significant upward movement that occurred in the months leading up to June 2025. This rally propelled Bitcoin to a high of $108,000, establishing a strong bullish trend.
Following this rally, Bitcoin entered a period of consolidation, with the price moving sideways and slightly downwards. This consolidation phase has formed a flag-like pattern on the chart, characterized by two parallel trendlines that slope gently downwards.
The formation of this bull flag pattern has led many analysts to believe that Bitcoin is poised for another significant upward movement. The target price for this potential breakout is often calculated by measuring the length of the flagpole and adding it to the breakout point on the upper trendline of the flag. In Bitcoin's case, this calculation suggests a potential target price of around $120,000.
Factors Supporting the Bull Flag Pattern
Several factors support the validity of the bull flag pattern and the potential for Bitcoin to reach $120,000:
• Strong Underlying Bullish Trend: The bull flag is a continuation pattern, meaning that it relies on an existing uptrend to be valid. Bitcoin's price has been in a strong uptrend for several years, driven by increasing institutional adoption, growing mainstream adoption, and limited supply.
• Positive Market Sentiment: The overall sentiment among Bitcoin investors remains positive, despite the recent retreat from $108,000. Many analysts believe that Bitcoin is still in the early stages of its adoption curve and that its long-term potential remains significant.
• Increasing Institutional Adoption: Institutional investors, such as hedge funds, pension funds, and corporations, are increasingly allocating capital to Bitcoin. This increased institutional adoption can drive up the price of Bitcoin and provide a more stable foundation for its long-term growth.
• Growing Mainstream Adoption: Bitcoin is becoming increasingly accepted as a form of payment and a store of value by mainstream consumers and businesses. This growing mainstream adoption can increase demand for Bitcoin and drive up its price.
• Limited Supply: Bitcoin has a fixed supply of 21 million coins. This limited supply makes Bitcoin a scarce asset, which can increase its value over time as demand grows.
• Halving Events: Bitcoin's halving events, which occur approximately every four years, reduce the rate at which new Bitcoins are created. These halving events can reduce the supply of Bitcoin and drive up its price. The next halving event is expected to occur in 2028.
• Macroeconomic Factors: Macroeconomic factors, such as inflation, currency devaluation, and geopolitical instability, can increase demand for Bitcoin as a safe haven asset.
Factors Invalidating the Bull Flag Pattern
While the bull flag pattern is a bullish signal, it is not foolproof. Several factors could invalidate the pattern and prevent Bitcoin from reaching $120,000:
• Breakdown Below the Flag: If the price breaks down below the lower trendline of the flag, the bull flag pattern is invalidated. This would suggest that the consolidation phase is not a temporary pause before another rally, but rather a sign of weakening momentum.
• Negative News and Events: Negative news and events, such as regulatory crackdowns, security breaches, or macroeconomic shocks, could dampen investor sentiment and trigger a sell-off in Bitcoin.
• Weakening Market Fundamentals: If Bitcoin's adoption rate slows down, network activity declines, or transaction volume decreases, it could indicate that the underlying fundamentals are weakening, which could invalidate the bull flag pattern.
• Profit-Taking: After a significant rally, some investors may choose to take profits, which could put downward pressure on the price of Bitcoin and prevent it from breaking out of the flag.
• Alternative Investments: The emergence of compelling alternative investments could divert capital away from Bitcoin, reducing demand and potentially invalidating the bull flag.
Bitcoin Retreats From $108K: A Temporary Setback?
As of June 26, 2025, Bitcoin has retreated from its recent high of $108,000. This pullback has sparked concerns among some investors, but Bitcoin bulls remain optimistic about the long-term prospects of the cryptocurrency.
The recent retreat could be attributed to a number of factors, including profit-taking after a significant rally, regulatory concerns, or macroeconomic headwinds. However, it is important to note that Bitcoin has experienced numerous pullbacks throughout its history, and these pullbacks have often been followed by even stronger rallies.
The key question is whether this pullback is a temporary setback within the bull flag pattern or a sign that the pattern is about to be invalidated. If the price can hold above the lower trendline of the flag and eventually break out above the upper trendline, it would confirm the validity of the pattern and increase the likelihood of Bitcoin reaching $120,000.
Trading the Bull Flag Pattern
Traders who are looking to capitalize on the bull flag pattern can consider the following strategies:
• Entry Point: Wait for a confirmed breakout above the upper trendline of the flag before entering a long position. This helps to avoid false breakouts and increases the probability of a successful trade.
• Stop-Loss Order: Place a stop-loss order below the lower trendline of the flag to limit potential losses if the pattern is invalidated.
• Target Price: Calculate the target price by measuring the length of the flagpole and adding it to the breakout point on the upper trendline of the flag.
• Risk Management: Always use proper risk management techniques, such as limiting the amount of capital you risk on any single trade.
Conclusion
Bitcoin's price chart is currently exhibiting a bull flag pattern, which suggests that the cryptocurrency could be poised for another significant upward movement. The potential target price for this breakout is around $120,000.
However, it is important to note that the bull flag pattern is not foolproof, and several factors could invalidate it. Investors should carefully monitor the price action, market sentiment, and underlying fundamentals to assess the likelihood of Bitcoin reaching $120,000.
The recent retreat from $108,000 is a reminder that Bitcoin is a volatile asset and that pullbacks are a normal part of the market cycle. Whether this pullback is a temporary setback within the bull flag pattern or a sign that the pattern is about to be invalidated remains to be seen.
Ultimately, the future of Bitcoin's price will depend on a complex interplay of technical factors, market sentiment, and fundamental developments. By staying informed and using proper risk management techniques, investors can position themselves to potentially profit from Bitcoin's continued growth and success. As always, remember to consult with a qualified financial advisor before making any investment decisions. The bull flag offers a tantalizing glimpse of potential gains, but prudent analysis and risk mitigation are essential for navigating the volatile world of cryptocurrency.
BTC SHORT TP: 106,300 25-06-2025Let’s be real — what’s coming looks like pure manipulation 😮💨
Setting a SHORT between 108,550 – 109,250, aiming for 106,200 – 106,550, with an average 3.3 RR.
🕑 Timeframe: 2H
⏳ Duration: 20–30 hours
Context: If you see a massive green candle… that’s not strength — that’s the short signal. Stops are pretty obvious in this kind of setup. Classic trap vibes loading.
If the move doesn’t happen within the estimated time, the setup is invalid.
We don’t use indicators, we’re not out here drawing lines or cute little shapes — I just give you a clean trade.
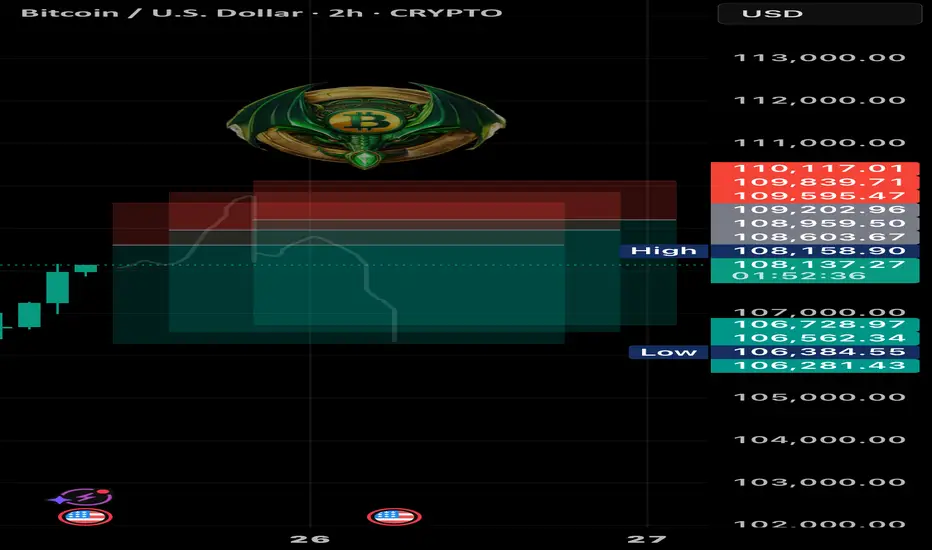
Setup: Entry at $108,658 with Target at $98,815 and Stop Loss at1. Entry Point: 108,658
This is where the trader expects to enter a short position.
Price is projected to reverse near this level.
2. Stop Loss: 110,341
Located above the entry point.
If price hits this level, the short trade is invalidated, limiting losses.
3. Target (Take Profit): 98,815
This is the EA Target Point, about 9,714 points (~8.94%) below the entry.
Represents a favorable risk-reward ratio.
---
🔄 Trade Idea Summary
Trade Type: Short (Sell)
Risk: ~1,683 points (110,341 - 108,658)
Reward: ~9,843 points (108,658 - 98,815)
Risk-Reward Ratio: ~1:5.85 (which is strong)
---
📊 Technical Indicators in Use
Moving Averages:
Likely 50-period (red) and 200-period (blue) MAs.
The 50 MA is below the price, indicating short-term bullishness.
However, the trade idea goes against this short-term trend, suggesting a reversal strategy.
---
🔍 Interpretation & Strategy
This chart implies the trader expects resistance near 108,658, possibly due to historical highs or supply zones.
The bearish outlook expects a significant drop to 98,815, possibly supported by macro patterns (like head & shoulders, or bearish divergence—not shown here but could be inferred).
The purple zones highlight high-probability reversal or reaction areas (support/resistance zones).
---
⚠️ Things to Watch
Invalidation: If price closes above 110,341 on a 4H/1D chart, the trade setup fails.
Confirmation: A strong bearish candlestick at or near the entry zone would strengthen the case.
Market Context: News, economic data, or BTC ETF inflows/outflows can quickly invalidate technical setups.

BANANAS31USDT Forming Bullish FlagBANANAS31USDT is currently exhibiting a bullish flag pattern on the charts, which is a continuation setup often seen before the next leg up in an uptrend. This pattern reflects a short-term consolidation phase after a sharp upward movement, indicating that buyers are temporarily pausing before potentially pushing the price higher. The presence of good volume within this consolidation is a strong sign of underlying strength and accumulating interest from traders.
As the price coils within the flag structure, the likelihood of a breakout to the upside increases. With bullish momentum building and investor sentiment growing more confident, BANANAS31USDT could be gearing up for a 20% to 30%+ gain in the near term. The breakout zone and confirmation levels will be key to watch as a successful breakout from the flag pattern could trigger significant buy pressure, propelling the price towards the projected targets.
BANANAS31 continues to gain traction among crypto traders due to its rising community engagement and promising project fundamentals. Technical traders are particularly eyeing the current price action for signals of the next breakout. Given the structure and recent market behavior, this coin is positioned well for short- to mid-term growth, especially if broader market conditions remain favorable.
With the bullish flag signaling possible continuation and volume confirming healthy interest, BANANAS31USDT presents an attractive setup for both breakout traders and trend followers looking to capitalize on upcoming momentum.
✅ Show your support by hitting the like button and
✅ Leaving a comment below! (What is You opinion about this Coin)
Your feedback and engagement keep me inspired to share more insightful market analysis with you!

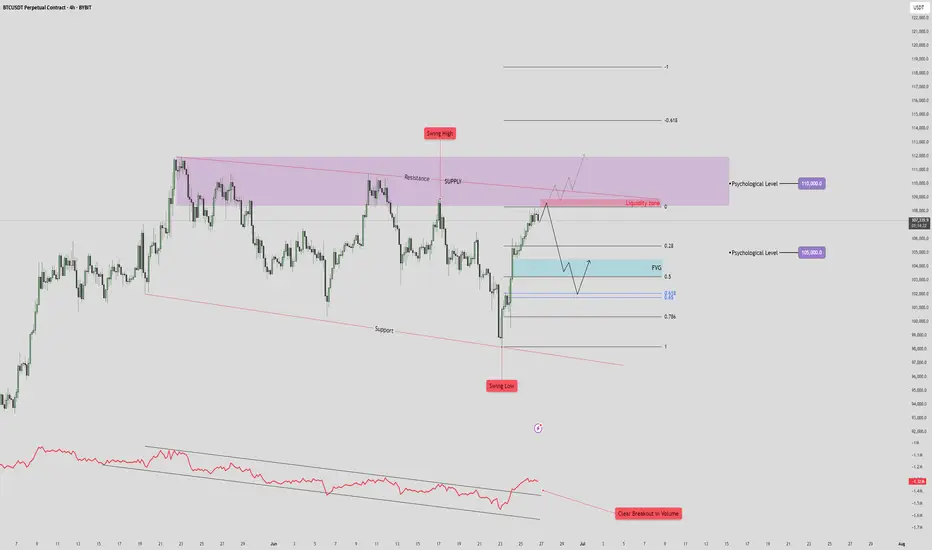
BTC/USDT Drop to 101k?🧠 High Time Frame Context
Trend: Consolidation within a broad range (support and resistance clearly defined).
Key Psychological Levels:
105,000 USDT – minor level, acting as a magnet in short-term PA.
110,000 USDT – major supply confluence and liquidity target.
🟪 Supply & Resistance Zone
Zone: Marked in purple (108.5k-112k).
Key Observation:
Swing high formed inside this zone, indicating liquidity trap.
Potential fake-out or strong rejection from this area.
Strong confluence with a descending resistance trendline, adding to the selling pressure.
🔵 Fair Value Gap (FVG) & Retracement Targets
FVG identified just below the current price (~103.5k-104.5k).
Price is projected to:
Reject from the current high.
Drop to fill the FVG zone.
Possibly bounce between FVG and Fibonacci retracement levels:
0.5
0.618
0.786
🔴 Volume & RSI Divergence
Volume breakout is noted on the last push down (bottom red annotation), followed by a retrace.
OBV shows bullish divergence with price:
🔻 Support Structure
Lower red trendline is a key long-term support.
Previous swing low aligns with this trendline – buyers showed strong interest here.
If FVG fails to hold, expect a retest of this trendline near 97,000–98,000.
📈 Likely Scenarios
Base Case (Neutral-Bearish):
Price rejects current zone (~107,000).
Pullback into FVG (101–104K).
Bounce to 105K (minor resistance), then decide next direction.
Bullish Breakout:
If price breaks and closes above 110K, it invalidates supply zone.
Opens door to 115–118K range.
Bearish Breakdown:
Fails FVG zone.
Tests previous swing low and support (~97K).
Below that, structure becomes macro bearish.
🧩 Summary
Short-Term: Retracement into FVG likely. Monitor reaction.
Medium-Term: Bearish bias while price is below 110K.
Invalidation for bears: Clean break and hold above 110K.
BTC - 103.5 - 102k when?OKay so the move as marked did move but is choppy, owing to the new pattern, lets see if triple tops are made and is done in a manner where it falls, LIQ shows at 108,800, BTC genuinely looks very very tired!

$LTC/USDT Trade Setup 6H Chart.$LTC/USDT Trade Setup 6H Chart.
- Entry: CMP
- Stop Loss: $76.20
Target:
TP 1:- $93.95
TP 2:- $85.65
LTC is bouncing off a long-term trendline support with an early MACD bullish crossover.
DYRO, NFA

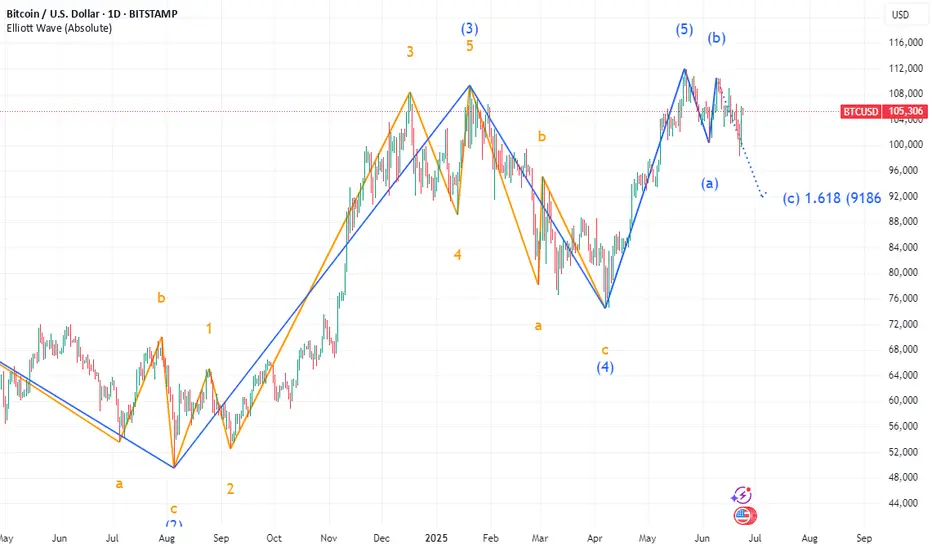
₿itcoin: Grinding higherBitcoin has extended its recent rally, reclaiming the $106,000 level in the last few hours. While short-term setbacks remain possible, our primary scenario continues to point higher: prices should aim for the upper blue Target Zone between $117,553 and $130,891. Within this zone, BTC should complete green wave B before initiating a corrective decline in wave C, which should extend into the lower blue Target Zone between $62,395 and $51,323. At the low of major wave a, a temporary recovery in wave b is likely, preceding the final downward push that should mark the end of the broader wave (ii) correction. Our alternative scenario (30% probability) suggests that Bitcoin remains within blue wave alt.(i). If true, a breakout beyond the upper blue Target Zone could occur.
📈 Over 190 precise analyses, clear entry points, and defined Target Zones - that's what we do.

BTC/USDT – Fakeout Above Rising Channel | Why Clean Breakouts StThis chart highlights an important lesson in breakout trading: Not all breakouts are valid, even when backed by volume.
🔍 Technical Breakdown:
BTC was trading inside a well-respected ascending channel, with multiple touches on both the upper and lower bounds.
Price broke above the channel with a 15-minute candle close and volume, giving the appearance of a clean breakout.
However, shortly after, price re-entered the channel, invalidating the breakout. This is what we call a fakeout or bull trap.
❓ So Why Did the Breakout Fail?
Lack of Follow-Through Buyers:
Despite volume, there wasn’t enough buyer continuation above the breakout level to sustain momentum.
Liquidity Hunt:
The wick beyond the upper trendline likely served to trigger breakout entries and stop losses of short sellers, only to reverse after liquidity was collected.
Key S/R Reaction:
After re-entering the channel, price reacted at a minor horizontal level (previous S/R), attempted another push, but failed again, confirming weakness.

$C98USDT Breakout Setup – 225% PotentialC98USDT is holding the bottom of a long-term falling wedge on the weekly chart, a key support zone.
A bounce from here could push the price up by over 225% toward the upper resistance trendline, located around $0.1175.
Strong setup, but wait for confirmation.
DYRO, NFA

BTCUSDT: Bounce Incoming?BTCUSDT Technical analysis update
-March 2024 resistance is now expected to act as a strong support level.
-The price has touched the 0.618 Fibonacci retracement level, suggesting a potential reversal from this zone.
-The 200 EMA on the 2-day chart is positioned as a strong dynamic support, reinforcing the bullish case.
We can expect a bounce from the $72-75k level.

New buying opportunity may emerge for BTCBTC tends to fluctuate in the short term, but as BTC builds a double bottom structure to support the rebound pattern, it is currently inclined to fluctuate upward. Although the upward momentum has weakened after reaching around 106,000, as long as it stays above the 105,300-104,800 area, BTC is still expected to continue to rise and may challenge the 108,000-109,000 area again.
And with the collapse of the gold and oil markets, funds in the two markets may flow into BTC, which is more attractive and the mainstream market of cryptocurrencies. So as BTC retreats in the short term, BTC may have new short-term buying opportunities. Then if BTC retreats to the 105,500-104,500 area and does not fall below this area, we can consider going long on BTC at the right time.

BTC LONG TP:108,000 24-06-2025Big green candle loading… 🚀
I’m looking to long between 105,300 and 105,800, targeting 107,800 – 108,300.
Clean setup with a 3.5 RR average, running on the 1-hour timeframe, expected to play out within 6 to 12 hours.
Technical context: The structure is primed — everything points to a big green candle coming. The setup is locked and ready.
If the move doesn’t happen within the estimated time, the trade becomes invalid.
We don’t use indicators, we’re not out here drawing lines or cute little shapes — I just give you a clean trade.

Bitcoin Strategic Risk Framework & Market Structure Assessment.⊢
⟁ BTC/USD – BINANCE – (CHART: 1D) – (Jun 25, 2025).
⟐ Analysis Price: $107,191.94.
⊢
⨀ I. Temporal Axis – Strategic Interval – (1D):
▦ EMA21 – ($105,207.93):
∴ Price has reclaimed EMA21 decisively after testing below;
∴ EMA21 maintains upward slope, indicating reactivation of short-term bullish sentiment;
∴ Dynamic support now resides at ~$105.2K.
✴️ Conclusion: EMA structure favors bullish continuation while price holds above.
⊢
▦ SMA200 – ($96,064.16):
∴ SMA200 remains strongly upward sloped, untouched since March 2024;
∴ Long-term momentum remains firmly bullish;
∴ No contact with SMA200 confirms macro support far below.
✴️ Conclusion: Structural support intact; macro uptrend fully confirmed.
⊢
▦ Ichimoku Cloud – ($103,065.53 / $104,456.43):
∴ Price positioned above Kumo; bullish structure remains intact;
∴ Kijun-sen ($104,456.43) and Tenkan-sen ($103,065.53) both flat, signaling short-term consolidation;
∴ Chikou Span approaches historical resistance zone; Span A and B flattening.
✴️ Conclusion: Bullish trend preserved, but lacking forward thrust; potential stagnation if breakout fails.
⊢
▦ Volume (MA21) – (~129 BTC):
∴ Current volume ~128.73 BTC, slightly under the moving average;
∴ No breakout volume confirmation despite recent price thrust;
∴ Weak volume expansion reduces reliability of short-term breakout.
✴️ Conclusion: Momentum requires validation through volume escalation.
⊢
▦ MACD – (-4.44 / 36.48 / -40.92):
∴ Histogram contracting upward, bearish momentum fading;
∴ MACD Line (-4.44) still below Signal Line (36.48);
∴ No confirmed bullish crossover, but compression phase active.
✴️ Conclusion: Latent bullish reversal potential; not yet validated.
⊢
▦ RSI – (55.95):
∴ RSI reclaimed level above 50, positioning in neutral-bullish zone;
∴ RSI MA at 48.78 confirms momentum shift;
∴ Positive slope suggests rising momentum, but lacks steepness.
✴️ Conclusion: Momentum entering constructive zone, still not impulsive.
⊢
🜎 Strategic Insight – Technical Oracle:
∴ Structure remains technically bullish with constrained momentum;
∴ Indicators are aligned toward continuation, yet breakout conviction is hindered by insufficient volume and pending oscillator confirmation;
∴ Short-term path is upward-biased, conditional on validation.
⊢
∫ II. On-Chain Intelligence – (Source: CryptoQuant):
▦ Exchange Netflow – (All Exchanges):
∴ Netflow remains negative on 7-day average;
∴ Sustained outflows indicate strategic accumulation or self-custody preference;
∴ No evidence of large-scale exchange inflows that signal distribution.
✴️ Conclusion: Net capital migration continues favoring off-exchange security; bullish underlying tone.
⊢
▦ Stablecoin Supply Ratio (SSR):
∴ SSR near 17.5 indicates relatively low stablecoin dominance;
∴ Reduced buying power vs Bitcoin implies cooling short-term demand;
∴ Historically elevated SSR levels precede price consolidations or local tops.
✴️ Conclusion: Stablecoin reserves insufficient for sustained upward pressure; caution warranted.
⊢
▦ Exchange Whale Ratio – (All Exchanges):
∴ Whale Ratio near 0.59 denotes moderate large-holder activity;
∴ Ratio not in critical zone (>0.7), yet above accumulation range (<0.4);
∴ Potential soft distribution behavior if ratio trends upward.
✴️ Conclusion: Mixed signal - no panic, but latent whale presence requires monitoring.
⊢
▦ Miner Reserve:
∴ Miner balances steadily declining over past 30 days;
∴ Consistent outflows suggest controlled selling behavior;
∴ No aggressive miner dumping detected.
✴️ Conclusion: Miner pressure exists but remains tactical and non-destructive.
⊢
▦ Long-Term Holder SOPR (LTH-SOPR):
∴ Metric above 1.0 indicates long-term holders are in profit and realizing gains;
∴ No sharp spike detected, suggesting rational distribution;
∴ Structure consistent with healthy bull cycle mechanics.
✴️ Conclusion: Profit-taking underway in equilibrium; not a signal of panic.
⊢
▦ Funding Rate – (Futures):
∴ Funding mildly positive (~0.002–0.004%), reflecting long positioning bias;
∴ Rates remain low, indicating lack of overcrowded trades;
∴ No sign of speculative overheating in derivatives.
✴️ Conclusion: Derivatives sentiment is constructive, not euphoric; room for further upside exists.
⊢
🜎 Strategic Insight – On-Chain Oracle:
∴ On-chain metrics reflect a stable yet cautious accumulation phase;
∴ Absence of sell pressure, tempered long-term holder realization, and moderate derivative sentiment suggest foundation for continuation, albeit with reduced immediate force;
∴ Confirmation must align with price and volume.
⊢
⧉ III. Contextvs Macro–Geopoliticvs – Interflux Economicvs:
▦ Geopolitical Axis – Middle East Ceasefire:
∴ Ceasefire between Israel and Iran eased global tension, triggering flight from commodities into risk assets;
∴ Brent crude declined over -2.5% following truce reports, reducing inflationary pressure;
∴ However, geopolitical fragility remains - peace is provisional, not structural;
✴️ Conclusion: Tactical relief observed; no systemic safety guaranteed.
⊢
▦ Monetary Policy – US Federal Reserve Outlook:
∴ Jerome Powell signals continued rate hold, citing sticky inflation and fragile global equilibrium;
∴ Futures markets price ~20% chance of July cut, ~60% for September;
∴ Bond yields retreating (2Y at ~3.78%), suggesting easing expectations embedded;
✴️ Conclusion: Macro liquidity conditions marginally favorable to crypto; policy risk remains asymmetric.
⊢
▦ Equities & Global Sentiment – Dow Jones / Nasdaq Futures:
∴ Dow Futures flat (~+0.02%), Nasdaq Futures rise on tech optimism;
∴ Equity markets supported by decline in oil, stabilization in rates, and AI-sector inflows;
∴ No VIX spike – volatility subdued;
✴️ Conclusion: Macro-risk appetite firming up, enhancing crypto’s speculative appeal.
⊢
▦ Derivatives Behavior & Institutional Flow:
∴ Option markets show accumulation of BTC calls at 108K–112K strike zones;
∴ Futures funding positive but low, consistent with healthy long-side conviction;
∴ No structural imbalance detected;
✴️ Conclusion: Derivatives support scenario of moderate bullishness without speculative overreach.
⊢
⌘ Codicillus Silentii – Strategic Note:
∴ Temporal architecture remains bullishly aligned, but lacks velocity – movement is present without ignition;
∴ On-chain metrics reveal quiet distribution among long-term holders, yet without aggressive miner displacement or exchange flooding;
∴ Market tension is suspended in a state of equilibrium – neither contraction nor breakout assert dominion;
∴ The asymmetry of opportunity lies dormant, awaiting conviction in participation and volume.
⊢
𓂀 Stoic-Structural Interpretation:
▦ Structurally Bullish – Tactically Suspended:
∴ Price structure above EMA21 and SMA200 confirms preservation of macro uptrend – foundation remains unbroken;
∴ Miner reserve reduction and stable LTH-SOPR suggest controlled realization, not structural weakness;
∴ However, Ichimoku flattening and low volume expansion indicate stalling momentum, lacking breakout substance.
⊢
▦ Tactical Range Caution:
∴ Whale Ratio mid-levels and SSR elevation highlight proximity to potential resistance exhaustion;
∴ MACD crossover remains unconfirmed; RSI enters constructive zone without strength – reactionary rather than initiative-based;
∴ Until volume and oscillator confirmation emerge above $108.2K, posture remains protective and selective.
⊢
⧉
⚜️ Magister Arcanvm (𝟙⟠) – Vox Primordialis!
𓂀 Wisdom begins in silence. Precision unfolds in strategy.
⧉
⊢

A Disciplined Approach to BTC/USDT - Wait for the Right Set Up!Right now, I’m closely monitoring BTC/USDT — and what immediately jumps out is how aggressively this rally has pushed upward 🚀. We’ve seen price climb into a key external range high, taking out liquidity that was likely sitting just above those prior highs 💧.
This kind of move is often where institutional players step in to offload positions, as the liquidity makes it easier to find counterparts for previous accumulation phases 🏦. The way this price action is unfolding, I wouldn't be surprised to see a correction or retracement soon.
With the market this stretched, I’m not looking to get long here — especially not while BTC is trading at such a clear premium 🎯. No edge in chasing the highs.
Instead, I’ll be sitting back, waiting for a healthy pullback and a confirmed bullish structure shift before considering any entries 🔄📊. There’s no need to force trades in these conditions. Patience protects capital 🛡️.
⚠️ As always, this is not financial advice — just my current market perspective.

BTC LONG TP:106,600 24-06-2025We’re looking for a quick long from 104,500 to 105,100, aiming for targets between 106,400 and 107,100.
This move offers an average 4 RR on the 1-hour timeframe, and we expect it to play out within 12 to 16 hours.
Technical context: BTC still needs to reach the 107k area before showing signs of a reversal. This is a potential pre-drop pump setup.
Manage your stop-loss according to your strategy and stay updated for the next move.
We don’t use indicators, we’re not out here drawing lines or cute little shapes — I just give you a clean trade.
If price doesn’t move within the expected time, the trade becomes invalid.

BTCUSDT Technical Outlook TC is trading at $106k , with resistance confirmed near $106.14k–$106.22k and support at $104.8k .
A daily drop below $104.8k would confirm a short setup. Conversely, a break above $106.2k on elevated volume is required to challenge the $107k–$108k zone.
Absent significant volume, expect continued sideways action between $105k–$106k.

BTC is expected to retreat in the short term, focus on 104500📰 Impact of news:
1. The ceasefire agreement reached earlier did not take effect, and Trump believed that both sides violated the agreement
2. Federal Reserve Chairman Powell delivered a speech 3 hours later
📈 Market analysis:
I haven't updated BTC for a while. Today I want to share my views on BTC with you. BTC is currently encountering resistance and pressure at the 106,000 level and is beginning to retreat. From the technical indicators, MACD is in a dead cross, and RSI is retreating after reaching the overbought area. There is no problem with the short-term bearish trend, and it is expected that it will be able to retreat to the 104,500 level without much problem. However, the recent decline in the gold market, DXY market, and crude oil market may cause funds to flow into the BTC market.
🏅 Trading strategies:
SELL 106000-105500
TP 105000-104500
BUY 140500-103500
TP 105000-106000
If you agree with this view, or have a better idea, please leave a message in the comment area. I look forward to hearing different voices.

Bitcoin Targets $105K as Portfolio Share Soars But...
The year 2025 is proving to be a watershed moment for Bitcoin. The world's premier cryptocurrency has solidified its position as the bedrock of digital asset portfolios, now accounting for nearly one-third of all holdings, a testament to its growing acceptance as a legitimate macro-asset. Yet, this rising dominance belies a fractured and complex market landscape. While institutional giants and sovereign wealth funds systematically increase their Bitcoin allocations, a counter-current is flowing through the retail sector, where investors are rotating into high-potential altcoins, spurred on by the promise of new investment vehicles. This bifurcation is unfolding against a backdrop of dramatic price swings, conflicting technical forecasts, and a potent mix of macroeconomic and geopolitical catalysts, painting a picture of a market at a pivotal crossroads.
The headline statistic is striking: as of mid-2025, Bitcoin's share in investor crypto portfolios has climbed to nearly 31%, a significant increase from the previous year. This growth has persisted through months of volatility, including harrowing dips below the psychological $100,000 mark and powerful rallies reclaiming levels above $105,000. The market is being pulled in opposing directions. On one hand, bullish tailwinds are gathering force. A ceasefire in the Middle East has calmed geopolitical jitters, restoring appetite for risk assets. Simultaneously, hints from the U.S. Federal Reserve of a potential July interest rate cut have investors anticipating a surge of liquidity into the market.
However, a sense of unease permeates the technical charts. Some analysts warn of a "final crash" still to come, drawing parallels to the market structure of 2021. On-chain analysis has identified the $97,000 to $98,000 range as a critical market pivot, a line in the sand that could determine the next major trend. Meanwhile, other models, like the Elliott Wave count, predict a corrective crash to as low as $94,000 before any new highs can be sustainably achieved.
This is the story of Bitcoin in 2025: a maturing asset cementing its institutional role while navigating the turbulent waters of retail speculation, macroeconomic shifts, and its own volatile price cycles. The journey toward becoming a third of all crypto holdings has not been a straight line, but a dramatic tug-of-war that will define the future of the digital asset class.
Part 1: The 31% Benchmark - Bitcoin's Ascendant Portfolio Dominance
The steady climb of Bitcoin to nearly 31% of investor portfolios is the defining trend of 2025. This figure, a cornerstone of market analysis this year, underscores a profound shift in investor conviction. Through a period marked by six-figure price tags and gut-wrenching volatility, the average investor has not been scared away but has instead deepened their commitment to the original cryptocurrency. This suggests a maturing "buy the dip" mentality, where price corrections are increasingly viewed not as a crisis, but as an opportunity to accumulate a long-term store of value.
The primary engine behind this trend is unmistakable: institutional adoption. The floodgates, first opened by the launch of spot Bitcoin ETFs, have become a torrent of institutional capital in 2025. Sovereign wealth funds, major financial institutions, and public companies are now systematically accumulating Bitcoin, treating it as a core component of their treasury and investment strategies. Observations of institutional trading desks indicate this buying pressure from large-scale investors intensified in the first half of the year, even as retail activity showed signs of slowing. This institutional stamp of approval is reflected in the growing number of Bitcoins held in various corporate treasuries and exchange-traded funds.
This institutional embrace of Bitcoin has been fueled by several factors. First, an increasingly innovation-friendly regulatory environment in the United States has provided the clarity that large, compliance-focused firms require. Second, Bitcoin’s performance has been undeniable. Following recent shifts in the political landscape, Bitcoin has outperformed many major global assets, including stocks, treasuries, and precious metals, solidifying its reputation as a powerful portfolio diversifier.
This "flight to quality" within the crypto space has also created a distinct rotation story. As institutions fortify their Bitcoin positions, they appear to be de-risking by moving away from more speculative assets that were darlings of the previous cycle. The most notable casualty of this shift has been Solana. Once a high-flyer, Solana's narrative has "cooled" in 2025. Its portfolio weight among investors has seen a sharp decline since late 2024, as institutional capital pivots toward assets with perceived staying power and clearer narratives. While some analysts see this cooling phase as a potential accumulation opportunity before a new leg up, the dominant trend has been a rotation out of Solana and into the perceived safety of Bitcoin.
Part 2: The Great Divide - A Tale of Two Investors
The crypto market of 2025 is characterized by a stark divergence in strategy between its two main cohorts: institutional players and retail investors. While their actions collectively push Bitcoin's portfolio share higher, their underlying motivations and asset choices paint a picture of two different worlds.
The Institutional Playbook: Slow, Steady, and Strategic
For institutions, Bitcoin has become the undisputed king. Their approach is methodical and long-term, driven by a desire for a non-sovereign, inflation-resistant asset that acts as a hedge against macroeconomic instability. The attributes of scarcity, immutability, and portability are paramount in their decision-making. The advent of regulated products like spot ETFs has been a game-changer, providing a familiar and secure access ramp for deploying significant capital.
These large players are not chasing the explosive 100x gains that define crypto lore. Instead, they seek sustained, risk-adjusted returns from an asset that is increasingly uncorrelated with traditional markets during times of stress. Their strategy is one of accumulation, and their exit from more volatile altcoins like Solana is a clear signal of a de-risking mandate. They are building foundational positions in the asset they view as "digital gold," positioning themselves for a future where Bitcoin is a standard component of diversified global portfolios.
The Retail Rebellion: Chasing the Next Big Narrative
In stark contrast, retail investors appear to be reducing their direct Bitcoin holdings. This is not necessarily a rejection of Bitcoin's value, but rather a strategic reallocation of capital toward what they perceive as the next frontier of high growth. Having witnessed Bitcoin's journey to a multi-trillion-dollar asset, many retail participants are now hunting for "the next Bitcoin"—assets with a lower market capitalization but a powerful, near-term catalyst that could trigger exponential gains.
Part 3: The Analyst's Crystal Ball - Price Targets and Technical Tremors
Navigating the Bitcoin market in 2025 requires a steady hand and a tolerance for conflicting signals. While macro-environmental factors are painting a bullish picture, technical and on-chain analyses are flashing cautionary signs, creating a tense equilibrium between hope and fear.
The Bullish Case: A Confluence of Catalysts
The bulls have strong reasons for optimism. A key level on every trader's chart is $105,000. This price is seen as a critical "trend switch"; a decisive break and hold above this zone would signal the end of the recent consolidation and the beginning of a new, powerful phase of the bull market. This optimism is underpinned by powerful external forces.
First, the U.S. Federal Reserve has been signaling a potential interest rate cut as early as July. Historically, lower interest rates reduce the appeal of traditional yielding assets like bonds, pushing investors toward riskier, high-growth assets. This injection of liquidity into the financial system has often preceded significant rallies in Bitcoin, and the market is pricing in this possibility.
Second, a significant de-escalation of geopolitical tensions has bolstered market confidence. The announcement of a ceasefire between Israel and Iran caused an immediate and positive reaction in risk assets. Bitcoin surged past $105,000 on the news, demonstrating its sensitivity to global stability. During times of acute conflict, markets often experience a flight to safety, but when tensions ease, that capital flows back into assets like Bitcoin, which thrive on renewed risk appetite.
The Bearish Counterpoint: Echoes of the Past and On-Chain Warnings
Despite the bullish macro-outlook, clouds remain on the horizon. Some market commentators are warning that the current market is mirroring the patterns of 2021, suggesting that one "final crash" may be necessary to flush out leverage and establish a firm bottom before a sustainable move to new all-time highs.
This thesis is supported by specific technical models. Proponents of Elliott Wave Theory, a method of analysis that posits markets move in predictable, repetitive wave patterns, suggest a significant correction is due. Some Elliott Wave counts predict a corrective move down to the $94,000 level, which would represent a substantial pullback from current prices. Such a move would be seen as a healthy, albeit painful, corrective wave before a final, explosive impulse higher.
Adding weight to this cautious outlook is deep on-chain analysis. A close look at blockchain data pinpoints the $97,000 to $98,000 zone as the market's next true "pivot." This range represents a massive concentration of supply where a large volume of Bitcoin was previously acquired. This means a large cohort of investors has a cost basis in this zone. As the price approaches this level from below, it will likely meet significant selling pressure from investors looking to break even. A failure to decisively break through this wall of supply could trigger a sharp rejection and validate the bearish corrective scenarios.
The Derivatives Dilemma: A Market in Flux
Further complicating the picture is the state of the Bitcoin derivatives market. Reports indicate that futures buying activity has declined sharply, suggesting that the speculative fervor that often fuels rallies may be waning. This can be interpreted in two ways. The bearish view is that speculators are losing confidence, and the market lacks the momentum for a continued push higher. However, a more bullish interpretation is that the market is purging excessive leverage, creating a more stable foundation for a rally built on spot buying—the very kind of buying being done by institutions. This faltering derivatives activity, contrasted with strong institutional spot accumulation, could mean the current rally is in "stronger hands" than previous, more speculative-driven cycles.
Part 4: The Broader Ecosystem - A Story of Diverging Fates
The cross-currents shaping Bitcoin's trajectory are creating ripple effects across the entire crypto ecosystem, with the diverging fortunes of XRP and Solana serving as perfect case studies for the market's 2025 themes.
Beyond the Majors: The Speculative Fringe
As always, the crypto market maintains a speculative fringe. The emergence of assets like "BTC Bull Tokens" represents the high-leverage, high-risk plays that appear during bull markets. These instruments are designed to offer amplified returns on Bitcoin's price movements and attract the most risk-tolerant traders. Their existence underscores the full spectrum of the market—from sovereign wealth funds methodically buying Bitcoin for their treasuries to degens betting on leveraged tokens, the digital asset ecosystem remains a place of immense diversity and opportunity.
Conclusion: Bitcoin's Maturation in a Fractured Market
The year 2025 will be remembered as the year Bitcoin truly came of age as an institutional asset, firmly planting its flag and claiming one-third of the crypto investment landscape. This growing dominance, driven by the steady, strategic accumulation of the world's largest financial players, has provided a powerful anchor in a volatile market.
Yet, this newfound maturity has not tamed the market's wild spirit. It has instead created a great divide. While institutions build their Bitcoin fortress, retail investors are on the hunt for the next narrative-driven explosion, pouring capital into assets like XRP with the hope of front-running a transformative ETF approval.
The market is consequently balanced on a knife's edge. Bullish macroeconomic and geopolitical tailwinds are pushing for a breakout to new all-time highs beyond the pivotal $105,000 level. At the same time, technical and on-chain analyses warn of a potential final washout, a corrective crash to the mid-$90,000s that may be necessary to reset the market for a sustainable ascent.
Bitcoin's path forward will be carved by the resolution of these opposing forces. Can the quiet, persistent demand from institutions absorb the selling pressure from short-term traders and navigate the technical resistance zones? Or will the speculative fervor and corrective patterns that have defined its past cycles pull it down once more before it can climb higher? Whatever the outcome, 2025 has made one thing clear: Bitcoin is no longer just a speculative digital curiosity. It is a global macro asset at the heart of a complex and evolving financial ecosystem, and its journey is far from over.
How to Tell BITCOIN is BULLISH using MOVING AVERAGES OnlyBTC is trading sideways and it sparks a lot of debate whether or not we are at the beginning of a new bearish cycle, or if there is still a push upwards waiting to happen.
Here's how you can use the Moving Averages to determine whether or not BTC is bullish.
Don't miss this update on my stance on the market and why I think ALT Season is waiting:
______________________
BINANCE:BTCUSDT
