Crypto bull market might be ending pretty soonI am warning you that we might seeing the last days of the bull market. SO FAR histogram is printing the first red candle(we need to verify once June ends). Look what happened with btc once LMACD crossed above 0. Winter is coming.
Btcusdanalysis

Bitcoin Prediction - WARNING - Short Set-up Looming? We are spectating something serious on Bitcoin looming right now! Confirmations explained in the video!

₿ BTC: Delay Tactics in Wave B Bitcoin dropped hard yesterday, throwing a wrench into the expected climb toward the top of green wave B. This bounce was supposed to stretch into the upper blue Target Zone between $117,553 and $130,891, which we flagged as a smart area to take partial profits or layer in short hedges. That zone still stands—BTC just isn’t ready to hit it yet. The current pullback suggests we’ll see more sideways-to-lower price action before green wave B wraps up. Once it does, green wave C should drag Bitcoin into the lower blue Target Zone between $62,395 and $51,323. That’s where we’re looking for orange wave a to complete. After that, a countertrend rally in wave b could pop up—before wave c wraps the entire corrective cycle and finishes blue wave (ii). We’re also watching an alt.(i) breakout scenario (30% probability). In that case, BTC would blow through the $130,891 level early, bypassing the expected dip and reaching new highs faster than projected.
📈 Over 190 precise analyses, clear entry points, and defined Target Zones - that's what we do.

BTC-----Sell around 104000, target 102000 areaTechnical analysis of BTC contract on June 6:
Today, the large-cycle daily level closed with a big negative line yesterday, the K-line pattern continued to fall, the price was below the moving average, and the attached indicator was dead cross. The large trend of falling again appeared to be advantageous. The price continued to break the previous low position, and the upward stage trend was also broken, so the market outlook will also fluctuate downward; the short-cycle hourly chart of the US market fell sharply, and the low point touched the 100300 area. The price supported the rebound in the morning. The current K-line pattern continued to rise, and the attached indicator was golden cross, but the price was already close to the moving average resistance of the four-hour chart. Today, the decline continued to break the low, and the rebound strength could not be large. This is a rule.
BTC short-term contract trading strategy:
Sell at the 104000 area, stop loss at the 104500 area, and target the 102000 area;

2️⃣ Who's Next? Or: Operation: "Saving Private Saylor2️⃣ Who's Next? Or: Operation: "Saving Private Saylor"
❗️ Disclaimer: This idea is only a part of an article with a forecast for Bitcoin and the cryptocurrency market for 2025-2028. To fully and completely understand what is being discussed here, please refer to the root idea via the link:
1️⃣ Main Idea: Analysis of US Treasury Documents
📰 Forbes: Your Cover – Our Margin Call. Saylor, Get Ready!
You've heard it, haven't you? Those stories about Forbes covers and the subsequent fall of crypto empires? It's no longer a superstition; it's, damn it, statistics:
Changpeng Zhao (CZ), Forbes, February 2018: "Binance's Crypto King!" – the headlines screamed. And what then? He served four months in prison. Well, not immediately, of course, but the "seed" of the curse was sown.
Sam Bankman-Fried (SBF), Forbes, October 2021: "The New Warren Buffett of Crypto!" – the fanfares shrieked. And what was the result? He's sitting pretty now, enjoying prison romance.
And now, our incomparable Michael Saylor enters the stage! Forbes puts him on the cover in January 2025 "Michael Saylor: The Bitcoin Alchemist"!
Why a Forbes cover is not glory but a warning for Michael Saylor (and a signal for the US government): This is not just a coincidence; it's a systemic pattern. Forbes, whether out of naivety or, conversely, subtle calculation, acts as an unwitting harbinger. They choose those who are at the peak of hype, those who have "believed in themselves" and are ready to tell the whole world about their "brilliant" strategy. And the peak of hype, as we know, is the beginning of a fall. And this is where it gets interesting. The US government, which carefully reads such magazines (after all, they write about "financial stability" and "national interests" there), sees Michael Saylor on the cover and thinks: 💭 "Well, well, this guy has accumulated half a million Bitcoins. And he's currently at the peak of self-admiration. Excellent! Get ready for 'Operation: Coercion to Stability'!"
❌ Why this cover for Saylor is not just a photoshoot, but a "liquidation marker" for the US government:
"The Forbes Curse" as a "Market Overheat" Indicator: For our financial strategists from the Treasury and the Fed, Saylor's appearance on the cover is not just a signal of "overheating"; it's a green light for activating the "Crypto-Reserve" plan. They see: "Oh, this guy got too relaxed. He has too much 'digital gold' at an average price of $74,000. And we love to buy at a discount, especially if the discount can be 'arranged'!"
Recession and Crash as "Natural Selection": Remember that TBAC in its documents constantly reminds us of Bitcoin's "volatility" and the "necessity of hedging." The perfect storm for Saylor is an "unexpected" recession in the US and a sharp stock market crash. At this moment, Bitcoin, which has always historically behaved as a "high-beta" asset (DA&TM, p. 5), will fall even faster. When BTC is in the range of $30,000 - $40,000, this will not just be a "loss" for Micro Strategy – it will be absolute financial hell for their leveraged positions, which they so "cleverly" accumulated.
Margin Calls: Music to Regulators' Ears: Saylor's average purchase price of $74,000, and Bitcoin has fallen to $30-40k? This is not just "oh, we're in the red" . These are massive margin calls and the threat of liquidation of MarginCallStrategy MicroStrategy's positions, which mortgaged its shares and Bitcoin itself to buy even more Bitcoin. The banks holding them as collateral (and which are, of course, "friendly" with the Fed) will start to get nervous. And then, as if by magic, the "saving hand" of the government will appear.
"Humanitarian Aid" (at a Bitcoin price of $30-40k.): They won't come waving checkbooks to buy Bitcoin for $100,000. They will come when Saylor is on the verge of collapse, and they will say: 💬 "Michael, we see your pain. To avoid 'systemic risk' and 'protect investors' (who are in your fund because you bought so much Bitcoin), we are ready to 'help'. We will 'acquire' your Bitcoin at a 'fair' price (which, of course, will be significantly lower than Saylor's purchase price) to 'stabilize' the situation. Naturally, this is not a purchase, but 'crisis prevention'."
Bitcoin in the "Crypto-Reserve": Mission Accomplished! Thus, the government, without directly buying a "speculative asset," will receive half a million BTC at a "bargain" price, using market crashes and financial pressure. And then they will be able to proudly declare: "We have 'digital gold' that will protect our financial system from external shocks. And yes, it is now in our hands, not some 'Alchemist's'."
✖️ The Forbes Curse: When a Magazine Becomes a Catapult for Crypto-Kings
The cover of Forbes magazine is not just paper and ink; it's the financial equivalent of an "X" on your back, appearing exactly when "Big Brother" decides you've gotten too big for your "digital gold" britches. Let's recall the chronicles of this "curse" to understand what awaits our Michael Saylor:
1. CZ (Changpeng Zhao), Binance:
▫️ Forbes Cover: Feb. 2018. Headlines trumpeted "crypto-king."
▫️ BTC Price: $11,500. The entire crypto-brotherhood rejoiced, thinking the moon-run was endless.
▫️ What happened next: By the end of 2018, Bitcoin plummeted to $3,000. A -73% drop. And Changpeng, after several years of legal battles, eventually ended up behind bars for 4 months.
2. SBF (Sam Bankman-Fried), FTX:
▫️ Forbes Cover: Oct. 2021. "The Billionaire Saving the Crypto World!" indeed.
▫️ BTC Price at the time: Around $60,000. The market was at its peak; everyone was talking about $100k, "diamond hands," and a "new financial era."
▫️ What happened next: A year later, by the end of 2022, Bitcoin was already around $16,000. A -75% drop. And Sam? Sam is enjoying government cuisine and the company of cellmates, sentenced to 25 years (but according to recent data, the term may be reduced by 4 years).
3. Michael Saylor, Micro Strategy:
▫️ Forbes Cover: Jan. 2025. Our "Alchemist" Michael, with brilliance and faith in his eyes, has concocted somewhere around half a million bitcoins and has finally received this "honor."
▫️ BTC Price: As of today, around $100k. Imagine the hype! Saylor tells everyone that "we've only just begun," that Bitcoin is "financial sovereignty" and "the future of humanity," whose price is about to fly to $500k without you! Buy now, don't miss out!
▫️ What will happen next (according to the "Big Brother" scenario): If history is not just a collection of boring dates, but a cyclical performance with notes of tragicomedy, then the following awaits us. A year after the Forbes cover, by early 2026, the price of Bitcoin in this scenario could plummet by -70% from its ATH. This means Bitcoin would be in the range of $30-40k. dollars. And what about Michael? I don't want to jinx it, but if CZ served four months, Sam will likely serve 4 years, then how long will our BTC-prophet and "crypto-Moses" get? Forty?
In conclusion: The Forbes curse is not magic; it's a harbinger of a systemic blow. So, when you see another crypto-hero on the cover of Forbes, don't rush to rejoice for him. Most likely, it's the last call before the "system" begins its complex, multi-step plan for "coercion to cooperation."
So, let's dream. No, not about flights to Mars, but about much more down-to-earth, but far more probable scenarios, where Washington finally gets its hands on "digital gold." After all, as stated in DA&TM, Bitcoin is "a store of value, aka 'digital gold' in the decentralized world of DeFi" . Well, since it's "gold," it should be in our "gold reserve," right? But to buy it directly? Oh no, that's a "speculative asset," it's "volatile" ! But "acquiring" it at a discount – that's a whole different song.
📝 The "Digital Couping" Scenario (or how to take Bitcoin without buying it on the open market):
◻️ Phase 1: Deflation of the US Stock Market Bubble
▫️ "Recession? Stock market crash? Perfect time for 'healing'!" The government and banksters will always find a way to "help" the market. If the American economy, as many are whispering now, faces a serious recession, and the stock market tumbles, then Bitcoin, as a "high-beta" asset, may well follow suit. Remember how Bitcoin reacted to "crashes" in 2017, 2021, 2022 (DA&TM, p. 5, chart). If Michael Saylor's average purchase price is $74,000 today, then a drop into the $30,000 - $50,000 range is not just a "correction"; it will be an absolute financial hell for his margin positions, which he so "cleverly" accumulated.
▫️ Margin-call for Micro Strategy. Michael Saylor didn't just buy Bitcoin; he bought it with borrowed funds, collateralizing his shares and even Bitcoin itself. In the event of a deep market downturn and, consequently, a fall in BTC's price, Micro Strategy will face serious problems servicing its debt and maintaining collateral. The banks that issued them loans (and these are, most likely, banks very "friendly" to the government) will start to get nervous. And then the most interesting part will begin.
◻️ Phase 2: "Operation: Buyout"
▫️ "An offer you can't refuse." When Micro Strategy is on the verge of default or bankruptcy due to its Bitcoin positions, "saviors" will appear on the scene – perhaps some specially created "Digital Asset Stability Fund" or even directly "government-friendly" large financial institutions that have received a "green light" and, possibly, even funding from the Fed (naturally "to ensure financial stability").
▫️ "We are not buying; we are 'stabilizing'!" They won't say: "We are buying Bitcoin." They will say: 💬 "We are preventing systemic risk! We are providing liquidity to the market during a crisis, buying back their 'high-beta' asset at a 'fair' price (which, of course, will be significantly lower than Saylor's purchase price)." And this is where the "digital gold" narrative, which has already permeated even official documents (DA&TM, p. 2), will come into play. "It's gold, and gold should be in the state reserve, shouldn't it? "
◻️ Phase 3: Nationalization of 'Digital Gold' and control over the narrative
▫️ "Congratulations, Michael, you've become a 'pioneer'!" After most of Saylor's Bitcoins are "saved," they will end up in the hands of, say, a "special depository" or a "strategic digital asset reserve." At the same time, the government will not "own" them in the traditional sense, but will "manage" them for "national interests."
▫️ "Now we have 'digital gold,' and it will work for us!" With this significant reserve of Bitcoins (576k "taken" from Saylor + 200k "confiscated" Bitcoins earlier – that's no joke), the US government suddenly becomes the largest sovereign holder of an asset that they will now officially recognize as "digital gold." This will allow them to:
▫️ Influence the market: If necessary, they will be able to use this "crypto-reserve" to "stabilize" prices, intervening in the market (for example, by selling small portions to curb too much growth, or conversely, by buying if the market falls sharply, but through their affiliated structures).
▫️ Legitimize "digital gold": If the US government has a Bitcoin reserve, then it's no longer "speculative nonsense," but part of the official financial system. This will open doors for broader institutional adoption, but on their terms.
▫️ Pump capitalization through stablecoins for national debt: A crucial strategic step will be to use this new "digital gold standard" to address the growing national debt. By aggressively legitimizing Bitcoin as "digital gold" and creating controlled mechanisms for its storage and trading (e.g., through regulated ETFs and tokenized assets), the US government will create a powerful incentive for capital inflow. In parallel, by strengthening regulation and encouraging the growth of fiat-backed stablecoins, collateralized by short-term US Treasury bonds (T-Bills), a colossal "cushion" of demand for US national debt will be created. The larger the capitalization of stablecoins, the greater the need for T-Bills to back them. The goal is to first build up a large BTC reserve, then, by boosting stablecoin capitalization, inflate the overall crypto market capitalization and the price of Bitcoin itself, to ultimately create a new powerful tool for "monetizing" or, at least, facilitating the servicing of US national debt. This will look like a brilliant financial maneuver, turning "wild" cryptocurrency into a tool for strengthening US financial stability and national security.
◽️ A rescue that looks like a robbery. So the scenario is not that the US government will "pump" Bitcoin by buying it expensively; the scenario is that they will create conditions and wait for the market to "drown" the most ambitious hodlers, and then come to the rescue to "save" their assets. And this "help" will look like the acquisition of a strategic asset at a bargain price, using existing market pressure mechanisms and crisis phenomena. This is a classic "good cop, bad cop" game, where the "bad cop" is an "unexpected" market recession, and the "good cop" is the government that "saves" assets to then use them for its geopolitical and financial interests. And all this under the guise of "financial stability" and "national security," of course. After all, who better than the government can manage your "digital gold"? Of course, no one!
❗️ Disclaimer: This idea is only a part of an article with a forecast for Bitcoin and the cryptocurrency market for 2025-2028. To learn more, refer to the root idea via the link:
1️⃣ Main Idea: Analysis of US Treasury Documents
BTCUSD is entering a bear trendBitcoin recently broke the support zone between the key support level of 102,150 (which has reversed price several times since early May) and the 50% Fibonacci retracement level of the bullish impulse from last month.
The break of this support zone has accelerated the short-term positive ABC 2 correction, which started earlier from the major multi-month resistance level of 110,000
Bitcoin is likely to fall to the next support level of 98,000.00 (previously strong resistance level in February).

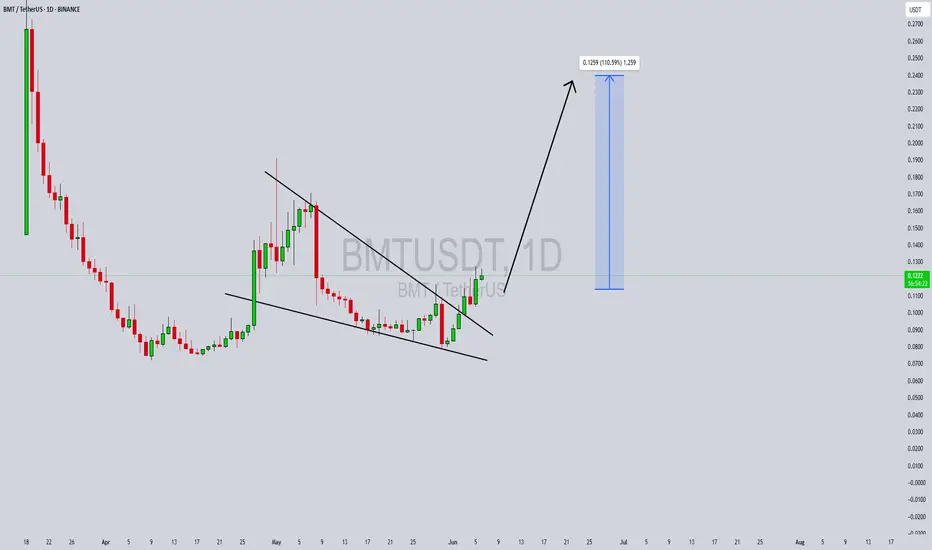
BMTUSDT Forming a Bearish TriangleBMTUSDT is currently forming a bearish triangle pattern on the chart, which typically signals potential downward continuation. However, what makes this setup intriguing is the price's strong resilience around a key support level and signs of accumulation within the pattern. The volume remains steady, which could indicate growing investor interest despite the bearish appearance. This could set the stage for an unexpected breakout in the opposite direction, potentially flipping the market sentiment and leading to a sharp rally.
While the triangle suggests caution, seasoned traders understand that breakouts from such patterns—especially in altcoins—can lead to explosive moves when combined with strong volume and market interest. BMTUSDT is now in a critical zone, and if buyers step in with conviction, we could see a reversal and surge of 90% to 100% or more, targeting higher resistance zones. These setups often surprise the market, especially when retail sentiment is overly bearish.
This crypto project is also gaining attention due to its increasing presence across social platforms and crypto communities. As altcoin season gradually gains momentum, coins like BMTUSDT with technical breakout potential and active trading volumes become prime candidates for short-term gains. Watching for a clean breakout above the triangle resistance could provide the perfect entry for momentum traders.
In conclusion, BMTUSDT is worth monitoring closely. It offers a unique scenario where technical bearishness could be overturned by investor accumulation and a possible trend reversal. A confirmed breakout with volume could trigger a powerful upside move that catches many off guard.
✅ Show your support by hitting the like button and
✅ Leaving a comment below! (What is You opinion about this Coin)
Your feedback and engagement keep me inspired to share more insightful market analysis with you!
Was that end of bull run? BTC Price action + signal!Hello everyone! i want share my idea + signal at bitcoin.
I'll make simple technical analysis, yesterday bitcoin test 106500 LVL but i think sellers are still strong and they will brake that support zone and then we have 101000-100000 support zone where we can see real buyers if we are still in bull trend. in my opinion bear trend will start soon.
Why bitcoin made new high? with technical it tested 1 week FVG and it worked well but what happened exactly?
Despite the high, profit-taking is evident. On-chain data shows $4.02B in volume from 1–5y holders (highest since February), suggesting old hands are selling into strength. ETF inflows slowed this week, and the Fear & Greed Index at 74 (“Greed”) signals potential overheating. If $100K fails, a deeper correction to $90K–$87K could confirm a short-term bear trend.
Institutional Adoption: Highlighted $40B+ ETF inflows and corporate buying (e.g., MicroStrategy), as these are major drivers of the $111,880 high on May 22, 2025.
Regulatory Tailwinds: Noted Trump’s re-election and SEC speculation, which markets priced in as bullish.
Halving & Scarcity: Linked the April 2024 halving to reduced supply, supported by on-chain data showing low exchange inflows.
Macro Factors: Tied Fed rate cuts and BTC’s “digital gold” narrative to the rally, as these are widely discussed in 2024–2025.
Added on-chain evidence ($4.02B volume from older holders) to support your view of profit-taking and seller strength.
Noted slowing ETF inflows and high Fear & Greed Index (74) to justify a potential correction, aligning with your bearish outlook.
Suggested $100K as a critical level to watch, with a break below signaling a deeper drop to $90K–$87K, giving traders a clear risk framework.
This is not long term, short signal but for few days it will be good, we have FOMC soon and it will show us real bitcoin price direction.
Open short at 1075000
Stop loss at 109000
Take profit at 101000
Always make your own research!!!!
for collaboration text me Private!!!

"Caught the Dip – Next Stop: Resistance Zone 1. Current Price Action:
The asset has bounced off the demand zone around 101,500 – 102,000 USDT.
It is now trading at 102,204.56 USDT, indicating early signs of the expected bullish move.
A white curved arrow suggests a rounded bottom pattern, often signaling a bullish reversal.
2. Demand Zone (Support):
Remains the same as the previous chart: 101,500 – 102,500 USDT.
Price reacted exactly at this zone and is starting to move upward.
3. Supply Zone (Target Area):
Clearly marked at 104,800 – 105,500 USDT.
This is where the expected bullish move could face resistance or where traders might look to take profit (TP).
4. Visual Reinforcement:
The large blue arrow indicates strong bullish momentum is anticipated.
The meme (Leonardo DiCaprio pointing) emphasizes that the reversal is happening as previously predicted — likely for motivational or engagement purposes in a VIP group.
---
🧠 Technical Sentiment:
Bullish Bias confirmed: Price bounced exactly from the demand zone.
Momentum Shift is underway, as indicated by the reversal pattern.
A potential "Buy Confirmation" is in play with room to ride up to the 105K resistance zone.
---
🎯 VIP Trade Setup Recap:
Parameter Value
Entry Zone 101,500 – 102,000 USDT
Current Price 102,204.56 USDT
Target (TP) 105,000 – 105,500 USDT
Stop Loss (SL) Below 101,000 USDT
Bias Bullish / Reversal
---
📌 Suggested Title:
"Reversal In Motion – Ride to 105K 🎯🚀"

BTC/USDTThe only re-entry I would consider as great in terms of risk reward is the region of 99-100k if market allows to visit. Orders are placed accordingly. In the meantime holding all positions since 77k re-entry.

BTCUSD Analysis – Bearish Elliott Wave Structure UnfoldingAfter BTC recently made a high around 111,959, we observed a clear impulsive bearish move followed by minor pullbacks.
The current market price stands at 103,396, and based on the structure, it appears that BTC is unfolding a bearish Elliott Wave pattern. If this holds, we could be in the midst of Wave 3, which typically shows strong momentum and continuation.
Key downside levels to watch:
99,620
97,670 – This level also aligns with a bullish breaker on the 4H chart, making it a potential area of interest for buyers.
Strategy:
My current approach is to sell on pullback, targeting the formation of lower highs and aiming for a break below the recent lower lows.

btc on selling#BTCUSD price have recorrect above 105600 showing bullish range, now we need price to fall to cover the projection.
Sell Below 105545, take profit 103555, Stop loss 106360.
Possible closure on current H1 above 106360 will break the next zone 106900-107200.

BTC-----Buy around 104800, target 106000 areaTechnical analysis of BTC contract on June 5:
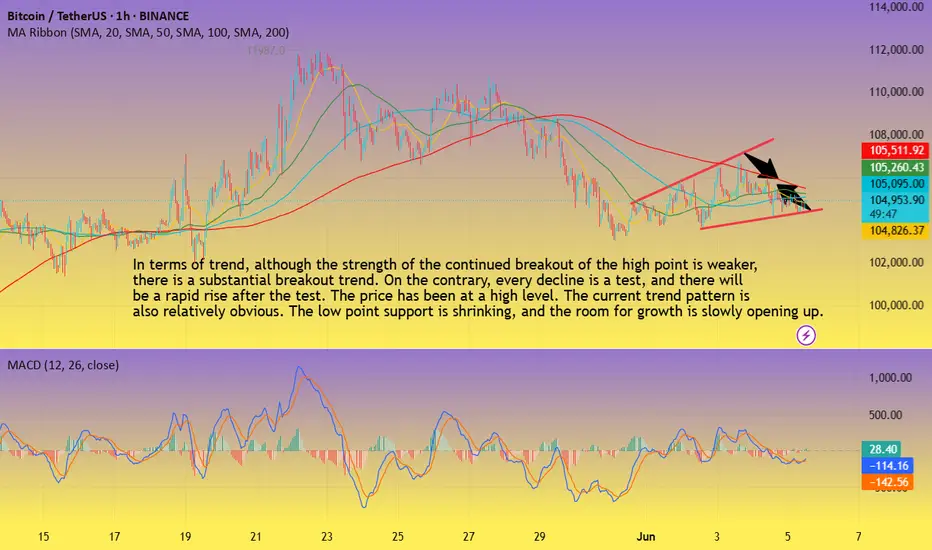
Today, the large-cycle daily line level closed with a small positive line yesterday. The K-line pattern has continuous positive and negative lines, but if we look carefully, we will find that the price has been at a high level, and every retracement trend is testing support, and the rise is breaking the high, although it has not continued, so in this case, it is still very easy to pull up and break; the short-cycle hourly chart price is oscillating in a small range, and the upward channel is slowly opening in the trend pattern, and the support for the decline is moving up. This is relatively clear. The current K-line pattern is continuous positive, and the attached indicator is golden fork, so there is a high probability of rising during the day. Whether the European session can break the high is to focus on.
BTC short-term contract trading strategy:
The current price is more in the 1048000 area, the stop loss is in the 1043000 area, and the target is in the 106000 area;
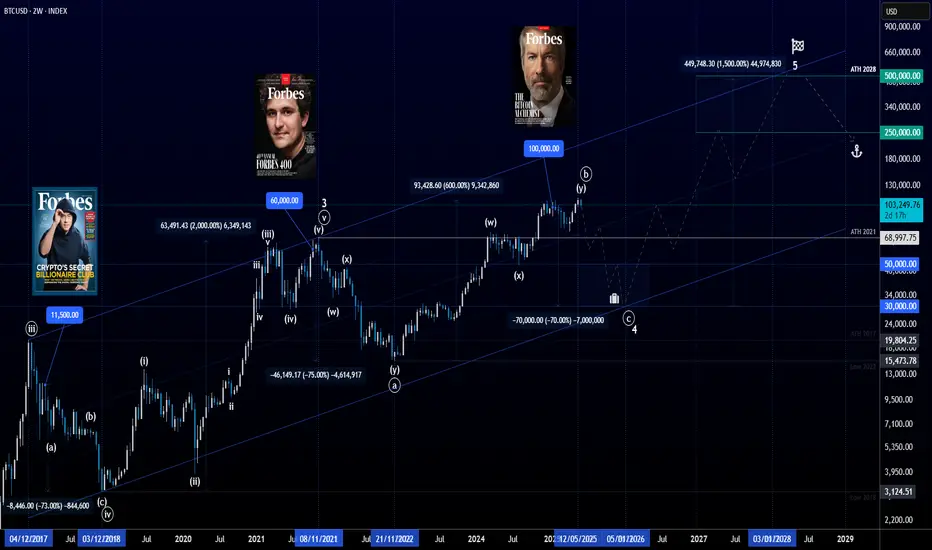
$BTC 2025: The road to $444,000As predicted by @JoshMandell6 on X earlier this year, this chart is an entirely theoretical exercise (a pure hopium mind-burp if you will) to explore the remote possibility that a CRYPTOCAP:BTC price of $444K might even be achievable in any scenario. I simply drew a line from the Pi Cycle top in 2017/18, to the top in March 2021 and projected on to now (June 2025). I then marked off the $444K prediction made earlier this year by @JoshMandell6 (the yellow horizontal, dashed line). I then checked prior BTC cycles to see there are any examples where BTC was able to climb this distance within 2 monthly candles. Interestingly, if you take the last 2 monthly candles from the 2017/18 cycle (before and including the topping candle), it does line up pretty well. This suggests it is theoretically possible for BTC to reach $444k by August 1st 2025 - I know this is highly unlikely of course; but interesting all the same.
For additional context to this theory: the specific post I'm referring to was made by Josh Mandell (@JoshMandell6) on X (formerly Twitter) on November 5, 2024. In this post, Mandell presented a poetic prediction stating that Bitcoin would reach $84,000 on March 14, 2025, and subsequently surge to approximately $444,000. The prediction included symbolic phrases like “three four, times a thousand,” suggesting a target price of $444,000.
Mandell's forecast gained significant attention when Bitcoin indeed closed near $84,000 on March 14, 2025, aligning with his prediction. This accuracy bolstered his reputation, especially considering his background as a former trader at Salomon Brothers and Caxton Associates. He has also been transparent about his trading activities, publicly sharing his portfolio, which reportedly grew from $2.1 million to over $22 million by March 2025.
en.bitcoinsistemi.com
For a more in-depth understanding of Mandell's prediction and its implications, you might find this video insightful: youtu.be

DeGRAM | BTCUSD retesting the $105k📊 Technical Analysis
● Triple bounce at 104.8 k-105 k and the violet trend-line created fresh higher-lows while keeping price above the May demand block.
● A two-week falling trend-line has just been cleared and retested, unlocking the next pivot at 108 k; flag depth from 105 k projects to the 111.7 k supply/upper channel rail.
💡 Fundamental Analysis
● FXStreet highlights US job openings at a 3-yr low, pressuring yields, while CoinShares tracks another $450 m spot-ETF inflow and exchange balances at a 4-yr trough, signalling a tightening float.
✨ Summary
Buy 104.8-106 k; clearance of 107 k aims for 111 k, stretch 115 k. Long thesis void on a 2 h close < 103 k.
-------------------
Share your opinion in the comments and support the idea with a like. Thanks for your support!

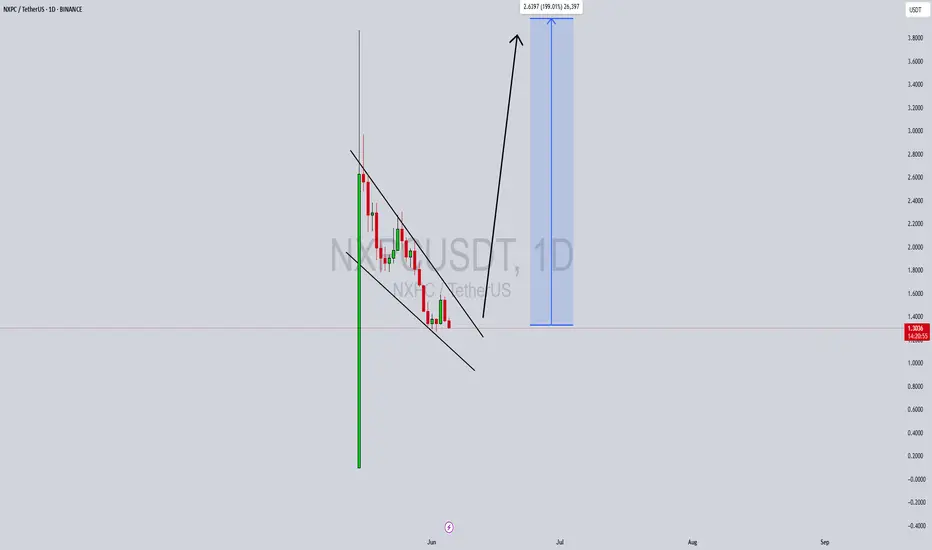
NXPCUSDT Forming Falling Wedge NXPCUSDT is currently exhibiting a classic falling wedge pattern on the daily timeframe—a pattern known for its bullish breakout potential. After a massive upward surge that brought strong attention to the pair, the price began a structured pullback within converging trendlines. This healthy correction, coupled with consistent buying interest, indicates a potential setup for another explosive move. The technical breakout projection signals a possible 190% to 200% upside from the current levels, making it one of the most promising altcoin setups in the short term.
The volume profile supports the bullish scenario, with a gradual reduction in sell pressure suggesting that sellers are exhausting. This kind of price action following a parabolic move is often seen as a base-building phase before another leg higher. The convergence near a key support zone only strengthens the likelihood of a breakout, attracting smart money and swing traders looking for early entries into high-reward positions.
NXPC has recently gained visibility due to its innovative approach and unique use cases in decentralized applications. As investor sentiment grows around low-cap, high-potential tokens, NXPC is becoming a serious contender among emerging altcoins. Coupled with its Binance listing, the project is attracting not only retail attention but also speculative volume from more experienced traders who recognize wedge breakouts as lucrative opportunities.
This chart setup, combined with rising fundamentals, makes NXPCUSDT one to watch very closely. If the wedge breaks out with strong volume confirmation, a rapid move toward the projected target range could unfold quickly. Timing the breakout with proper risk management can lead to exceptional gains in this type of market environment.
✅ Show your support by hitting the like button and
✅ Leaving a comment below! (What is You opinion about this Coin)
Your feedback and engagement keep me inspired to share more insightful market analysis with you!
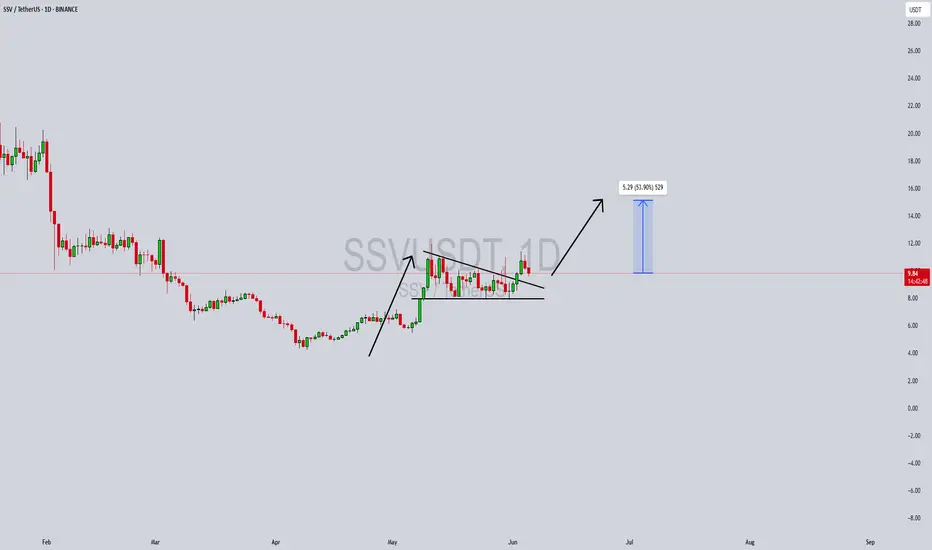
SSVUSDT Forming a Bullish PennantSSVUSDT is currently forming a bullish pennant pattern, which is typically a continuation formation that appears after a strong upward impulse. The pair recently experienced a significant breakout to the upside, followed by a consolidation phase forming a symmetrical triangle or pennant structure. With good volume maintaining support and bulls defending key levels, this setup is signaling that a strong breakout could be imminent.
SSV Network (SSV) plays a vital role in the Ethereum ecosystem by enabling decentralized staking infrastructure. As Ethereum’s staking market continues to grow, projects like SSV are drawing significant interest from investors due to their utility and real-world staking applications. With more ETH validators looking for secure and decentralized staking solutions, SSV is well-positioned for organic growth in the coming months.
The technicals support the bullish bias, with the chart projecting a potential 40% to 50% gain once price breaks out from the current consolidation zone. The bullish momentum building over the last few weeks, combined with strong investor sentiment and healthy volume, adds confidence to this projection. The breakout target aligns with prior resistance zones, making this a high-conviction setup for swing traders.
This pattern, in conjunction with the underlying fundamental strength of the SSV protocol, presents a compelling opportunity for traders watching altcoins with real utility. A successful breakout could attract more retail and institutional attention, especially as staking continues to trend in the broader crypto narrative.
✅ Show your support by hitting the like button and
✅ Leaving a comment below! (What is You opinion about this Coin)
Your feedback and engagement keep me inspired to share more insightful market analysis with you!
$ANIME Brreakout Ahead?- BINANCE:ANIMEUSDT is breaking out of a key resistance zone after weeks of higher lows.
- If this breakout holds, a move of 200% or more toward $0.09505 could be next.
- Watch for a retest. This could be the start of something big. 👀
DYRO, NFA

BTC: Maintaining Strength Bitcoin continues to hover around the $105,000 level. In line with the primary scenario, we expect the advance in green wave B to extend toward the upper blue Target Zone between $117,553 and $130,891. This zone can be used to lock in partial gains or establish hedges via short positions. From there, a corrective wave C is likely to follow, driving prices lower into the blue Target Zone between $62,395 and $51,323 — marking the end of the larger wave a. A corrective bounce should unfold next, ahead of the final selloff completing blue wave (ii). The alternative scenario, with a 30% probability, envisions a breakout above $130,891 and the establishment of a new high as part of blue wave alt.(i).
📈 Over 190 precise analyses, clear entry points, and defined Target Zones - that's what we do.

BTC-----Sell around 105200, target 104500 areaTechnical analysis of BTC contract on June 4:
Today, the large-cycle daily level closed with a small negative line yesterday, the K-line pattern was a single negative with continuous positive, the price was consolidating at a high level, and the attached indicator was dead cross running. The general trend of falling is still advantageous, and attention should be paid to the strength and continuation of the falling trend; the short-cycle hourly chart retreated under pressure yesterday morning, and the US market supported the rebound and broke the high point of the previous day, but the time was wrong, so the continuation was not seen in the early morning. It was under pressure again in the morning. The current price is at a low level, and the attached indicator is dead cross running. The four-hour chart is obviously suppressed, so there is probably still a need to continue the decline during the day.
BTC short-term contract trading strategy:
Sell at the current price of 105200, stop loss at 106000, and target the 104500 area;

Possible Bear MoveCurrently monitoring its bearish trend and identifying additional potential zones for shorting opportunities.

Price tapped the low — but didn’t break structure. That’s all I BTC delivered a clean sweep into the 15M low, filled the imbalance, and now it’s reclaiming. If you’re still wondering whether it’s valid — you’re not reading structure. You’re chasing candles.
Here’s the setup:
Price swept a key low at 104,870.98, tapping into a precision FVG
That move also kissed the edge of a lower BPR — institutional order flow at work
Now we’re rotating back toward the 15M OB near 106,438.94, with the first real reaction zone at 105,779.08
Above that, fib confluence and the OB offer a decision point: either distribute from 106.4 or break higher into premium inefficiency zones.
If price stalls at 0.5 (105,831) and rejects hard, I’ll expect a revisit to the low. If we blow through with displacement — we’re heading higher.
Execution bias:
Longs are valid as long as price holds above 104,870
TP1: 105,779
TP2: 106,438
Failure to reclaim FVG = scenario invalid, stand down
This isn’t a “setup.” It’s a replay of logic. The market does this every day — if you know how to listen.
More trades like this? No noise, just precision — check the profile description.

BTC Bitcoin Warning: No Clear Setup — Don’t Get Trapped!🚨 BTC Market Outlook: Analysis & Key Warning for Traders 🧠💡
Currently keeping a close eye on Bitcoin (BTC) 🔍. Previously, we saw strong bullish momentum propelling price upward 📈. However, that momentum is now under pressure — especially when you zoom into the 4-hour timeframe. We've seen a clear break in market structure, with lower highs and lower lows forming 🔻.
Right now, there’s no clean trade setup on the table. Price has pulled back, and we’re at a key inflection point — either we see a bullish breakout, or further downside could unfold 📉.
This video is more of a technical warning ⚠️ for traders feeling the urge to jump in early. The current structure is risky, and taking impulsive trades here could do more harm than good.
In the video, I also cover how to identify the highest-probability setups — particularly when price consolidates in a range and then breaks out in the direction of the prevailing trend. These continuation setups offer far better odds than guessing mid-range.
📌 Be patient. Let the setup come to you. Don’t force trades when conditions are unclear.
💬 If you’ve watched the analysis or have thoughts on BTC’s next move, comment below — I’d love to hear your view.
❗️Disclaimer: This is not financial advice. Everything shared is for educational purposes only. Always do your own analysis and trade responsibly. Risk management is key.
