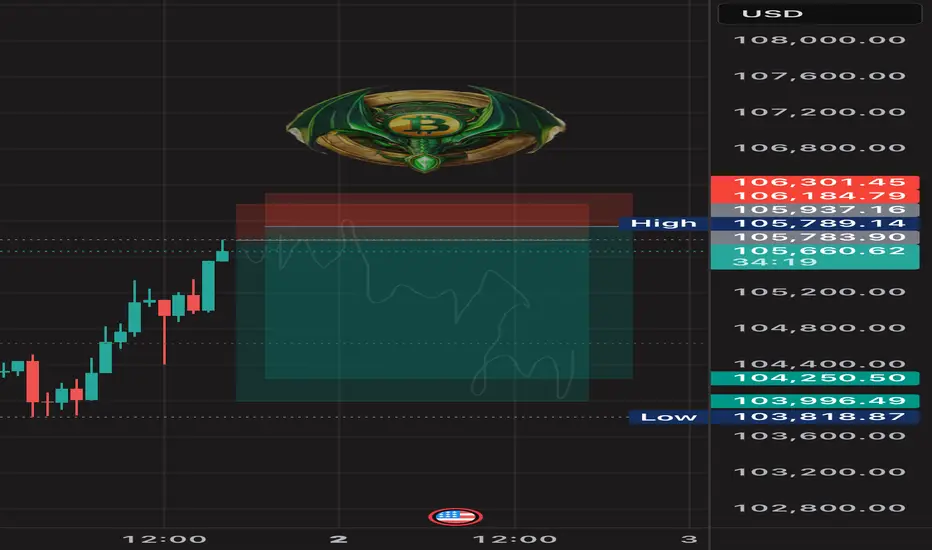
Price isn’t reacting — it’s delivering.BTC just tapped into the 4H FVG with surgical precision.
If you’ve been watching price the way Smart Money does, this wasn’t a surprise. It was the setup.
Here's the structure:
After reclaiming the 4H OB below, price expanded upward into the Fair Value Gap (FVG 4H)
That delivery aligns with the 0.0 fib at 106,770.4 — a premium zone engineered for liquidity harvesting
The next level above is the RB — Reversal Block — where I expect displacement to either fade or accelerate
What matters now is how price reacts on the pullback into the 0.382 → 0.618 fib range (105,338.9 to 104,454.6).
If we see structure hold, I’ll target 107,082.6 next.
If that zone fails — all eyes go back to the OB 4H at 103,023.2.
Execution clarity:
Holding above 104,454 → Long bias continues
Breaking 103,825 with follow-through? Reversal confirmed
Clean invalidation, clean targets — no guessing
The chart’s not lying. It's just speaking in algorithm.
Want trades like this before they hit the box? Check the profile description. Clarity doesn’t need noise. Just rules.
Btcusdanalysis

Bitcoin Looks Set for a Dip Before Its Next Big MoveRight now, Bitcoin is showing signs of cooling off after a solid run-up over the past few weeks. Looking at the chart, it seems like BTC is struggling to break through that descending trendline—it’s been rejected there more than once, and now it's likely heading lower in the short term.
Here’s what seems most likely: price pulls back toward the $99,000 support zone (highlighted in purple on the chart). That area has acted as a solid floor before, so it wouldn’t be surprising to see buyers step in again.
After that? If support holds and we see some momentum return, BTC could start climbing again. the chart suggests a potential breakout to the upside, maybe even pushing toward a new all-time high (ATH) above $114,000.
In simple terms: expect a short-term dip, but keep an eye out for a strong bounce—this could just be a healthy pullback before the next big leg up.
for summary:
Short-term dip likely, targeting ~$99K
Strong support there—watch for a bounce
If it holds, BTC might push toward new highs

btc on sell#BTC on bullish retracment but price won't hold long, possible we await for decline around the rectangle before selling.
Between 107200-106900 sell, TP 104642, SL 108175.
Bullish range can be consider on multiple breakout at 108300.

BITCOIN LONG TRADE IDEAI'm looking forward to buying BTC in this price level if I see a good bullish price action which confirm my trade idea.
Market structure on 4HR is currently bullish.
Looking at the monthly and weekly time frame, BTC is extremely bullish and it's clear that BTC is not done with it's bullish run.
I expect to see BTC give another good run to the 120k-150k price level

Wedge pattern - Bullish Strategy (MSTR)My expectations for June for Microstrategy stock aka Strategy. Ofc, It all depends heavily on BITSTAMP:BTCUSD

DeGRAM | BTCUSD fixed above the $104,000 level📊 Technical Analysis
● Bulls twice defended the 103-105 k demand and purple trend-line, turning the zone into a springboard; price also reclaimed the inner grey trend-median, preserving higher-lows in the 7-week rising channel.
● A fresh ascending triangle is coiling under 111 k; pattern height projects to the red 112-115 k supply/channel roof once 111 k gives way, while invalidation rises with the trend-line at 103 k.
💡 Fundamental Analysis
● CoinShares reports a third straight week of spot-ETF inflows (+US$1 bn) and the BTC exchange reserve just printed a new 3-year low, signalling supply squeeze. Meanwhile, ISM manufacturing slipped back below 50, cooling U.S. yields and the DXY and reviving crypto appetite.
✨ Summary
Long 104-106 k; triangle break >111 k targets 112 k → 115 k. Bull view void on a 16 h close beneath 103 k.

Bitcoin Dominance, BTC ATH and ALT Seasons since 2017-some facts
There is little doubt now, that this Crypto cycle is very different from previous cycles and the main reason for this is the Bitcoin Dominance ( BTC.D) of the Market.
The reasons for this Dominance is complicated but we can certainly point towards the arrival of ETF's as one of the principle factors.
Corporations simply Buy Bitcoin, Hold it and Trade the ETF's - The Key Principle here being that the Coins are HELD Long term.
As we can see from the main chart, we have a key point in the BTC cycle called the Bitcoin Halving. To many extents, the explanation of this is not relevant right now.
But what you can see is how, previously, after the BTC Halving, we saw a drop in BTC.D,
This was due to the money Flow out of BTC and into ALT coins.
As more ALT coins were bought up, the demand drove the price higher and so their dominance increased, driving BTC.D down
This has not happened this cycle due to bulk buying of BTC for ETF's and BTC being Held Long term.
We can also see how , as we approached a certain time span After the Halving, we saw a sharp rise in BTC.D as we headed towards the next BTC ATH as the BTC buying picked up.
Again, this is not happening this cycle as the Bitcoins are being held long term.
What we can also see on the main chart is how we would normally be approaching a period of expected BTC ATH ( green vertical box )
And the HUGE question is, Will we get a Bitcoin ATH in this period ?
This is, to many extents, impossible to answer but as demand for Bitcoin continues and coins become harder to find, the price should continue to rise.
The tricky bit is, now, with a Bitcoin costing over 100K usd, it becomes harder to move the price. Only Corporations can afford to bulk buy.
So, again, things are different.. Retail is struggling to find a foot hold in the Bitcoin market, seeming to think that a Bitcoin is too expensive for them.....forgetting that they can buy a bit and that will also increase in price by the same %.
And so they look to the ALTs, fast volatile price rises and high returns,
This is seen very clearly in this chart that shows us when we had previous ALT seasons after the Halving
See how, after a period of time after Halving, the ALT Seasons appeared when the BTC.D dropped.
And that has simply just NOT happened this time.
It has to be said, it did try to appear. ALT season tried to happen.
See how after 210 days after halving this cycle, BTC.D did drop sharply but, it found a line of support and bounced back, Killing the ALT season dead in its tracks
There have been a lot of attempts since but the Market has been Bloody for ALTS, with sharp rise and Falls destroying confidence..... And Bitcoin continues to Rise.
So, where are we now ?
This Daily BTC.D chart may offer some ideas
BTC.D PA is currently at TOP of long Term range and finding it hard to get over that line of resistance.
BTC.D Weekly MACD , while not overbought, is curling over Bearish
BTC ATH's have previously been attained from Oversold areas as MACD Rose back higher.
The Volatility has gone and MACD is ranging smooth
SO, in conclusion, it is anybodies Guess right now if we will ever see an ALT season again.
Technically, on many fronts, we are poised, ready for it, even if it is a mini one.
But as we have seen on many occasions this cycle, Bitcoin is a very desired asset now and Demand drives price.....and so the Sell off that we need to drive an Alt season just may not occur.
One thing that is Absolutely certain though, we are highly likely to see another Bitcoin ATH
Stay safe everyone and Love one another. It is Free to do and is worth more than anything

BTCUSDT – Ready for the next downward move🚀 Trade Setup Details:
🕯 #BTC/USDT 🔽 Sell | Short 🔽
⌛️ TimeFrame: 15m
--------------------
🛡 Risk Management:
🛡 If Your Account Balance: $1000
🛡 If Your Loss-Limit: 1%
🛡 Then Your Signal Margin: $1369.86
--------------------
☄️ En1: 104838.38 (Amount: $136.99)
☄️ En2: 105096.3 (Amount: $479.45)
☄️ En3: 105280.29 (Amount: $616.44)
☄️ En4: 105464.61 (Amount: $136.99)
--------------------
☄️ If All Entries Are Activated, Then:
☄️ Average.En: 105190.14 ($1369.86)
--------------------
☑️ TP1: 104215.87 (+0.93%) (RR:1.27)
☑️ TP2: 103752.49 (+1.37%) (RR:1.88)
☑️ TP3: 103166.5 (+1.92%) (RR:2.63)
☑️ TP4: 102425.86 (+2.63%) (RR:3.6)
☑️ TP5: 101614.34 (+3.4%) (RR:4.66)
--------------------
❌ SL: 105957.69 (-0.73%) (-$10)
--------------------
💯 Maximum.Lev: 75X
⌛️ Trading Type: Swing Trading
‼️ Signal Risk: ⚠️ High-Risk! ⚠️
🔎 Technical Analysis Breakdown:
This technical analysis is based on Price Action, Elliott waves, SMC (Smart Money Concepts), and ICT (Inner Circle Trader) concepts. All entry points, Target Points, and Stop Losses are calculated using professional mathematical formulas. As a result, you can have an optimal trade setup based on great risk management.
⚠️ Disclaimer:
Trading involves significant risk, and past performance does not guarantee future results. This analysis is for informational purposes only and should not be considered financial advice. Always conduct your research and trade responsibly.
💡 Stay Updated:
Like this technical analysis? Follow me for more in-depth insights, technical setups, and market updates. Let's trade smarter together!

Liquidity was the excuse. Expansion was the goal.This BINANCE:BTCUSDT.P move was written before it happened — clean sweep, BPR fill, and now the setup is primed. You either knew where price was going, or you reacted late.
Price expanded aggressively into a clear 1H IFVG. That wasn’t just a push — it was a calculated run into a premium imbalance.
Now? We're retracing. Right into the EQ of the breaker block and the 0.5 fib (105,039). Exactly where the market wants you uncertain. I’m not.
Here’s the logic:
1H IFVG is filled. That’s done.
Price retraced directly into the 0.382 and 0.5 fib zone.
We have a defined BPR, and price is now hovering around its midpoint — ideal zone for reaccumulation.
As long as 104,999–105,039 holds, I expect a continuation back into 105,891 → 106,478.
If that range breaks clean, the low-hanging liquidity below 104,359 becomes a magnet.
But the narrative right now? HTF is still aligned bullish. We're in the phase where most traders get shaken out before the real move starts.
Trade idea: If I’m in, my invalidation is clean — under 104,699. Target is north of 106,000. I’ll scale partials at 105,799 and let the rest ride.
You want more trades like this? Check the account description. I don’t just post setups — I build conviction.
Let the influencers scream. I prefer precision.


LMACD running out of timeTime for the LMACD is ending soon. Once we reach 800 of the bull days BTC might be starting to change its trend. If we dont see irregular tops like in 2021 this might be the toping prices for this cycle. Let that sink in.

BTC Short & Trend ChangeA quick setup, i like the look of this, we've had a break of structure on the daily on 4hr in terms of the short term up trend (& 50 EMA) which is initial bias of trend change. After the break we have consolidation, a break and retest of the $105k area.
The Fib is showing a possibility the markets could draw slightly higher before falling which would make sense, especially around a level of such significance as there is likely to be manipulation and market movers here.
Short term trend change to the downside is my bias and i'll look for entry only if the markets can fake a break out up to the 61.8% ($106,750) to be exact. Good RR possibilities with good targets around 1:6.5
Target levels around $100,800 and then again around $98,500. Again, no entry unless i see confirmation from Fib levels.

BTC Analysis, Next Possible move!Btc is still bullish unless it breaks it structure (masked level) upon which I will swing short it. So far Monthly and Weekly still needs to close above previous local top otherwise this can turn into a top for BTC here. Will trade upon confirmation.

BTC 4H Setup – OB Rejection or Launchpad? Bitcoin is currently ranging below a 4H Order Block (OB) and forming a potential higher low. With price holding above the key 0.618 fib zone (104.1k), this could act as a springboard for continuation — or a trap.
Key Levels:
Support: 104.1k–103.6k (fib cluster & mid-volume node)
Immediate Resistance: 105.1k (OB 4H)
Breakout Target: 107.1k
Fail-safe: 103.0k
Scenarios:
🟩 Bullish Path:
Hold 104k zone
Reclaim 105.1k OB = confirmation
Push toward 107.1k & higher liquidity sweep
🟥 Bearish Path:
Rejection from OB + break below 104k
Eyes on 103.0k as next bounce zone
Plan:
Long scalp above 104.2k if volume sustains
TP1: 105.1k (retest OB)
TP2: 107.1k
SL: Below 103.6k (tight invalidation)
📌 “OB rejection or flip? Market’s next impulse hinges on this 104k–105k squeeze.”

FVG re-entry or fail – this level decides the tone.Bitcoin tapped the 0.618 fib at ~$104,100 and front-ran the 1H demand zone. Now it's hovering at a decision point just beneath the 1H Fair Value Gap.
What to watch:
→ Price is pressing into FVG (104.4k–104.7k), aiming for acceptance.
→ Value area high sits at 104,275 – acting as pivot.
→ Break + hold above 104.7k? Clean path to 105.8k.
Plan:
Entry: 104.1k–104.3k
SL: below 103.6k
TP1: 104.9k
TP2: 105.8k (liquidity sweep)
Invalidation: Rejection from 104.7k = probable retest of 103k
Narrative flip potential:
Buyers are defending the mid-range + FVG. Breakout would shift market structure bullish on the lower timeframes.
"Acceptance above the gap = momentum reclaim."

btc on sell#BTCUSD price is now on retracment, next possible zone is below 102900 which can reform again for buy.
Below 103800 will sell, Target 102900, Stop loss 104500.
The bullish range is below 102900-104750 with longer candle closing above there.

BTC/USDT – Retest in Play After Breakdown!Bitcoin broke below its 4H ascending trendline and is now showing signs of a retest at the broken trendline zone.
It tried to break the immediate resistance of $105,100 but couldn't sustain it.
📉 Breakdown confirmed
Key Levels:
Resistance: $105,968 | $108,941
Support: $101,539 | $97,205
Bearish Target remains near $97K if rejection holds
Watch how the price reacts here — rejection could lead to further downside. A break back above $105K may invalidate the move.
#Bitcoin #BTCUSDT #CryptoTrading #TechnicalAnalysis #TrendlineBreak #Retest #BearishSetup #PriceAction

BTCUSD Breakdown Incoming? 4H Chart Flags Key Bearish Entry🔵 Entry Point (Sell Limit / Market Entry)
• Around $104,600 – $104,700
This area aligns with the retest of the descending trend line and a weak resistance zone. Price is reacting negatively after hitting this level.
🟥 Stop Loss
• $107,060
Placed just above the weak resistance. This protects the trade in case price breaks structure and invalidates the bearish setup.
🟩 Take Profit Targets
1. TP1: $101,818 (Support 1)
o First major support zone; price has bounced here previously.
2. TP2: $98,020 (Support 2)
o Deeper support and more aggressive target. Aligned with previous wick lows.
🔺 Chart Observations
• Trend Line: Still intact and respected. Price rejected it on the latest retest.
• Structure: Lower highs and lower lows show bearish momentum.
• Volume/Volatility: Tapering candles around resistance indicate weakening bullish attempts.
• Risk-to-Reward
o TP1 R:R ≈ 1.3:1
o TP2 R:R ≈ 2.5:1+
⚠️ Scalper Note
If you’re trading this as a scalp, consider securing partial profits at TP1 and moving SL to breakeven to protect gains. Volatility around macro events or news (like the red event icons near June 3–5) could trigger wicks.
Would you like me to add RSI, MACD, or EMA confluence to strengthen the setup further?

BTC didn’t dump — it tapped.BTC reached into the 1H FVG and wicked just above the OB at 104,204 — delivering premium liquidity and then reversing.
Most are staring at red candles, but the real story is the reaction zone:
Price tagged the 0.618 level (104,559) with precision and reversed with displacement.
Now what?
We're mid-delivery. If BTC can reclaim 104,800–105,000 (mid OB/FVG confluence), a strong move into 105,865 is likely — potentially sweeping for external liquidity near 106k.
Execution Plan:
Entry: 104,600–104,700 range
SL: 104,200 or beneath 103,752 swing
TP1: 105,365
TP2: 106,000+
Key invalidation: clean break below 104,200 with volume
Bias: Bullish while above 104,200
Why: Fair Value Gap fill + OB + 0.618 convergence + responsive wick
This wasn’t a sell-off.
This was a setup.

Most called rejection. I called reaccumulation — mid-trade.This wasn’t luck. It was structure.
BTC tapped directly into the 1H Fair Value Gap at 105,016 — precisely the overlap with 0.382 fib and the volume imbalance from the prior impulse. Price didn’t just react. It delivered confirmation. Fast.
Entry was clean, risk tight — and the invalidation was defined. Below 104,517, I’m out. No emotion. Just system.
I’m now watching the 105,325–105,825 pocket. That’s where the thin volume zone transitions back into resistance — and where trapped shorts begin to feel the heat.
If price breaks and holds above 105,900, expect a swift drive into 106.7–107.0 before further consolidation.
Execution clarity:
✅ Entry: FVG 1H — 105,016
🎯 TP1: 105,825
🔒 Stop: 104,517
🔓 R:R = 2.38, no drawdown, full intent
Most wait for confirmation.
I act at the point of imbalance — not after it’s obvious.

BTC Faces Critical Resistance—Breakout or Further Decline?FenzoFx—Bitcoin continues its bearish trend after hitting its 2025 all-time high at 113,165. BTC/USD is currently trading near $105,400, a high-volume area where price could either bounce or break lower.
The key resistance level rests at $103,170, supported by a bullish Fair Value Gap. If price holds above this zone, Bitcoin could rise toward $107,090.
However, a close below $103,170 would invalidate the bullish outlook, with the next bearish target at $99,435.

BTC Trendline Breakdown? Bearish Setup Brewing!📉 #Bitcoin has recently broken its key trendline after making a new All-Time High (ATH). This could be the first major sign of a trend reversal. Here’s what we’re seeing:
🔹 Trendline Broken: The uptrend has been broken — a significant technical signal.
🔹 Retesting the Break: Price is currently retesting the broken trendline, a classic move before continuation.
🔹 Triple Touch Confirmation: The trendline was respected with 3 clear touches during the uptrend — increasing the validity of this break.
🔹 Support Still Holding: We’re watching a major support level below — a break here would confirm bearish momentum.
🚨 Strategy Plan:
If the support level breaks and #BTC retests it as resistance, we’re planning a short position with strict risk management. Patience is key — wait for confirmation before entering!
🛡️ Risk Management First. Always.
Don't rush into a trade — wait for a clean breakdown and retest for a high-probability entry.
📊 What do you think? Is #BTC ready to reverse, or will the bulls defend the trend?
👇 Drop your thoughts in the comments.
❤️ Like this idea if it helped you.
✅ Follow for more #BTC setups and real-time updates!
#BTCUSD #Bitcoin #CryptoTrading #TrendlineBreak #ShortSetup #TechnicalAnalysis #BearishReversal #PriceAction #TradingStrategy

BTC SHORT TP:104,100 01-06-2025🚨 SHORT
Entry zone: 105,600 – 105,800
Target zone: 104,000 – 104,300
RR: 4.4
Timeframe: 1H – 2H
Estimated duration: 20 to 24 hours
We’re in a Sunday distribution + manipulation zone. There might still be a small final push to the upside, but the setup shows signs of exhaustion. Use a tight stop or adapt it to your risk profile.
If the move doesn’t happen within the estimated time, this setup is invalid.
We don’t use indicators, we’re not out here drawing lines or cute little shapes — I just give you a clean trade.
#BTC #Short #PriceAction