Accumulate BTC over 115K💎 BTC PLAN UPDATE (July 23rd)
NOTABLE NEWS ABOUT BTC
Bitcoin (BTC) and Ripple (XRP) are approaching their all-time highs, while Ethereum (ETH) continues to grow steadily toward the important $4,000 mark. These top three cryptocurrencies by market capitalization are showing signs of a new bullish momentum, supported by strong technical structures and increasing investor interest.
TECHNICAL ANALYSIS PERSPECTIVE
1. Main Trend
The overall trend remains bullish, with a clearly rising price channel (black diagonal line).
However, BTC is currently in a short-term correction phase, consolidating sideways after the recent strong surge.
2. Key Price Levels
🔵 Strong Support Zone: 116,000 – 117,000 USDT
This zone includes the 200-day moving average (MA200), horizontal support, and a previous bottom — making it a decisive area for the short-term trend.
If this zone breaks, BTC could fall to a deeper support area around 111,000 USDT.
🔴 Resistance Zone: 122,000 – 123,000 USDT
This is a previous peak and a recently “false breakout” area — a strong psychological resistance.
If broken convincingly, BTC could surge to the 130,000 USDT zone (Fibonacci extension 1.618).
3. Possible Scenarios
✅ Bullish Scenario:
Price retests the 116,000 – 117,000 support zone and then bounces.
If it breaks through the 122K resistance, the next target is 130,000 USDT.
❌ Bearish Scenario:
If price breaks below MA200 and the 116K support zone → it could drop to the deeper zone around 111,000 USDT.
4. Technical Signals
There is a triangle accumulation pattern (with flat tops and bottoms).
The “false breakout” at the resistance zone shows that buyers are not yet strong enough and a retest of support is needed.
Follow the channel for the latest and continuous updates on XAUUSD, CURRENCIES, and BTC.
Btcusdanalysis

BTC/USD) Bullish trend analysis Read The captionSMC Trading point update
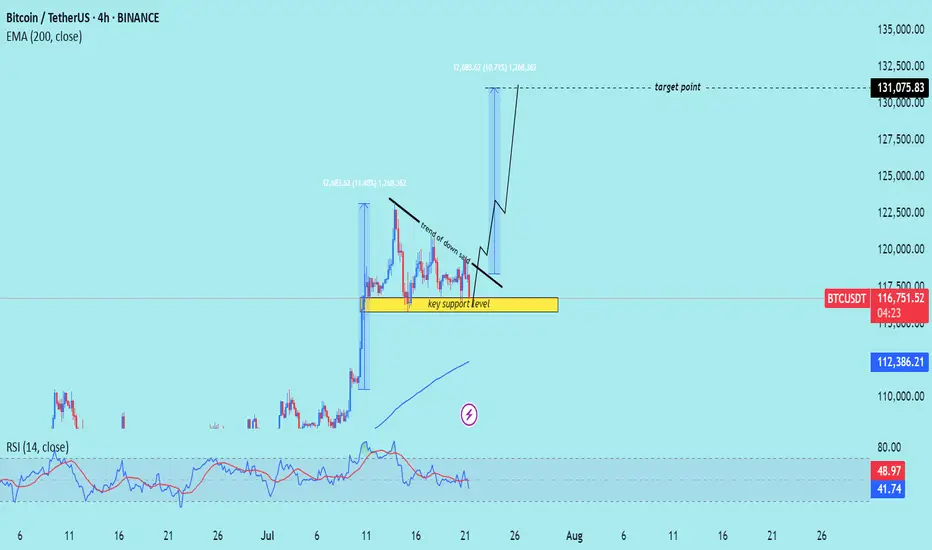
Technical analysis of Bitcoin (BTC/USDT) on the 4-hour timeframe, indicating a potential upward continuation after a period of consolidation above a key support level.
---
Analysis Summary
Pair: BTC/USDT
Timeframe: 4H
Current Price: 116,810.90
Bias: Bullish breakout continuation
---
Key Technical Insights
1. Key Support Zone:
The yellow box marks a strong support level, where price has bounced multiple times.
Acts as a launchpad for the next move higher.
2. Descending Trendline:
A trend of lower highs suggests short-term selling pressure.
Break above this trendline would signal a bullish breakout.
3. Projected Move:
If the breakout occurs, the projected target is around 131,075.83, representing a ~12% gain.
Similar move structure as the previous breakout earlier this month.
4. EMA 200 (Supportive):
Price remains above the 200 EMA at 112,386.80, affirming bullish trend bias.
5. RSI (14):
RSI hovering around 42–49, slightly oversold area, suggesting upside potential remains.
---
Target Point
Target: 131,075.83 USDT
Stop-Loss Suggestion: Below key support zone (~114,000)
---
Trade Idea
Direction Entry Stop-Loss Target
Buy Break above 118,000 Below 114,000 131,000–132,000
Mr SMC Trading point
---
Summary
Bitcoin is consolidating above a strong support zone and under a descending trendline. A confirmed breakout from this pattern could lead to a bullish rally toward 131,000+.
-
Please support boost 🚀 this analysis)
$RAYUSDT Breakout: 146% PotentialNASDAQ:RAY just broke out of a major downtrend and flipped key resistance into support around $3.208 –$3.352.
If it holds, a move toward $8+ is on the cards, nearly
146% upside.
Momentum appears strong; watch for a clean retest and potential continuation.
DYOR, NFA

$CUSDT Breakout Targeting $0.47BITGET:CUSDT just broke out of and is now retesting the $0.34–$0.35 resistance zone.
If this level holds, we could see a strong move toward $0.47, nearly a 47% upside.
Momentum looks solid, but confirmation will come with a clean bounce.
DYOR, NFA

A quick update on BYCThe correction turned a littl complex but I still seing the same structure
Levels in the chart
GG
Bitcoin - The cycle is just starting!⚔️Bitcoin ( CRYPTO:BTCUSD ) just created new highs:
🔎Analysis summary:
Bitcoin is currently - especially with the new all time high breakout - just perfectly following previous cycle behavior. Since there is no real resistance above current price, apart from psychological levels, I do expect a substantial rally back to the upper channel resistance trendline.
📝Levels to watch:
$300.000
🙏🏻#LONGTERMVISION
Philip - Swing Trader

"BTC/USD Breakout Strategy: Identifying Bullish Momentum BTC/USD Technical Analysis – July 22, 2025
📈 Market Structure Overview:
The chart illustrates a recent Break of Structure (BOS) both to the upside and downside, indicating volatility and a shift in market sentiment. The price action formed a descending channel, followed by a breakout with strong bullish candles, suggesting a momentum reversal.
🧱 Support Zone (Demand Area):
Key Level: $116,400 – $116,900
This zone has acted as a strong demand level, with clear evidence of buying pressure pushing BTC higher after testing this area. The volume profile (VRVP) supports this, showing heightened trading activity at this price.
🔄 Bullish Breakout Confirmation:
A bullish breakout from the descending channel occurred just above the support zone, aligning with the label "Bullish Momentum".
The breakout candle has closed above minor resistance, which increases the probability of a trend reversal.
📍 Price Target:
The projection points toward $120,000, aligning with previous resistance and psychological round-number resistance.
This target is highlighted by an expected bullish leg after a possible retest of the breakout zone around $117,500 – $117,800.
🧭 Key Levels to Watch:
Support: $116,400 – $116,900
Retest Zone (Buy Opportunity): $117,500 – $117,800
Immediate Resistance: $118,400
Major Resistance / Target: $120,000
📊 Summary:
BTC/USD has shown a bullish reversal signal from a well-respected support zone after a descending correction phase. The current price structure, volume buildup, and breakout momentum suggest a high probability of continued upside movement toward the $120,000 mark. A successful retest of the breakout zone would provide a strategic entry for long positions with tight risk management.

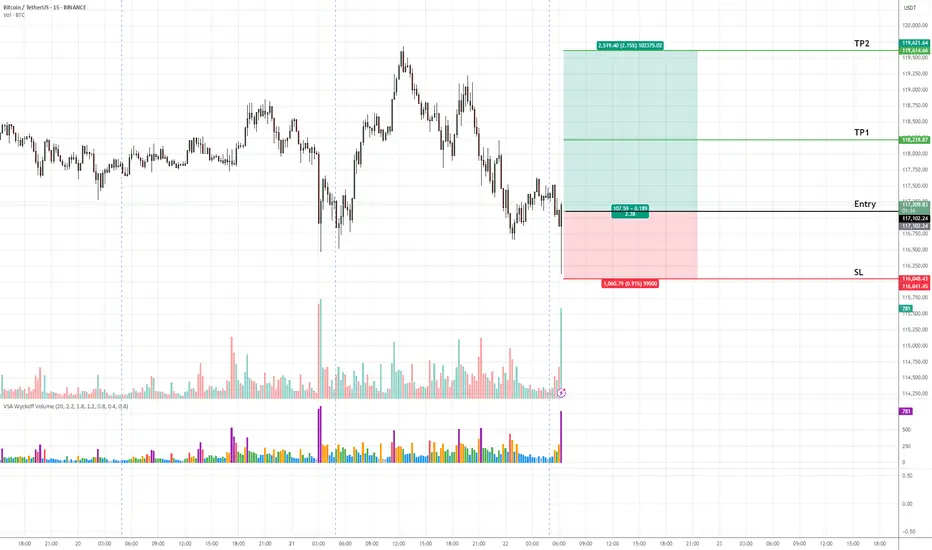
BTCUSD (Bitcoin) Buy Setup – VSA & Market Structure Analysis✅ Entry: As marked on chart
🎯 Take Profit 1 (TP1): Highlighted zone on chart
🎯 Take Profit 2 (TP2): Highlighted zone on chart
🛑 Stop Loss (SL): Defined below recent demand zone
📊 Technical Insight (VSA & Market Structure):
The recent decline into the support zone occurred on diminishing volume, indicating a lack of selling pressure.
A climactic volume spike (stopping volume) followed by a wide spread bullish candle suggests strong professional buying activity.
Subsequent bars show narrow range candles with low volume, characteristic of an absorption phase, hinting at smart money accumulation.
Price is now attempting to break above the previous minor resistance, which would confirm demand overcoming supply.
The broader market structure aligns with this setup: Bitcoin is in a higher timeframe accumulation range, and this move could initiate a markup phase as per Wyckoff/VSA principles.
📍 As long as price holds above the stop loss zone, we expect a bullish leg towards TP1 and TP2, in line with the emerging demand dominance.
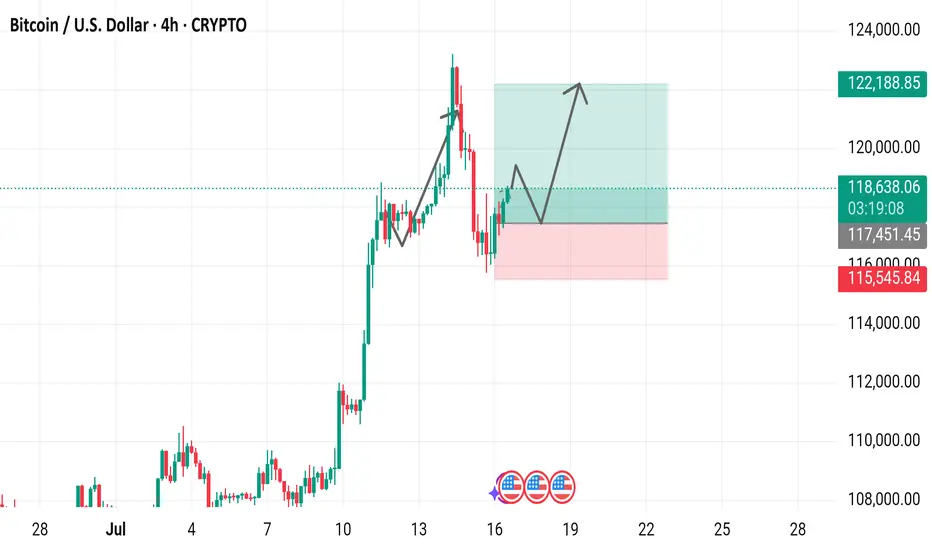
Bitcoin / U.S. Dollar 4-Hour Chart (July 2025)4-hour price movement of Bitcoin (BTC) against the U.S. Dollar (USD). The price has risen from 118,714.64 to 118,714.64 (+937.9 or +0.80%) over the period. Key levels include a support zone around 115,451.45 to 117,451.45 and a resistance zone near 120,000.00 to 122,188.85,
Bitcoin at the Threshold of the Fibonacci Gate - Silent Strain.⊢
⟁ BTC/USD - BINANCE - (CHART: 1W) - (July 22, 2025).
◇ Analysis Price: $119.209,03.
⊣
⨀ I. Temporal Axis - Strategic Interval - (1W):
▦ EMA9 - ($111.083,72):
∴ Price remains well above the EMA9, with consistent bullish spacing;
∴ The weekly candle closes with strength and full-body integrity above it;
∴ EMA9 slope continues upward, supporting ongoing momentum.
✴️ Conclusion: Short-term structure remains decisively bullish, with trend-following support intact.
⊣
▦ EMA21 - ($103.417,42):
∴ EMA21 is sharply rising and holds significant historical support;
∴ Price remains distanced, but no vertical stretch detected;
∴ Not touched since early 2024 - the bullish cycle is intact.
✴️ Conclusion: Mid-cycle momentum remains strong. No structural weakness under current trajectory.
⊣
▦ WMA200 - ($62.496,26):
∴ Remains deep below current price action - untouched since breakout phase in 2023;
∴ Its angle is now slowly tilting upward - reflecting macro regime change;
∴ Long-term holders remain in command; no gravitational pull is active.
✴️ Conclusion: WMA200 is no longer relevant for tactical reaction, but serves as a structural floor of the cycle.
⊣
▦ Fibonacci Retracement - (Top: $122.056,95 / Bottom: $27.143,79):
✴️ Top: $122.056,95 - (07/14/2025) = 1 Fibo;
✴️ Bottom: $27.143,79 - (10/16/2023) = 0 Fibo.
∴ Price is now within 2.33% of the Fibonacci 1.0 extremity;
∴ Entire move from $27k to $122k retraced cleanly with structural respect to 0.382 ($63.400;62) and 0.618 ($85.800,12);
∴ Current pressure nears full extension, requiring caution;
✴️ Conclusion: Full retracement achieved. Continuation must now be fueled by external influx or will face rejection at golden gate.
⊣
▦ RSI (21) + EMA9 - (RSI: 66.65 / EMA9: 63.73):
∴ RSI remains below 70 - showing momentum without exuberance;
∴ RSI crossed above EMA9 with positive slope;
∴ No divergence present; momentum confirmation continues.
✴️ Conclusion: Silent bullish continuity. No signal of exhaustion.
🜏 ORACVLO ARCANE: (RSI = 66 - No Fibonacci/Guematria convergence).
⊣
▦ MACD (9,21) - (MACD: 7,666.30 / Signal: 5,976.56 / Histogram: +1,689.74):
∴ MACD lines widening - strong expansion phase;
∴ Histogram rising above prior week;
∴ Still in mid-cycle range - not overextended.
✴️ Conclusion: Momentum engine active. No current loss of acceleration.
🜏 ORACVLO ARCANE: (Histogram = 1,689.74 - No convergence).
⊣
▦ OBV + EMA9 - (OBV: 86.27K):
∴ OBV rising cleanly with price;
∴ No divergence detected on weekly timeframe;
∴ EMA9 supportive, confirming accumulation bias.
✴️ Conclusion: Volume structure confirms legitimacy of bullish move.
⊣
▦ Stochastic RSI - (3,3,21,9) - (K: 94.30 / D: 84.53):
∴ Both lines in extreme overbought zone;
∴ No bearish cross yet - but a turn may initiate in next 1-2 candles;
∴ Historical turning points often occur from this elevation.
✴️ Conclusion: Momentum peaking. Vigilance required for reversal trigger in next cycle.
⊣
🜎 Strategic Insight – Technical Oracle:
∴ Price is pressing against the final Fibonacci gate of $122K, with momentum indicators still aligned;
∴ However, overbought pressure is building, particularly on the Stoch RSI.
∴ Breakout will require force; otherwise, a pullback from the threshold is probable.
⊣
∫ II. On-Chain Intelligence – (Source: CryptoQuant):
▦ Exchange Netflow Total - (All Exchanges) - (+920 BTC):
∴ Influx into exchanges suggests potential distribution is being prepared.
⊣
▦ Funding Rates - (All Exchanges) - (+0.008):
∴ Mildly positive; no leverage overheating detected.
⊣
▦ Taker Buy Sell Ratio - (All Exchanges) - (0.959):
∴ Slight taker sell dominance - friction at high prices.
⊣
▦ Spent Output Profit Ratio - (SOPR) - (1.017):
∴ Profitable exits ongoing. Healthy, but could tilt if profit-taking accelerates.
⊣
▦ Realized Cap + (EMA9) - (Rising):
∴ Network is revaluing BTC upward - structurally healthy.
⊣
▦ MVRV Z-Score + (EMA9) - (2.32):
∴ Elevated. Historically a zone where caution is warranted.
⊣
▦ Miner Reserve - (All Miners) - (1.809M BTC declining):
∴ Long-term miner outflows continue - no sudden spike detected.
⊣
🜎 Strategic Insight - On-Chain Oracle:
∴ On-chain data supports the current trend, but with visible friction. Exchange inflow and profit-taking are warning signs that price is now dependent on sustained demand;
∴ This is a zone of silent strain: structurally sound, but tactically stretched. While the broader framework supports continuation, there is no buffer left for error;
∴ Weakness will be exploited if new inflows fail to materialize.
⊣
𓂀 Stoic-Structural Interpretation:
∴ Structurally Bullish - Tactically Suspended;
∴ Tactical Range Caution: ($114.000 / $122.056).
⊣
▦ Codicillus Silentii - Strategic Note:
∴ The CME gap and the proximity to Fibonacci 1.0 have formed a psychological and technical ceiling;
∴ If unbroken this week, the next cycle may revert to (0.786) as reversion.
⊣
▦ Momentum-wise:
∴ RSI remains in the bullish zone (66.65) without entering overbought - a sign of discipline in the ascent;
∴ MACD shows expansion with a growing histogram - no curvature loss;
∴ Stochastic RSI is in extreme overbought (K = 94.30), signaling elevated tension.
✴️ Conclusion: Momentum is intact but strained. A breakout is possible, but failure to continue will invite a flush.
⊢
✴️ Final Codex Interpretation:
∴ Bitcoin stands at the edge of the Fibonacci Gate, within breath of the 1.0 threshold ($122,056); ∴ While structure, momentum, and on-chain flows permit a push higher, the presence of inflows to exchanges, elevated MVRV, and extreme oscillator positioning suggest that the threshold is sacred - and only silence or strength may break it;
∴ Rejection here would not be collapse, but strategic regression to gather force beneath the gate.
⊢
⧉
· Cryptorvm Dominvs · MAGISTER ARCANVM · Vox Primordialis ·
⚜️ ⌬ - Silence precedes the next force. Structure is sacred - ⌬ ⚜️
⧉
⊢

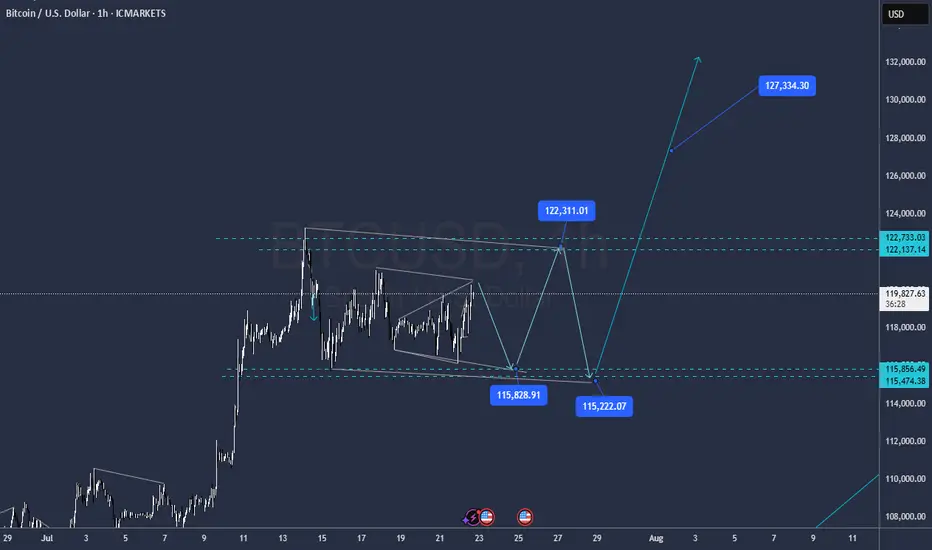
$BTC Breakout Coming?CRYPTOCAP:BTC is coiling up inside a symmetrical triangle on the 2H chart.
A breakout looks close if it clears resistance; we could see a 7.5% move toward the $127K–$128K zone.
Watch for volume confirmation.
DYOR, NFA

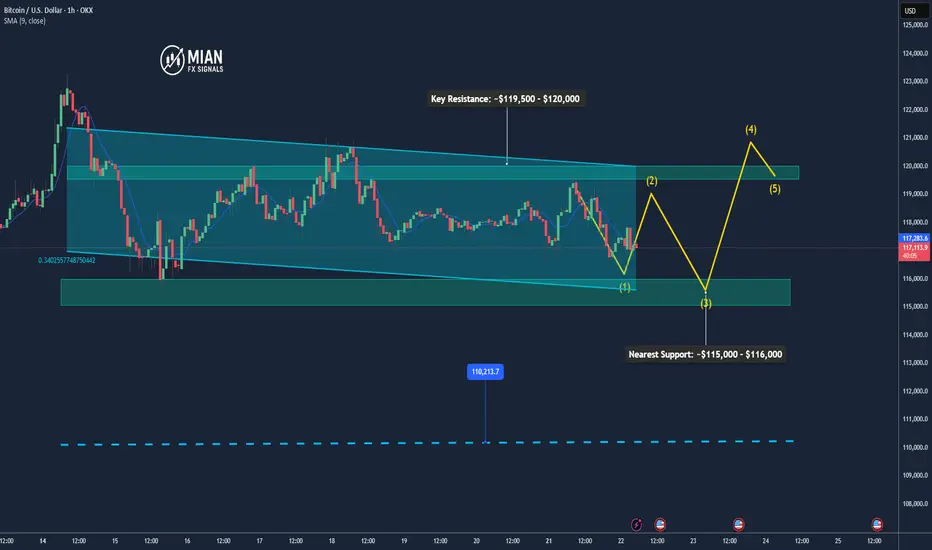
Bitcoin May Pull Back Slightly Before Resuming Uptrend📊 Market Overview
• Bitcoin is currently trading around $116,934, slightly down after hitting an intraday high of $119,524.
• The earlier rally was supported by inflows into Bitcoin ETFs, accumulation by major holders like Trump Media and MicroStrategy, and a pro-crypto regulatory stance in the U.S. (e.g., Genius Act, CLARITY Act).
• However, a surge in whale transfers to exchanges and declining BTC dominance suggests profit-taking and potential short-term volatility.
📉 Technical Analysis
• Key Resistance: ~$119,500 – $120,000 (intraday high and recent ATH)
• Nearest Support: ~$115,000 – $116,000, then $110,000
• EMA 09/20: Price is hovering around EMA 9/20 on H1–H4 timeframes, indicating a short-term uptrend but needing a pause or correction.
• Momentum / Volume: RSI is near overbought territory; falling volume hints at consolidation or a mild pullback. The overall trend remains bullish but slightly unstable.
📌 Opinion
Bitcoin is likely to pull back slightly in the short term toward the $115,000 – $116,000 zone due to profit-taking pressure, before potentially resuming the uptrend if it can break and hold above $119,500 – $120,000 with strong volume.
💡 Trade Setup
SELL BTC/USD at: $118,500 – $119,000
🎯 TP: $116,500
❌ SL: $120,000
BUY BTC/USD at: $115,000 – $116,000
🎯 TP: $118,500 – $119,500
❌ SL: $114,000
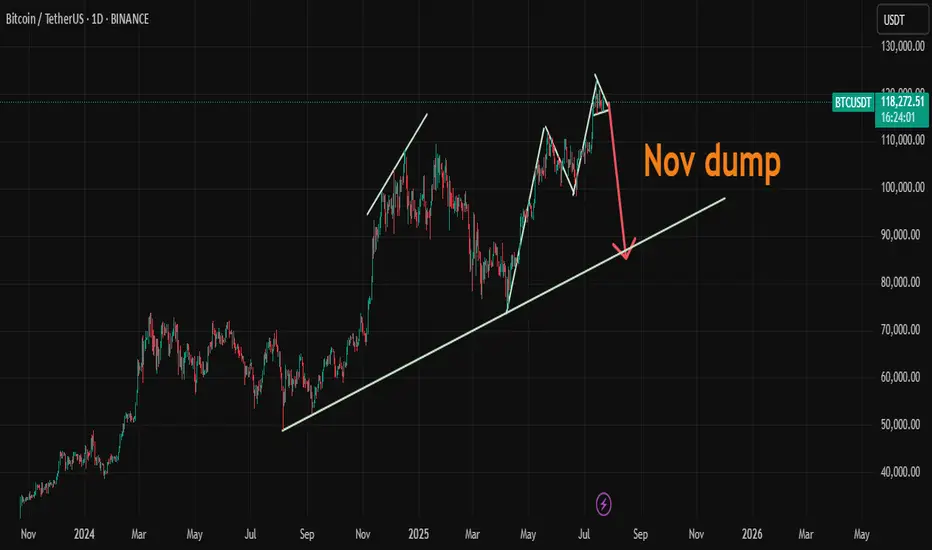
BTC/USDTHello friends, I hope you are well. We should probably expect a slight increase in Bitcoin after the big drop in the financial market, which will most likely start in November. What is your opinion?
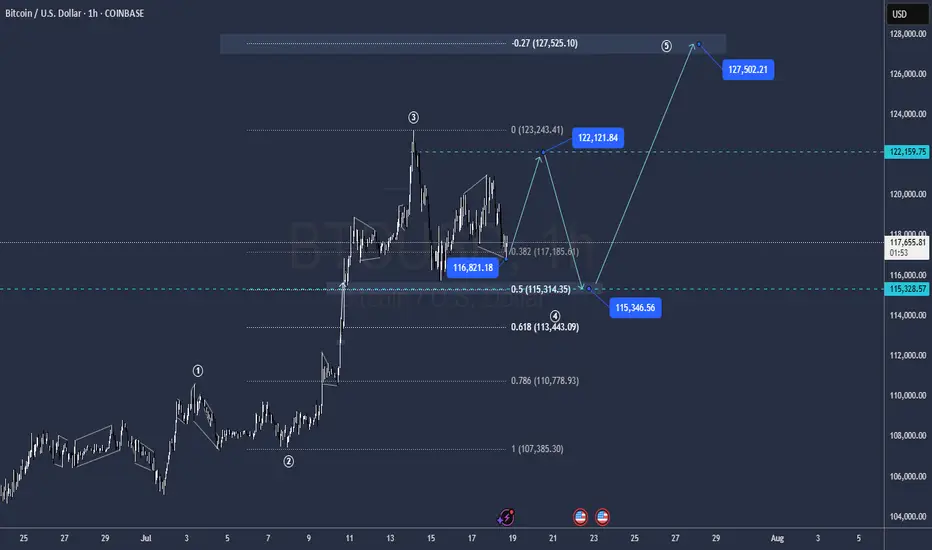
Bitcoin Weekend ForecastIts in the middel of wave 4 correction, impulses are tradeable
Levels Highlighted in the chart
BTCUSD BULLYING Bitcoin is still respecting price and is buying can expect some nice moves (New Highs)
BITCOIN FINAL WARNING BEFORE HUGE MOVE!!! (urgent) Yello Paradisers! I am Sharing with you my idea about #Bitcoin of what's going on with Bitcoin right now: be very careful because the Fear and Greed Index, a special one, is at "Greed". We are seeing funding rates, the accumulated funding rates, as extremely positive. We are seeing bearish patterns forming.
In this video, I'm describing the confirmations we are waiting for that will confirm that Bitcoin is about to make a huge movement. Make sure that you are trading with professional trading strategies and that you are waiting for confirmations before any trade execution. Also, make sure that you have tight risk management because only the best, most professional traders will win long-term in this game.
Don't be a gambler. Don't try to get rich quick. Make sure that your trading is professionally based on proper strategies and trade tactics.

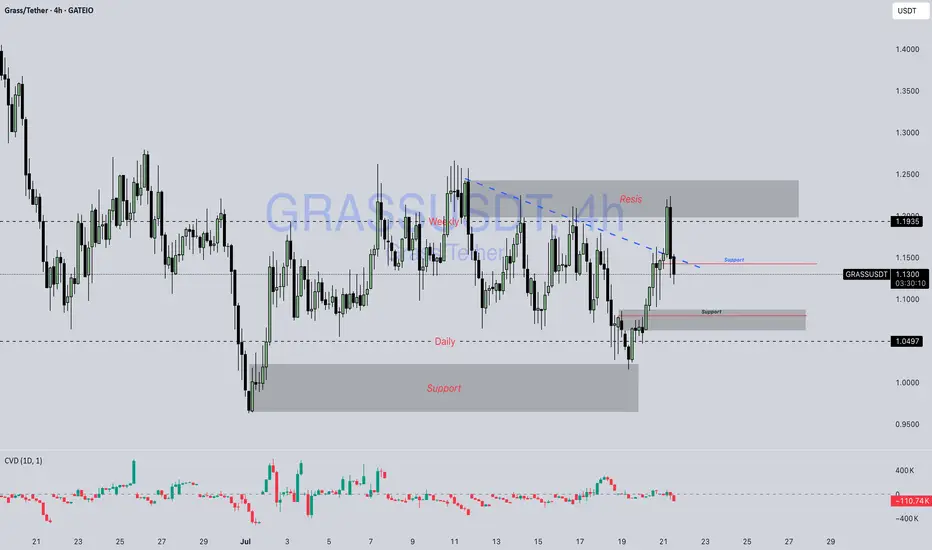
Grass / Usdt GATEIO:GRASSUSDT
📊 **Chart Overview – GRASSUSDT (4H):**
* 💰 **Current Price:** \$1.1362
* 🔻 **Previous Trend:** Downtrend has been challenged; price broke above the **descending trendline (blue dashed)**.
* 🟦 **Key Support Zones:**
* \$1.10 (recent demand area retest)
* \$1.05 (major support below, seen from earlier bounce zone)
* 🟥 **Key Resistance Zone:**
* \$1.19 – \$1.25 (major supply area where price got rejected again)
---
### 🔍 **Technical Breakdown:**
1. **Break and Retest Attempt:**
* Price **broke the descending trendline** and tapped into the \$1.19 resistance.
* Currently pulling back — possibly a **retest of the broken trendline** and the previous support near \$1.10–\$1.13.
2. **Supply Zone Rejection:**
* Strong rejection from **\$1.19–\$1.25**, which aligns with the upper supply zone.
* Sellers are actively defending this area.
3. **Bullish Case:**
* If GRASS holds above **\$1.10**, it may gear up for another push toward **\$1.19–\$1.25**.
* A clean break and hold above \$1.1935 could open room toward \$1.30+.
4. **Bearish Case:**
* Failure to hold \$1.10 or a breakdown below \$1.05 could invalidate bullish bias and revisit the lower demand zone near **\$0.95–\$1.00**.
---
📌 **Market Summary:**
GRASS is at a **critical zone**, attempting to flip trendline resistance into support. The reaction from \$1.10–\$1.13 will be key to deciding whether it can revisit higher supply levels or turn back toward major support.
---
⚠️ **Disclaimer:**
*This is **not financial advice**. All information provided is for **educational and informational purposes only**. Always perform your own analysis and manage your risk properly before trading.*
---
BTC-----Sell around 118300, target 116000 areaTechnical analysis of BTC contract on July 21:
Today, the large-cycle daily level closed with a small negative line yesterday, the K-line pattern continued to fall, the price was below the moving average, and the fast and slow lines of the attached indicator showed signs of a dead cross, and the overall trend has been in a sluggish state recently. The trend in the big trend also showed obvious signs of falling, so we have to pay attention to the strength and continuation of the retracement next; the short-cycle hourly chart price fell under pressure in the early morning, and the current K-line pattern continued to fall, the price was below the moving average, and the attached indicator was dead cross, so the price fell to the previous low of 115700 area. So you can sell after the pullback during the day, and pay attention to the breakout and strength and weakness trend of the European session.
Today's BTC short-term contract trading strategy:
Sell in the 118300 area, stop loss in the 118600 area, and target the 116000 area;

$CUSDT Breakout: Eyes on 94% Upside.BITGET:CUSDT is showing signs of strength again.
After a healthy pullback, it held support and broke out of the falling wedge.
This move could kickstart the next leg up, with a potential target near $0.53882, almost 94% from here.
Keep it on your radar if momentum picks up.
DYOR, NFA

BTC/USDT LONG SET UP (BITCOIN)Entry Price 1: $118,000
Entry Price 2: $116,500
Stop Loss: $115,000
Take Profit 1: $121,000 (Close 25%)
Take Profit 2: $124,000 (Close 50%)
Take Profit 3: $127,000 (Close 75%)
Take Profit 4: $130,000 (Close 100%)

Urgent Bitcoin Prediction: Longs Beware!!! Bitcoin longs should be careful, as we are below an important resistance and the market looks bearish. Wait for the confirmations I’ve shown in the video before making any moves! Trade professionally with a proper strategy and well-defined entry tactics!

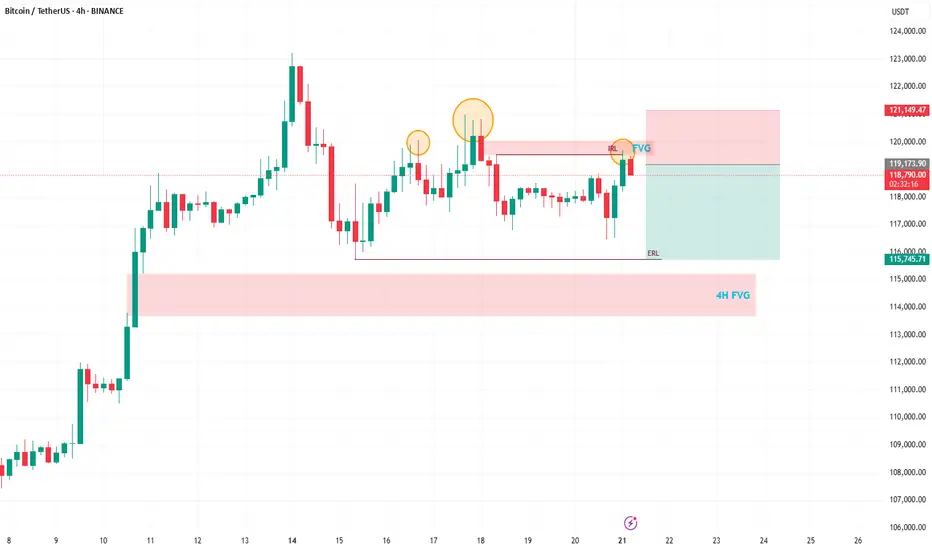
Bitcoin Trading Update: Consolidation, Patterns, and What's NextHey Fellow Traders! 👋
Bitcoin (BTC) has been on a wild ride after hitting its all-time high (ATH)! 📈 Since then, it’s been consolidating, generating liquidity, and setting the stage for the next big move. Meanwhile, altcoins are absolutely booming, stealing the spotlight! 💥 As we kick off the week, let’s dive into what’s happening with BTC and what to watch for.
📊 Technical Analysis Breakdown
Here’s what I’m seeing on the charts:
Head and Shoulders Pattern: A clear head and shoulders has formed on BTC, signaling a potential bearish move. 🐻
Daily Timeframe Order Blocks: These are in play, showing key levels of support and resistance.
Filled Fair Value Gap (FVG): A recent FVG on the daily chart has been filled, but there’s still a beautiful 4H FVG waiting to be tested below.
Liquidity Sweep: After the ATH, BTC needs to clear the liquidity from the past few days before it can push for new highs.
🔍 What’s Next for BTC?
I’m expecting a bearish reaction in the near term, with BTC targeting the sell-side liquidity around $115,800. This move should also fill the 4H FVG, setting the stage for a potential bounce and another shot at the ATH. 🚪 Keep an eye on these levels, as they’ll be critical for the next big move!
🔔 Stay in the Loop!
Let’s keep the conversation going! 💬 Follow for more updates, like if you found this helpful, and drop a comment with your thoughts or what you’re seeing in the markets. Are you trading BTC or riding the altcoin wave? Let’s hear it! 👇
Happy trading, and let’s make this week count! 💪
#Crypto #Bitcoin #Trading #TechnicalAnalysis
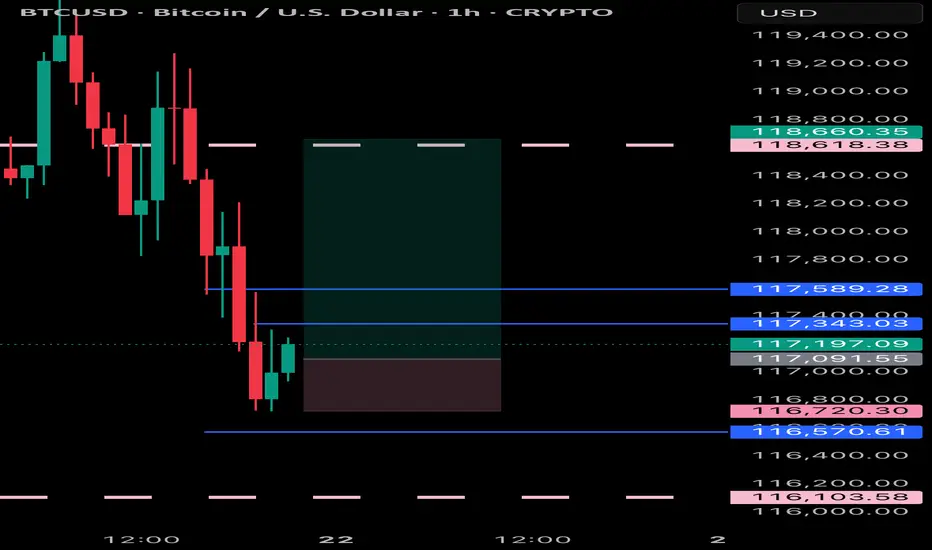
BTC 4H Structure Break – Long Bias with Conditions🚀 BTC (Bitcoin) has clearly broken bullish market structure on the 4-hour timeframe.
📈 My bias is to ride the momentum and look for a pullback to enter long.
✅ I follow a specific entry criteria — price must pull back into the imbalance, find support, and then form a bullish break of structure on a 15m chart to trigger an entry.
❌ If that setup doesn't play out, we simply abandon the idea.
⚠️ This is not financial advice.
