BTC weekly Weekly log chart on BTC looks ready for price discovery following bullish consolidation. If this setup plays out like the prior major breakouts, we're gonna see some new ATHs soon.
Btcusdanalysis

$BTC to $120K?Bitcoin is still moving strongly inside the ascending channel, respecting both support and midline zones.
After bouncing from the lower boundary and holding above key horizontal support at $104.8K, BTC is showing signs of strength again.
With the trend intact and momentum building, a breakout toward the $116k 120k supply zone looks likely in the coming days.
Bulls remain in control as long as price holds above the mid channel and key FVG (Fair Value Gap) areas.
Watch the channel closely for confirmation.
DYRO, NFA

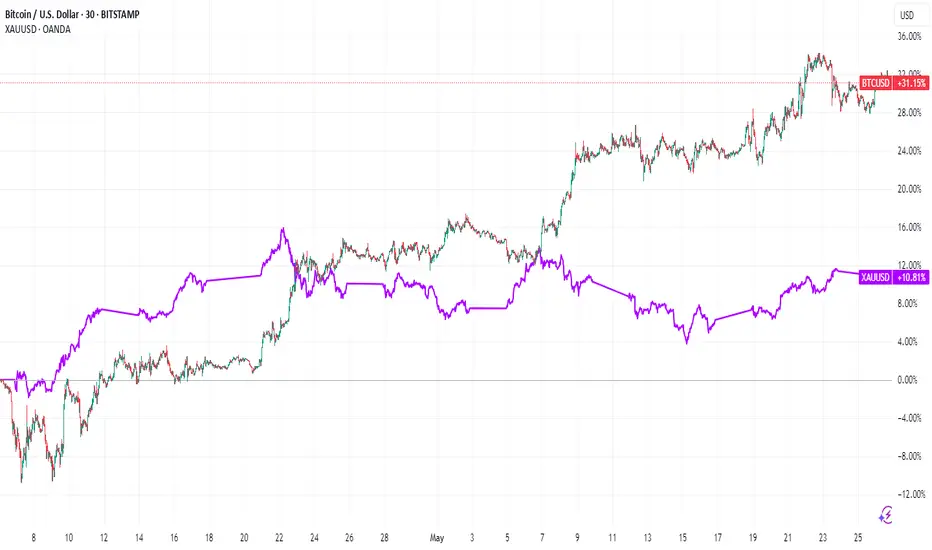
Bitcoin vs. Gold: Central Banks Pick Gold (Here's Why)
The debate over the ultimate store of value has been reignited in the digital age. For centuries, gold, the immutable yellow metal, has been the bedrock of wealth preservation, the trusted haven in times of turmoil, and a core component of central bank reserves. In the last decade, a new contender has emerged: Bitcoin, the pioneering cryptocurrency, often touted as "digital gold." Yet, as the dust settles on initial exuberance and institutional scrutiny intensifies, a clear preference is emerging from the world's most conservative financial institutions. Central banks, the guardians of national wealth and financial stability, are overwhelmingly demonstrating their continued faith in gold, signaling that when it comes to the ultimate safe reserve, tradition and tangibility still trump technological novelty.
The evidence for this preference is not merely anecdotal; it's etched in the consistent and accelerating trend of global gold accumulation by these institutions. In recent years, central banks have been on a gold buying spree, a phenomenon driven by a confluence of potent global factors. The shifting geopolitical landscape, characterized by increased tensions, trade disputes, and a move towards a more multipolar world, has spurred a desire for assets that are not tied to any single nation's political or economic fortunes. Policies emanating from major economic powers, including periods of heightened trade protectionism and shifting global alliances, have historically fanned uncertainty, prompting a flight to assets perceived as universally valuable and politically neutral – a role gold has fulfilled for millennia.
Furthermore, concerns over the long-term value of major fiat currencies, particularly the U.S. dollar which has long dominated global reserves, are playing a significant role. Persistent fiscal deficits, expanding sovereign debt levels, and unprecedented monetary stimulus measures in various countries have led to an undercurrent of apprehension about potential currency devaluation. In such an environment, central banks are actively seeking to diversify their holdings and hedge against the erosion of purchasing power. Gold, with its intrinsic value and finite supply, offers a compelling alternative to holding ever-increasing amounts of fiat currency, whose value can be diluted by policy decisions. This strategic de-dollarization, or at least a diversification away from dollar-centric reserves, sees gold as a primary beneficiary. It is a tangible asset that sits outside the traditional financial system, offering a layer of insulation from the counterparty risks inherent in holding other nations' currencies or debt.
In stark contrast to this institutional embrace of gold stands Bitcoin. While proponents champion its decentralized nature, its mathematically enforced scarcity, and its potential as an inflation hedge, its inherent characteristics currently make it a challenging proposition for central bank reserves. The most glaring issue is its extreme volatility. Bitcoin's price history is a rollercoaster of meteoric rises and precipitous falls. For an individual retail investor, this volatility might be a tolerable, even attractive, risk in pursuit of outsized returns. However, for a central bank, whose primary mandate includes capital preservation and maintaining financial stability, such wild price swings are anathema. Reserve assets must be relatively stable, liquid, and dependable. Bitcoin, in its current state, struggles to meet these criteria consistently. A significant allocation to Bitcoin could expose a nation's reserves to sudden and substantial losses, undermining public trust and potentially destabilizing its financial position.
This volatility poses a tangible risk, not just theoretically, but as observed in the experiences of investors globally, including those in the U.S. While some have reaped fortunes, many others have faced considerable losses due to ill-timed investments or the market's unpredictable nature. Institutional investors, including those in the U.S., while showing increasing interest in Bitcoin as a speculative asset class or a small part of a diversified portfolio, still largely treat it with caution. The kind of deep, unwavering institutional trust that gold commands – built over centuries of proven performance as a store of value and a crisis hedge – has yet to be earned by Bitcoin. Gold’s market is deep, liquid, and well-understood, with established clearing and settlement mechanisms. Bitcoin's market infrastructure, while maturing, is still relatively nascent and fragmented compared to the centuries-old gold market.
Beyond volatility, other factors hinder Bitcoin's adoption as a mainstream reserve asset for central banks. Regulatory uncertainty remains a significant hurdle. The global regulatory landscape for cryptocurrencies is a patchwork of differing approaches, with some nations embracing innovation while others impose strict controls or outright bans. For central banks, which operate within stringent legal and regulatory frameworks, this lack of global consensus and clarity is a major deterrent. The operational risks associated with custody and security of digital assets at a sovereign scale are also non-trivial. While blockchain technology is inherently secure, managing private keys for billions of dollars' worth of Bitcoin requires sophisticated and untested protocols for institutions of this nature.
Furthermore, the narrative of Bitcoin as "digital gold" sometimes overlooks fundamental differences. Gold is a physical commodity with diverse industrial and cultural uses, providing a baseline of demand beyond its monetary role. It is universally recognized and accepted, transcending technological barriers. Bitcoin’s value is derived primarily from its network effects, its code, and investor belief in its future utility and adoption. While powerful, these are different underpinnings than the tangible reality of physical gold bullion held in a central bank's vault.
The actions of central banks speak volumes. While a handful of smaller nations or entities might experiment with Bitcoin, the overwhelming majority of major central banks, those that collectively manage the bulk of global reserves, have either remained silent on Bitcoin or have issued cautious warnings, all while steadily increasing their physical gold holdings. This isn't to say that Bitcoin has no future role or value. It may well continue to evolve as a speculative asset, a niche store of value for some, or a technology platform for new financial applications. However, the idea that it is poised to usurp gold's position in the vaults of central banks appears premature, if not fundamentally misguided, given its current attributes.
In conclusion, the debate between Bitcoin and gold as the preferred store of value and reserve asset has a clear, if perhaps unexciting, winner in the eyes of the world's central banks. Faced with geopolitical instability, the specter of dollar devaluation, and the enduring need for reliable safe-haven assets, these institutions are doubling down on gold. Its long history, proven stability, tangibility, and lack of counterparty risk resonate deeply with their conservative mandates. Bitcoin's volatility, regulatory ambiguity, and operational complexities, while potentially surmountable in the distant future, currently render it unsuitable for the core reserve holdings of nations. While U.S. investors and others may grapple with Bitcoin's risk-reward profile, central banks have largely made their choice, and that choice, for now and the foreseeable future, remains firmly with the ancient, trusted allure of gold.
$BTC – Breaking Out of the Pattern?📈 Bitcoin ( CRYPTOCAP:BTC ) is testing the upper resistance zone of a multi-month structure.
✅ Break of Structure (BOS) has already occurred, adding fuel to the bullish case.
🚀 Just a bit more upside and CRYPTOCAP:BTC could escape this consolidation pattern completely.
Key levels to watch:
Break above ~$110K area
Green trendline remains strong support
Eyes on higher timeframe close to confirm breakout
This could be a pivot point for Bitcoin’s next leg higher — or a trap if sellers step in hard.

BTC Crypto Futures Trade Plan 2025-05-26BTC Crypto Analysis Summary (2025-05-26)
Comprehensive Summary of Each Model
Grok/xAI Report
BTC at $109,553, trading above all major MAs (20/50/200 SMAs, 9/21 EMAs) → strong bullish trend RSI 67.02 (approaching overbought), MACD positive but slight bearish divergence Volume declining → possible consolidation or reduced buying interest Funding rate low (0.0002%) → not overleveraged long Trade suggested: long at $110,000, SL $107,000, TP1 $113,000, TP2 $115,000, size 1% equity, confidence 80%
Claude/Anthropic Report
Confirms price above all key MAs, RSI approaching overbought, MACD divergence Price near upper Bollinger Band → resistance Concludes short-term momentum weakening → moderately bearish bias Recommends no trade (confidence 72%), waits for break above $111,800 or below $105,000
Llama/Meta Report
Bullish MA alignment, RSI slightly overbought, price near upper BB Funding rate neutral, sentiment generally positive Trade suggested: long on pullback to SMA20 at $105,295.59, SL $103,000, TP $110,000, size = 2–3% equity, confidence 80%
Gemini/Google Report
Strong bullish trend (EMA9 > EMA21 > SMA20 > SMA50 > SMA200), RSI 67, BB upper ~$111,724 MACD bearish crossover → potential short-term pullback Recommends long at ~$109,550, SL $107,700, TP $113,100, size 1 BTC, confidence 75%
DeepSeek Report
Price near upper Bollinger Band, MACD bearish crossover, RSI divergence Countertrend short trade: entry $109,553, SL $111,725, TP $105,295, size 1 BTC, confidence 75% Areas of Agreement and Disagreement
Agreement
BTC is in a strong uptrend, trading above all major moving averages RSI ~67 suggests rising momentum but nearing overbought MACD shows a bearish divergence or crossover, warning of short-term momentum loss Price is close to the upper Bollinger Band → stretched conditions
Disagreement
Directional bias: Grok, Llama, and Gemini bullish; Claude is cautious/no-trade; DeepSeek bearish countertrend Entry levels: ranges from pullbacks to 105k (Llama) to market price ~109.55k (Gemini/Grok) Risk appetite: varying leverage and position-sizing recommendations Trade/no-trade: Claude advises holding; others recommend active positions Conclusion and Trade Recommendation
Overall Market Direction Consensus
Moderately Bullish: the dominant trend is up, supported by MA structure and recent performance, despite short-term momentum warnings.
Recommended Trade
Direction: Long BTC futures Entry Range: Near current market (109,500–109,600) or immediate retest of EMA9 (~109,550) Stop Loss: 107,700 (below EMA9 and minor support) Take Profit: 113,100 (just above recent swing highs/upper BB) Position Size: 1 BTC (adjust per account to risk ~1–2%) Confidence Level: 78%
Key Risks and Considerations
Momentum Divergence: MACD bearish crossover and RSI near overbought may trigger a pullback Volatility Spikes: leverage can amplify slippage and liquidation risk Broader Crypto Moves: altcoin correlation or market-wide news can quickly shift prices Funding Rate Shifts: a sudden spike could accelerate long-side liquidations
TRADE_DETAILS (JSON Format) { "instrument": "BTC", "direction": "long", "entry_price": 109550.0, "stop_loss": 107700.0, "take_profit": 113100.0, "size": 1, "confidence": 0.78, "entry_timing": "market_open" }
📊 TRADE DETAILS 📊 🎯 Instrument: BTC 📈 Direction: LONG 💰 Entry Price: 109550.0 🛑 Stop Loss: 107700.0 🎯 Take Profit: 113100.0 📊 Size: 1 💪 Confidence: 78% ⏰ Entry Timing: market_open
Disclaimer: This newsletter is not trading or investment advice but for general informational purposes only. This newsletter represents my personal opinions based on proprietary research which I am sharing publicly as my personal blog. Futures, stocks, and options trading of any kind involves a lot of risk. No guarantee of any profit whatsoever is made. In fact, you may lose everything you have. So be very careful. I guarantee no profit whatsoever, You assume the entire cost and risk of any trading or investing activities you choose to undertake. You are solely responsible for making your own investment decisions. Owners/authors of this newsletter, its representatives, its principals, its moderators, and its members, are NOT registered as securities broker-dealers or investment advisors either with the U.S. Securities and Exchange Commission, CFTC, or with any other securities/regulatory authority. Consult with a registered investment advisor, broker-dealer, and/or financial advisor. By reading and using this newsletter or any of my publications, you are agreeing to these terms. Any screenshots used here are courtesy of TradingView. I am just an end user with no affiliations with them. Information and quotes shared in this blog can be 100% wrong. Markets are risky and can go to 0 at any time. Furthermore, you will not share or copy any content in this blog as it is the authors' IP. By reading this blog, you accept these terms of conditions and acknowledge I am sharing this blog as my personal trading journal, nothing more.

bitcoin needs a long term downward correction Bitcoin right now is in a overbought condition. technically it already gives sign for a downward correction . wait for the marking position. here you need to find the sell confirmation.
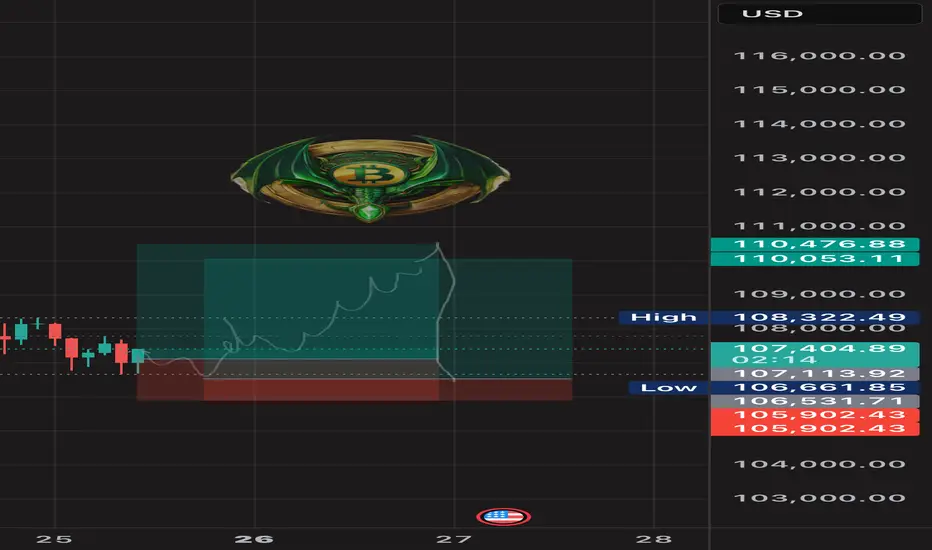
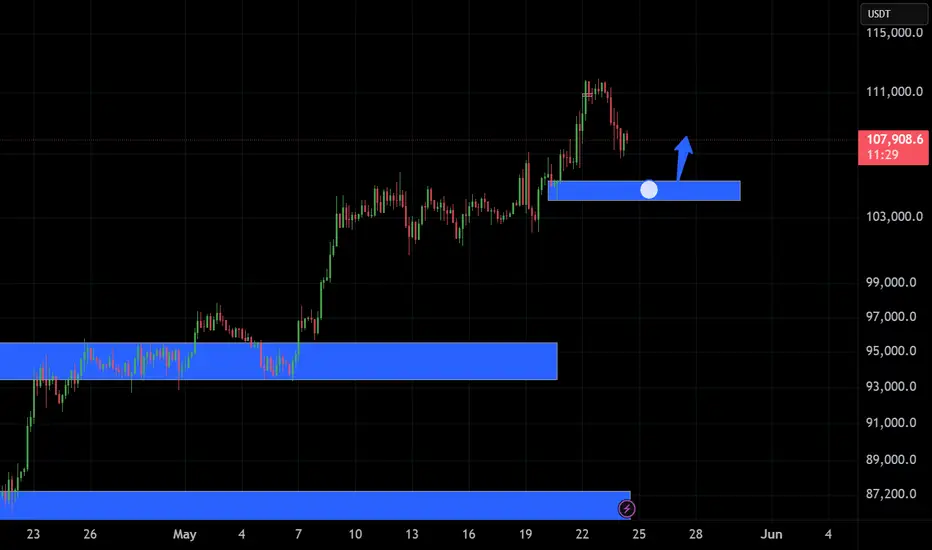
BTC LONG TP:110,000 25-05-2025🚀 LONG setup in play
Looking to enter between 106,500 and 107,000, targeting 109,800–110,300 on the 2H chart.
Estimated duration: 24 hours ⏳
We’re riding a bullish rebound — clean structure, strong reaction.
If the move doesn’t happen within the projected window, the setup is invalid.
We don’t use indicators, we’re not out here drawing lines or cute little shapes — I just give you a clean trade.
#BTC #PriceAction #Reydragon21
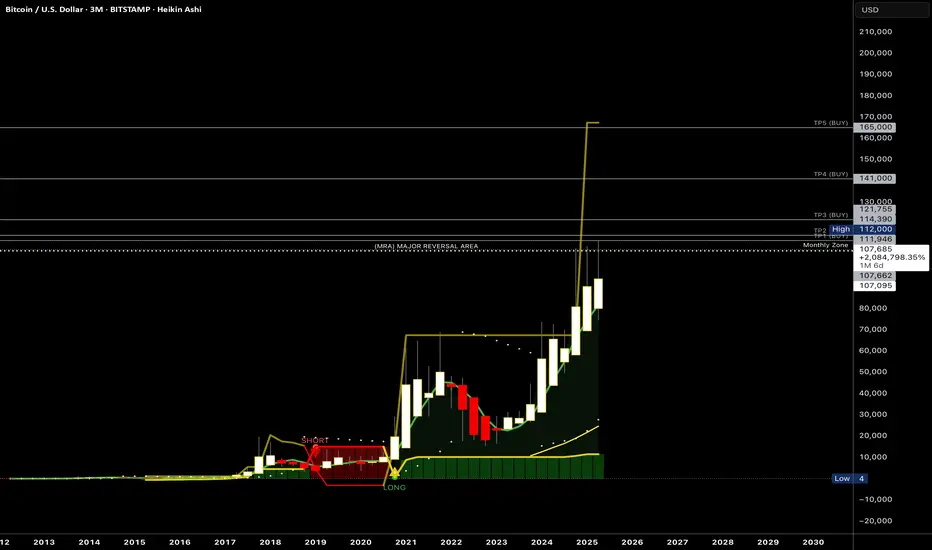
BTC Market Analysis for Q2BTC Market Analysis for Q2 - As we end the month the market tends to rescind. Pay close attention to the monthly and weekly zones. Price needs to break above the monthly zone. Let’s see if the month of June opens up above $107,700 that would indicate a continuation to the upside - possibly to $120-125K…
Weekly Analysis for BTC (May 26–30)BTC played out clean last week. Broke above 108k, tapped a new ATH at 110.5k, and pulled back slightly. Structure still bullish — 4H HLs holding strong and 107k retest held nicely into weekend close.
Key level to watch is 110k. If we break that with momentum, price can push to 115k or even 120.7k based on fibs and hype continuation. If we reject again, we might pull back to 107k or 100k — still a buy zone unless 88k breaks.
On the macro side, confluence is heavy:
– ETFs still driving big money inflow
– US debt growing after Trump’s new tax bill
– Moody’s downgrade adds more pressure
– Geopolitical tensions + safe-haven flow also helping BTC hold strength
– Holiday week in the US (Memorial Day), so volume might be low — fakeouts possible if liquidity dries up
Best zones to watch this week:
🔸 110k breakout for continuation
🔸 107k and 100k pullback buys
🔸 110.5k ATH for possible rejection scalps
As long as 88k holds, structure is clean. Bias remains bullish with both TA and macro pointing up.
Will be posting more detial daily anaylsis. follow for more updates. Or check out Streefree_trade IG.

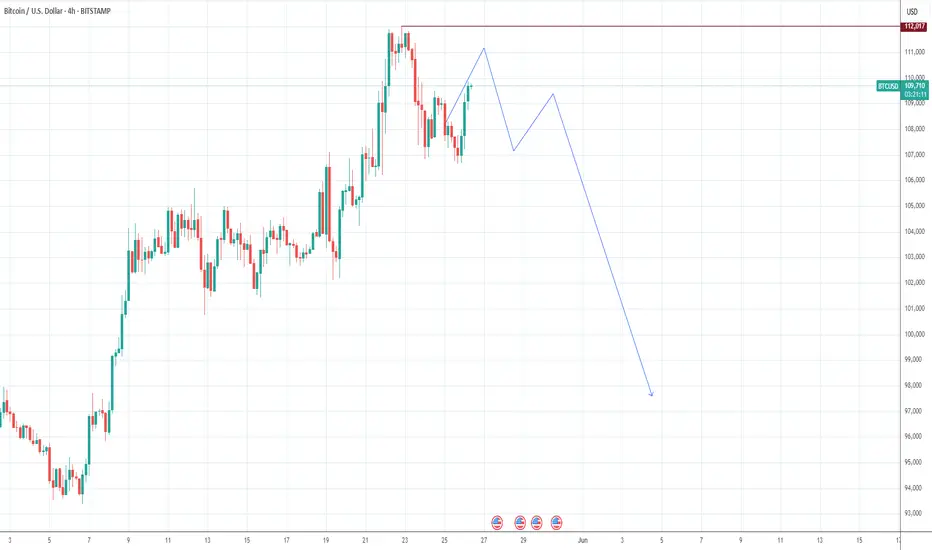
Is the BTC Bull Tired ? A Healthy Pullback May Be on the Horizon🚨 Market Watch Update 🚨
Hey fam while the macro trend is still bullish overall, I'm noticing signs that this current uptrend might be running out of steam. There’s a good chance we’re nearing a breakdown from the rising channel, which could open the door for a healthy correction down toward that ~$90K area.
Last week’s breakout really shook things up a ton of short positions got liquidated, which helped push the price higher in the short term. Classic squeeze move. 👀
But here’s what I’m watching next
🔻 In the near term, I’m leaning slightly bearish. I wouldn’t be surprised if price pulls back into the $102K–$99K zone sometime this week. That range could offer a decent reset before the next major move.
🧠 Remember, when green candles start popping, retail FOMO tends to kick in hard — folks jump in late, thinking the rally will never end.
That’s exactly where market makers step in, taking profits and reloading at better levels. Don’t be the exit liquidity.
Stay patient. Stay sharp. And as always I’ll keep you posted with a deeper dive soon. 🎯

BTCUSD - NEW ATH!MARKET REVIEW
My previous analysis was proven right but i ended up taking 2 losses be the Buys actually happened. This only tells you that analysis isn't all there is to trading, you have to be right also with your Timing & Execution.
BTC/USDT Long Buy TradeBINANCE:BTCUSDT.P
Entry 108100
SL 107200
TGT 113700
BTC forming The Signature W Pattern

Bitcoin (BTC/USD) – Rising Wedge Pattern Signals & BreakdownThis chart illustrates a Rising Wedge Pattern on the weekly timeframe for Bitcoin (BTC/USD), which is generally considered a bearish reversal pattern in technical analysis. The pattern appears after a strong upward move and typically signals that the price is losing momentum and may be preparing for a significant correction.
📐 What is a Rising Wedge Pattern?
A rising wedge is a chart pattern formed when the price consolidates between two upward-sloping trendlines – the support line (bottom) and the resistance line (top) – with the two lines converging toward each other.
As price climbs higher, it forms higher highs and higher lows.
However, the slope of the highs is less steep than the slope of the lows, showing a loss of bullish strength.
Eventually, the price breaks below the support line, often leading to a sharp move downward.
🔍 Key Highlights from the Chart:
📌 1. Major Resistance Zone (~$110K–$120K):
BTC is currently facing heavy resistance in this area.
This zone has historically acted as a supply zone where bulls have struggled to break through.
Multiple rejection wicks indicate strong selling pressure.
📌 2. Pattern Touchpoints:
BTC has now formed multiple touchpoints on both the support and resistance lines of the wedge, confirming the structure.
This gives the pattern higher validity from a technical analysis perspective.
📌 3. SR Interchange Zone (~$65K–$70K):
This is a key horizontal zone where past resistance could act as future support.
A successful breakdown may first test this level before continuation.
📌 4. Retesting After Breakdown:
After breaking the wedge support, a retest of the broken trendline is often seen.
If the retest is rejected, it confirms the breakdown and opens the door to deeper bearish movement.
🎯 Target Projection:
If the wedge breaks down and the bearish scenario plays out, we could see Bitcoin fall to the $22,000–$25,000 region – marked as the final target zone on the chart. This level aligns with:
Previous macro-support zones from 2021
Fibonacci retracement levels
Psychological price levels where buyers may re-enter
⚠️ Bearish Factors to Watch:
Bearish divergence on indicators like RSI or MACD (not shown on chart but worth checking)
Volume decreasing as price rises – a classic wedge behavior
Macroeconomic headwinds or Bitcoin halving-related exhaustion
Rejection from major resistance with strong bearish candles
🕒 Timeframe & Patience:
This is a weekly chart, which means the pattern will play out over weeks or months, not days. Patience is key. A clear break, retest, and rejection would be the most reliable confirmation to expect further downside.
✅ Invalidation Scenario:
If BTC breaks above the wedge resistance line with strong bullish volume and holds above the $120K level, this bearish thesis becomes invalid.
In that case, BTC could enter price discovery mode, making new all-time highs.
💬 Final Thoughts:
This analysis is a technical outlook, not financial advice. Always use stop-loss strategies and manage your risk carefully. Market sentiment, news, and macro factors can quickly shift the scenario. However, from a purely technical standpoint, the rising wedge pattern is a powerful signal that should not be ignored.

Bitcoin - Correction Is Finally Happening!Hello, Skyrexians!
Let's continue trying to guess when BINANCE:BTCUSDT will have a correction. This time it's very likely, but I am not recommend to short this correction because this is the trade against the major trend.
Let's take a look ate 12 hours time frame. Wave 3 is likely to be finished with internal double divergence on Awesome Oscillator. Now it's finally time for the wave 4. 0.38 Fibonacci is the most likely target at $101k. After that wave 5 is expected and it's going to be only higher degree wave 1.
Best regards,
Ivan Skyrexio
___________________________________________________________
Please, boost this article and subscribe our page if you like analysis!

BTCUSDT 4H Analysis BTC ~ 4H Analysis
#BTC Let's start Long/Buy back at this support block with long term target of $120K - $130K - $140K - $150K above this is just bonus for you.

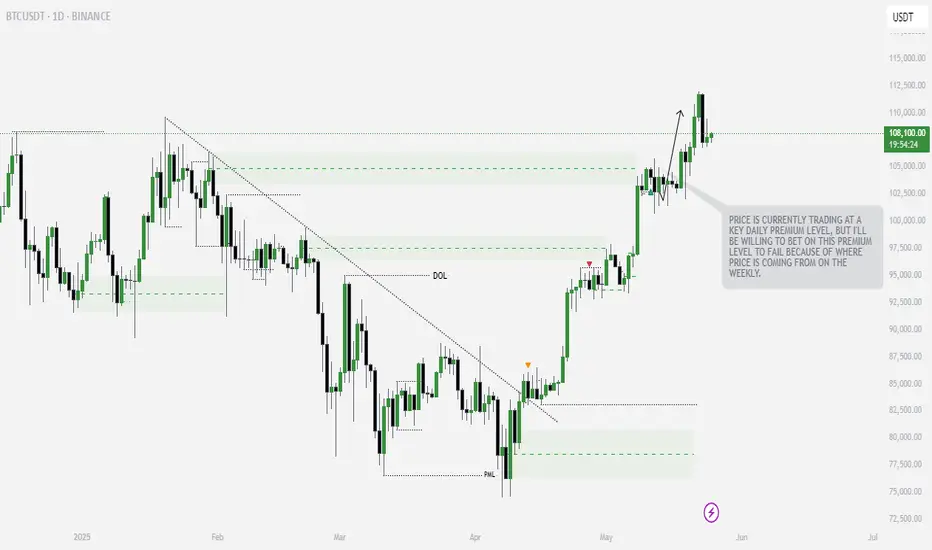
BTC/USD IS A STRATEGIC CORRECTION OR A NEW RALLY AHEAD?BTC/USD 24 MAY – IS A STRATEGIC CORRECTION OR A NEW RALLY AHEAD?
🌐 MACRO & FUNDAMENTAL CONTEXT
Federal Reserve Outlook: Recent statements from Fed officials remain hawkish, signaling that interest rate cuts may not arrive soon. Inflation data remains sticky, adding pressure on risk-on assets like crypto in the short term.
Market Sentiment: Investors are cautious, with capital flowing back into safer assets amid global uncertainty. However, long-term sentiment on BTC remains strong, supported by fundamentals.
On-Chain Metrics: Wallet activity and hash rate growth continue to reflect strong underlying demand. This suggests accumulation despite short-term price pressure.
📉 TECHNICAL STRUCTURE (H1 CHART)
BTC/USD is currently correcting after reaching the 111,947 resistance area. Price bounced from the 106,831 support zone and is now approaching the mid-range levels again.
Chart Formation: A possible "bull trap" pattern is forming. Price may retest the 110,000 – 111,947 supply zone before deciding the next move.
EMA Signals: Short-term EMAs have crossed downward on the H1 timeframe, indicating a weakening bullish momentum.
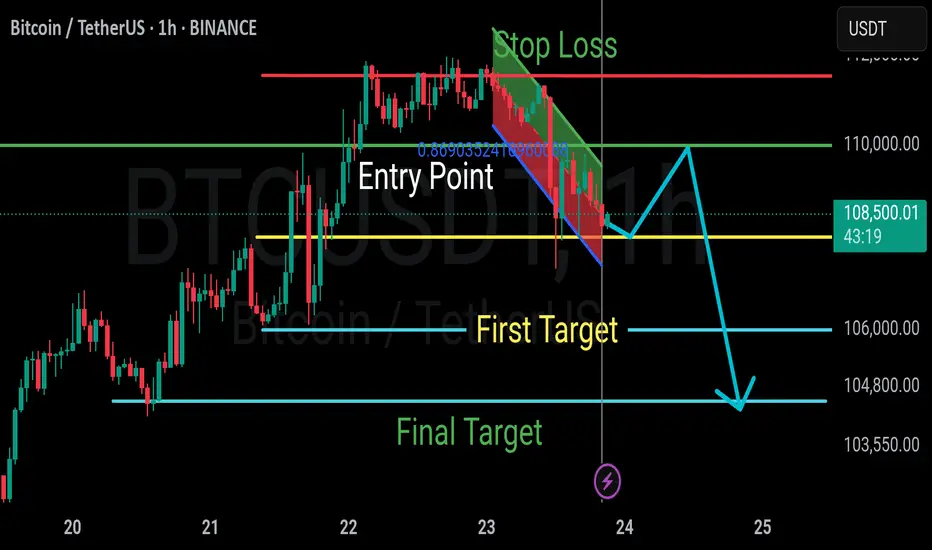
🎯 TRADE SETUPS FOR TODAY
🔻 SCALP SELL ZONE:
Entry: 111,800 – 111,950
Stop Loss: 112,200
Targets: 110,000 → 108,500 → 106,800 → 102,567
🔺 BUY ZONE (PULLBACK SUPPORT):
Entry: 106,800 – 106,600
Stop Loss: 106,200
Targets: 107,800 → 109,000 → 110,000
🔍 TECHNICAL KEY LEVELS
Resistance Zone: 111,947 – 112,000
Support Zone: 106,831 → 106,600 → 102,567
FIBO Key Levels: 0.5 – 109,393 | 0.382 – 108,763
⚠️ STRATEGY OUTLOOK
If BTC breaks above 112,000 with strong volume, expect a bullish continuation toward 114,000+ levels.
However, if price fails to hold above 110,000 and drops below 106,800, a deeper correction to 102,500 may follow.
📌 CONCLUSION
"BTC is at a decision point, trading between macro hawkish pressure and technical liquidity zones. Stay flexible and wait for confirmation before committing heavily."
Watch the US Jobless Claims data tonight for volatility triggers.
Avoid emotional trades. Use strict risk management.
Follow this profile for more real-time plans and updates.

BTCUSDHello Traders.
This is my analysis for BTCUSD.
I am not a professional and I would be happy if you share your opinion in the comments.

No one is talking about this! Big breakout Incoming! Here'S Why!CRYPTOCAP:USDT dominance is nearing a potential death cross on the daily chart. The last time this happened, we saw nearly 40 days of uninterrupted green across altcoins.
During that period, CRYPTOCAP:BTC rallied from $67,476 to $101,898. Many altcoins surged between 90% and 300%.
We’re now witnessing similar conditions unfold.
If this crossover gets delayed or invalidated (Less likely but entirely possible), altcoins may experience short-term corrections.
But the broader altcoin season remains inevitable.
If this helped you gain perspective, give it a like and repost.
You might want to bookmark it, I’ll update the chart as this plays out.
Don’t let short-term volatility shake you out of generational opportunities.
Be strong there, WAGMI!
#PEACE

BTCUSD Analysis – Potential Reversal Zone and Bearish SetupBTCUSD is currently trading near the 108,000 level and showing signs of a short-term downtrend. Price action suggests a possible minor upward retracement toward the 110,000 resistance area. This level aligns with previous price reactions and may act as a potential supply zone.
If BTCUSD approaches the 110,000 region and fails to break above it convincingly, it could present a bearish opportunity, with potential downside targets at:
107,000 (minor support)
106,000 (structural level)
104,500 (major support and potential trend continuation target)
A clear break above 110,500 would invalidate this scenario, suggesting a shift in market momentum.
Note: This analysis is for educational purposes only and does not constitute financial advice. Always manage risk according to your trading plan.
DeGRAM | BTCUSD new ATH📊 Technical Analysis
● Daily candle has closed above 108 250 $ – the February swing cap – completing an 8-week ascending triangle inside the rising channel and confirming fresh trend-acceleration.
● Momentum push has opened clear air to the red 112 000 $ supply / channel roof; former breakout line at 105 400 $ now acts as layered support together with the purple guideline.
💡 Fundamental Analysis
● Spot-ETF cohort (IBIT, FBTC, ARKB) logged a three-day net inflow >5 000 BTC while exchange reserves printed a new 3-year low (CryptoQuant), pointing to tightening tradable supply.
● DXY pulled back after FOMC minutes showed no appetite for further hikes, tempering real-yield gains and reviving crypto bid.
✨ Summary
Buy dips 106-108 k; upside window targets 112 k, stretch 115 k. Bull bias void only on a daily close beneath 100.7 k.
-------------------
Share your opinion in the comments and support the idea with a like. Thanks for your support!

Digital gold breaks records: Bitcoin broke through the $111,000 On May 22, 2025, Bitcoin (#BTCUSD) reached a new all-time high, surpassing the $111,000 mark. Notably, this record was set on the day marking the 15th anniversary of Bitcoin Pizza Day - a symbolic date commemorating the first real-world purchase made with #BTCUSD in 2010.
Several major factors have contributed to the recent rise of Bitcoin:
Institutional Investment : The launch of spot Bitcoin ETFs by BlackRock, Fidelity, and others has opened the door for large-scale investors to access #BTCUSD, boosting both liquidity and demand.
Regulatory Clarity : The adoption of clear cryptocurrency regulations in the U.S. and the EU has increased trust in digital assets and attracted more conservative capital.
Banking Integration : Support for #BTCUSD by apps like PayPal, Revolut, and major banks has simplified access for millions of users and expanded its real-world usage.
Macroeconomic Instability : Inflation, geopolitical tensions, and the weakening of fiat currencies have strengthened demand for #BTCUSD as "digital gold" and a means of capital preservation.
Halving and Technological Progress : The reduction in BTC issuance and the ongoing development of the Lightning Network are reinforcing Bitcoin’s scarcity and enhancing its fundamental value.
Surpassing such a significant price level has reinforced #BTCUSD’s position as one of the key assets in today’s financial markets, confirming its status as "digital gold." The rally has sparked a wave of optimism and renewed activity on crypto exchanges, while also drawing increased interest in digital assets from the broader public.
FreshForex analysts share the view that #BTCUSD still holds significant growth potential. In our assessment, the breakout above $111,000 in May signals a continuing upward trend and the possibility of further gains, driven by growing institutional interest.

Bitcoin Remains Bulish once again, almostinner cycle 5 waeces impulse looks completed , but bigger cycle not just yet,
Sell from current levels to 103.000
Buy from 103.000 Targetting 117.000 / 123.000
GG
