$BTC Double Top Pattern Forming – Is a Major Correction Bitcoin Double Top Formation Alert!
Currently, CRYPTOCAP:BTC appears to be forming a Double Top pattern on the 4H chart. If this candle closes as an Inverted Hammer, it may confirm a bearish reversal from the overbought zone.
Key Levels to Watch:
Immediate Support: $96,500 – $95,000
Critical Support: $94,000
Major Breakdown Levels:
If $94K breaks, next support is at $91,000
A deeper breakdown could target $80,000 or even $60,000
This correction could present a golden long opportunity for the next bullish leg. Stay patient, observe confirmations, and plan your entries wisely.
Btcusdanalysis

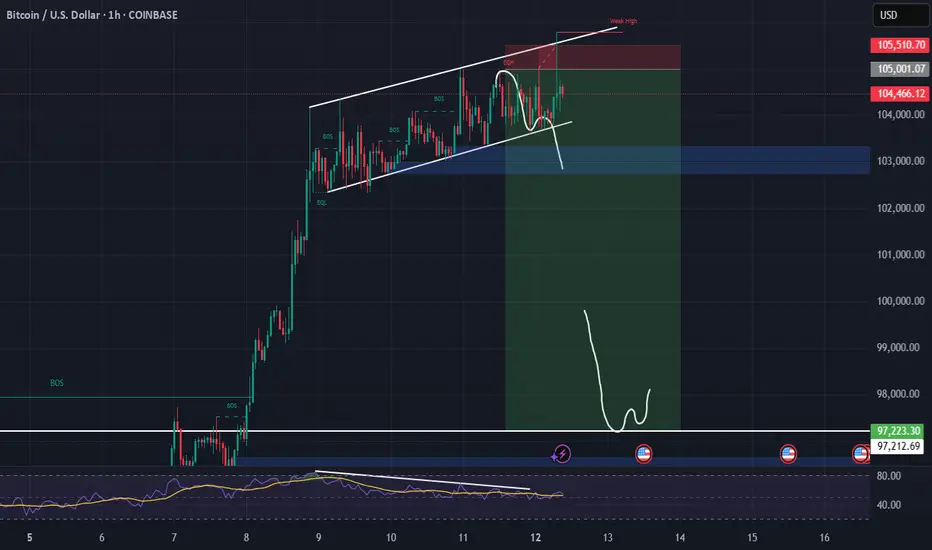
Where Is The Correction For Bitcoin?Hello, Skyrexians!
Recently we told about potential correction on BINANCE:BTCUSDT and current pump did not change anything except targets for this correction.
My mistake was that I counted wave 5 inside 3 as the wave 5, but warned you that I often have this mistake. Now looking at the awesome oscillator it's obviously that wave 4 has not been even started. Anyway wave 3 has been already pumped above the 1.61 Fibonacci it means that wave 5 will be not extended. Very soon corrective wave 4 will be started. The target now is between 0.38 and 0.5 Fibonacci retracement levels, approximately at $95k. Anyway, taking short against trend is bad idea. The only one way you can use this info is to define the zone where you can take long trade, but I will not take. I told in one of my analysis when Bitcoin was $76k two months ago that growth above $140k has been started, I don't like to anticipate small moves.
This was my global forecast
Best regards,
Ivan Skyrexio
___________________________________________________________
Please, boost this article and subscribe our page if you like analysis!

BTC repeating of patternsI see repeating of patterns and it was and will help BTC to continue the up trend.

BTC/USDT at Decision Point: Triangle Pattern Signals BreakoutHello guys!
Bitcoin is consolidating in a symmetrical triangle pattern near a key resistance zone after a strong uptrend within the ascending channel. The price is trading just below the triangle’s top line, indicating a potential breakout or breakdown setup.
✔ Key Scenarios:
👀 Scenario 1 – Bullish Breakout:
If BTC breaks above the top of the triangle, we could see a sharp move upward toward the $106K resistance zone and potentially higher.
This would signal trend continuation and strength in the bullish momentum.
👀 Scenario 2 – Temporary Pullback (Triangle Breakdown):
If BTC breaks the bottom of the triangle, the price might fall toward the $99,715 support level.
This zone is also aligned with a previous consolidation and could serve as a strong demand area.
A bullish reversal from this area is likely, providing another long opportunity targeting the same $106K resistance.
Conclusion:
Bitcoin is moving in a tightening range. A breakout from the triangle will dictate the next move. For clearer direction, traders should watch for a decisive move above or below the triangle structure.

BTC/USDTbtc is ready to enter acceleration phase.
expect high volatility in all coins. it's better to go for swing long or hold rather than using high leverage with tight stop losses

BTCUSD - Bearish Rejection Below Resistance | Targeting 95KBitcoin is currently facing strong resistance at $104,833, just below the invalidation level at $106,486. Price action suggests a potential rejection or distribution pattern forming near this resistance zone.
A break below recent local support could trigger a move toward the next key support level at $95,371, representing a significant retracement area from the recent uptrend.
---
Trade Idea:
Entry: After confirmation of rejection below $104,800
Target: $95,371
Invalidation: Sustained breakout above $106,486
This setup favors bears in the short term, as long as price remains below the invalidation zone.
---
> Disclaimer:
This analysis is for educational and informational purposes only and does not constitute financial advice. Always do your own research and consult with a professional before making any trading decisions. Trade at your own risk.

BTCUSD - Bullish Breakout from Falling Wedge Pattern | Target Bitcoin has broken out of a Falling Wedge Pattern on the daily timeframe, signaling a bullish reversal that aligns with the broader market sentiment. Let’s examine this setup in detail, from pattern recognition to key support/resistance levels and trade planning.
🧠 Pattern Analysis – Falling Wedge Formation
The chart displays a textbook Falling Wedge, which is a bullish chart pattern that typically forms after a downtrend. It’s characterized by converging trendlines sloping downward, showing a slowdown in bearish momentum and a potential reversal point.
Formation Period: This wedge developed over a multi-week period (Feb–April 2025).
Structure: Each swing high and swing low forms lower highs and lower lows inside the wedge.
Breakout Confirmation: Price has decisively broken above the upper trendline of the wedge, validating a potential bullish continuation.
👉 Falling Wedge patterns are often seen near the end of a corrective move and suggest accumulation before a rally.
🔎 Key Technical Zones
🔸 Resistance Zone (~$103K–$105K)
This area has historically acted as a strong resistance zone.
Price is currently consolidating just below this region, indicating a possible breakout retest or a temporary pause before the next leg up.
🔸 Trendline Support
A new rising trendline has emerged post-breakout, acting as dynamic support.
Price has respected this trendline multiple times, forming higher highs and higher lows — a strong bullish signal.
🔸 SR Interchange Zone (~ GETTEX:92K –$94K)
Previously acted as resistance; now flipped to support.
This makes it a critical level where bulls may defend positions, and a good place for a stop-loss.
🔸 Support Zone (~$75K–$78K)
Major historical support area where the wedge bottom formed.
Buyers stepped in aggressively in this zone during the final leg of the wedge.
🎯 Trade Plan
This setup offers a clearly defined risk-reward profile based on breakout trading principles.
📌 Entry Idea:
Current consolidation near resistance offers two entry strategies:
Aggressive Entry: Near current price, anticipating breakout continuation.
Conservative Entry: On a confirmed breakout above $105K or a pullback to trendline support around GETTEX:98K –$100K.
✅ Target: $112,116
Measured by projecting the height of the wedge from the breakout point.
Also aligns with a previous key structural high, adding confluence to the target.
⛔ Stop Loss: $93,294
Strategically placed just below the SR interchange zone and rising trendline.
Protects against potential fakeouts or trendline breaks.
📉 Risk Management
Risk/Reward Ratio: ~2:1 or higher depending on entry point.
Always use proper position sizing.
Be prepared to cut the trade if price closes below trendline and SR zone on high volume.
🔮 Outlook and Strategy
This breakout suggests Bitcoin may be entering a renewed bullish phase. If macro conditions remain favorable and price sustains above key support zones, we could see continuation toward the $112K region.
However, it’s important to monitor:
Volume: Watch for rising volume on any breakout above the resistance zone.
Market Sentiment: External factors (e.g., news, ETF flows, regulatory updates) may influence the move.
Trendline behavior: A break and close below the rising support line may invalidate the setup.
💬 Final Thoughts
This is a technically clean setup combining a bullish pattern breakout, supportive structure (trendline & SR zones), and a logical target based on classical charting. If Bitcoin maintains current momentum, traders may see significant upside in the coming weeks.

BTC/USDT LONGBINANCE:BTCUSDT.P
Entry 102700
SL 102570 (only 130 points)
TGT 103600
W pattern trade
Wait for retracement before taking the trade

Swimming Amongst SharksStarting with the boring range in February, BTC consolidated after making new ATHs on the day of President Trump's second term inauguration.
After a slow month of sideways action in February, we finally reached the apex of a symmetrical triangle and proceeded to dump, attempting at closing the breakaway CME gap @ ~76.5k. It quickly and violently bounced to 95k where we spent the next 51 days making new lows and ranging in the 80k region.
When we take a closer look at the fibonacci retracements of all of these moves, they are very technical.
When pulling a standard fibonacci retracement XA, we find that B falls perfectly within the golden pocket. Roughly 2 weeks later, we find ourselves at new range lows offering a very nice SFP reaction at point C which falls at the 1.272 fib expansion of AB.
In hindsight, this would have been the perfect place to get into a long position. But, unfortunately, I was looking for new lows around ~70k as this is where the 1.618 level was from a fib expansion of AB. This was during the time when tariffs were first being announced, causing major volatility across all markets. People were panic selling and calling for an economic crisis because of Donald Trump's tweets causing erratic behavior in markets.
We rally for the next 36 days offering no significant pullbacks to be able to get in on a long as it always seemed that we could get in on weakness as the rally produced a lot of SPs.
Now the BC expansion shows that we are nearing the end of this rally if this shark harmonic is to play out.
Waiting on confirmation of point D, but it is very possible that the high is in, and we start fulfilling this shark harmonic.
This would fall perfectly in line with the old adage "Sell in May and go away." or at least, first signs of weakness in May, and don't get chopped up.
There has also been a couple of potential events that could be classified as "black swan" that would affect the markets negatively like Coinbase announcing a user data leak, and Moody's downgrading of U.S debt.
Overall, we could see this shark harmonic be part of a HTF trend, coiling up before the next big move that breaks out near the end of summertime.
Always important to remember to practice proper risk management and that no trade is still a trade.

BTC Diamond PatternBTC is creating a Diamond Pattern and could create a measured move up to $108k-110k.
Cheers, and happy trading :)

Bitcoin Remains BullishIn Still Buying BTC either from current leveld as and from 102.000 too
Targets 108.500 / 12.000

Bitcoin (BTC) Price Outlook: Path to $150,000Overview:
Bitcoin continues to demonstrate remarkable strength, maintaining its long-term uptrend and consistently setting new highs. Based on my technical analysis, I am projecting a bullish target for BTC in the $150,000 region, supported by robust price action and key technical levels.
Trend Analysis:
The chart clearly illustrates a persistent upward trajectory, with BTC respecting a major ascending trendline that has acted as dynamic support throughout this cycle. This trendline not only underscores the prevailing bullish sentiment but also provides a reliable reference for potential pullbacks and trend continuation.
Key Levels:
BTC is currently trading near $102,800, having recently overcome several resistance levels. The next significant resistance zones are identified at approximately $106,500 and $109,400. However, the most critical area to watch is the $150,000 region, which is highlighted as a major resistance zone on the chart. This level represents both a psychological milestone and a technical barrier, where I anticipate increased volatility and profit-taking.
Support Structure:
On the downside, BTC is well-supported by multiple levels, including $95,200, $95,600, and $96,300. Should the market experience a correction, these zones are likely to attract buyers and provide a foundation for the next leg up. Further below, the $67,100 and $64,960 levels serve as deeper support, though a move to these areas would likely require a significant shift in market sentiment.
Technical Patterns:
The chart also highlights previous consolidation phases and breakout patterns, all of which have resolved to the upside. This consistent pattern of breaking out from consolidation channels further reinforces the bullish outlook.
Conclusion:
In summary, Bitcoin’s technical structure remains overwhelmingly positive. As long as the uptrend persists and key support levels hold, I expect BTC to continue its ascent toward the $150,000 target. Investors should monitor the intermediate resistance zones for potential short-term volatility, but the broader trend remains firmly intact.
Disclaimer: This analysis is for informational purposes only and does not constitute financial advice. Always conduct your own research before making investment decisions.

BTC-----Sell around 104000, target 102000 areaTechnical analysis of BTC contract on May 16:
Today, the large-cycle daily level closed with a small positive line yesterday, and the K-line pattern was single negative and single positive. The price was still consolidating at a high level. The attached chart indicator was running with a shrinking volume and the fast and slow lines showed signs of a dead cross. But again, the current signal is a retracement correction, not a trend, because at the weekly level, the price is just retracing the moving average, and everyone should be clear about this; the high pressure level is in the 105800 area, and the low point is in the 100600 area; the short-term price rebounded in the early morning, and retreated under pressure in the Asian morning. The intraday high was around the 104500 area. The current retracement did not continue, so there is still a demand for consumption during the day, but the hourly chart attached chart indicator has already crossed.
Therefore, today's BTC short-term contract trading strategy: sell at the 104000 area, stop loss at the 104500 area, and target the 102500 area

After $105K Peak, Bitcoin May Revisit 0.382 FOB Level!CRYPTOCAP:BTC is pulling back after hitting a high of $105,800
If you look at the daily chart, we haven’t seen any healthy pullback, the price has gone straight up.
In my opinion, a retest of the 0.382 FOB level around $94K would be a healthy correction for Bitcoin. Based on the liquidation heatmap, we’re also seeing liquidity building up at lower levels.
This is one of the signs of a pullback, which is important for a sustainable and healthy market.
Stay tuned and follow for more updates!

BITCOIN BTC Is Entering Into The Correction Read Caption Bitcoin Chart Analysis: Potential Correction Incoming
In my opinion, Bitcoin (BTC) is showing signs of entering a correction phase. The price is approaching its previous all-time high (ATH), and historically, such levels often act as strong resistance. With the market exhibiting signs of exhaustion and profit-taking behavior, a short-term pullback or consolidation could be expected before any further bullish continuation.
---
Would you like a more technical version with indicators (like RSI, MACD, or Fibonacci levels), or a visual chart to accompany

BTC Strength Alert: Key Levels, Fibonacci & VolatilityBitcoin (BTCUSD) Strength Alert: Key Levels, Fibonacci & Volatility Point to Entry Opportunities
Bitcoin (BTCUSD) Technical Analysis: Navigating Strength and Volatility
Bitcoin (BTCUSD) continues to capture the attention of the global financial markets, demonstrating notable resilience and underlying strength. The current market structure suggests a period where bulls are actively defending key price thresholds, creating a fascinating technical landscape. This analysis will provide an in-depth examination of BTCUSD, focusing on its price action relative to significant psychological levels, the supportive role of Fibonacci retracements, characteristic volatility patterns, and strategic entry considerations based on bullish candlestick formations.
1. Introduction to Bitcoin and the BTCUSD Pair
Bitcoin, introduced in 2009, stands as the progenitor of cryptocurrencies, operating on a decentralized peer-to-peer network secured by cryptographic principles and recorded on a public distributed ledger known as the blockchain. It was designed as a digital alternative to traditional fiat currencies, free from central bank control. The BTCUSD pair represents the exchange rate between Bitcoin and the United States Dollar, making it one of the most liquid and heavily traded instruments in the digital asset space. Its price movements are a barometer for the broader cryptocurrency market sentiment and are influenced by a myriad of factors including adoption trends, regulatory news, macroeconomic developments, and technological advancements within the Bitcoin network itself. Understanding the technical dynamics of BTCUSD is crucial for traders, investors, and market analysts seeking to navigate its often-turbulent price swings.
2. Current Market Sentiment and Price Action: Holding Above Key Psychological Levels
A significant observation in the current BTCUSD market is its ability to maintain its footing above a key psychological price level. Such levels, often round numbers (e.g., $50,000, $60,000, or in this context, a hypothetical significant level like $100,000 if we assume a major bull run has occurred), act as important mental benchmarks for market participants. When price successfully breaks above such a level and subsequently holds it as support, it can signal a powerful shift in market sentiment. This behavior suggests that buyers are willing to step in and defend this new valuation, absorbing selling pressure and preventing a swift retracement.
The act of holding above a major psychological level often has a self-fulfilling prophecy component. As traders and algorithms identify this level as critical, buy orders tend to cluster around it, reinforcing its strength as a support zone. Conversely, if the price were to decisively break below such a level after holding above it, it could trigger a cascade of stop-loss orders and a rapid decline, indicating that the previous bullish conviction has waned. The current strength shown by Bitcoin in maintaining its position above such a noted psychological threshold is therefore a bullish indicator, suggesting underlying demand and a positive short-to-medium-term outlook, provided this support continues to hold. This resilience can build confidence among market participants, potentially attracting further capital inflow.
3. Fibonacci Retracement Analysis: Identifying Strong Support
Fibonacci retracement levels are a cornerstone of technical analysis, employed to identify potential areas of support and resistance. Derived from the Fibonacci sequence – a series of numbers where each number is the sum of the two preceding ones (0, 1, 1, 2, 3, 5, 8, 13, etc.) – the key retracement levels are 23.6%, 38.2%, 50%, 61.8%, and 78.6%. These percentages are applied to a prior price swing (from a significant low to a significant high in an uptrend, or vice-versa in a downtrend) to project areas where the price might pull back before resuming the primary trend.
The observation that Fibonacci retracement levels suggest strong support at current BTCUSD levels is particularly pertinent. When the market is in an uptrend and experiences a corrective pullback, traders watch these Fibonacci levels closely. The 38.2%, 50%, and 61.8% levels are often considered the most significant. A retracement to, and subsequent bounce from, one of these levels indicates that the correction is likely a healthy pause within a larger bullish trend, rather than a reversal.
If BTCUSD is currently finding support near a critical Fibonacci level, it implies that the preceding upward momentum was strong, and the current consolidation or minor pullback is being met with buying interest at a mathematically significant point. For example, if Bitcoin recently rallied from point A (low) to point B (high), and has now retraced to the 61.8% level of that rally and is holding, it's a classic sign that bulls are re-entering the market, viewing the pullback as a discounted buying opportunity. The confluence of a psychological level with a Fibonacci support level would create an even more potent support zone, significantly increasing the probability of a price bounce. Traders often look for candlestick confirmation at these Fibonacci levels before committing to a position.
4. Volatility Analysis: US Evening and Asian Morning Hours
Volatility is an inherent characteristic of Bitcoin, representing the degree of variation of its trading price series over time. The observation that BTCUSD volatility tends to increase during US evening and Asian morning hours is a valuable insight for strategic trade timing. This period typically corresponds to the overlap between the closing of the New York trading session and the opening of major Asian financial centers like Tokyo, Hong Kong, and Singapore.
Several factors contribute to this heightened volatility:
Market Overlap and Liquidity Shifts: As one major market winds down and another ramps up, there can be shifts in liquidity. The initial hours of the Asian session often bring fresh news, order flows, and participants, leading to price discovery and increased trading activity.
News Dissemination: Significant economic data releases, corporate earnings (for Bitcoin-related companies), or crypto-specific news from either the US (late announcements) or Asia can occur during these hours, directly impacting BTCUSD prices.
Algorithmic Trading: Many trading algorithms are programmed to react to specific inter-market conditions or news events, and their activity can amplify price movements during these transitional periods.
Derivatives Market Activity: The global nature of Bitcoin derivatives markets (futures, options) means that activity in these markets can influence spot prices around the clock. The US evening/Asian morning window sees active participation from traders in these regions.
For traders, this period of increased volatility presents both opportunities and risks. Opportunities arise from potentially larger price swings that can be capitalized upon with well-timed entries. Risks are elevated due to the potential for rapid price changes, which can trigger stop-losses or lead to slippage. Therefore, while these hours can be opportune for entry, they also demand heightened vigilance and robust risk management.
5. Entry Strategies: Volatility, Candlestick Patterns, and Timing
Leveraging the increased volatility during US evening and Asian morning hours for entry timing requires a methodical approach, primarily focusing on the confirmation provided by bullish candlestick patterns. Candlestick charts offer a visual representation of price movements and can signal shifts in market sentiment and potential reversals or continuations.
Key Bullish Candlestick Patterns for Entry Confirmation:
Hammer: Appearing after a downtrend, a Hammer is characterized by a small real body at the upper end of the trading range, with a long lower shadow (at least twice the size of the body) and little to no upper shadow. It indicates that sellers initially pushed prices down, but buyers stepped in strongly to drive prices back up near the open, suggesting a potential bottom and bullish reversal.
Inverted Hammer: Also a bottom reversal pattern, the Inverted Hammer has a small real body at the lower end of the trading range, a long upper shadow, and a short (or absent) lower shadow. It suggests that buyers attempted to push the price up, but sellers resisted. However, the fact that buyers showed strength is a tentative bullish sign, requiring further confirmation.
Bullish Engulfing: This is a powerful two-candle reversal pattern. The first candle is bearish (red/black), and the second candle is bullish (green/white) with a real body that completely "engulfs" the real body of the preceding bearish candle. It signifies that buying pressure has overwhelmed selling pressure.
Piercing Line: Another two-candle bullish reversal pattern seen after a downtrend. The first candle is a strong bearish candle. The second candle opens below the low of the first candle but then closes more than halfway up the real body of the first bearish candle. This indicates a significant shift in sentiment from bearish to bullish during the second candle's session.
Morning Star: A three-candle bullish reversal pattern. It begins with a long bearish candle, followed by a small-bodied candle (which can be bullish or bearish and ideally gaps down from the first candle), and then a long bullish candle that closes well into the body of the first bearish candle (ideally gapping up from the second candle). The small middle candle (the "star") represents indecision, and the strong bullish third candle confirms the reversal.
Three White Soldiers: This is a strong bullish continuation or reversal pattern consisting of three consecutive long-bodied bullish candles. Each candle should open within the body of the previous candle and close at or near its high, making progressively higher highs. It signals sustained buying pressure.
Strategic Entry Timing:
Monitor Volatile Periods: Be particularly attentive to price action during the US evening and Asian morning hours.
Identify Key Support: Note the psychological levels and Fibonacci retracement zones where BTCUSD is expected to find support.
Scan for Bullish Candlesticks: Look for the formation of one of the aforementioned bullish candlestick patterns (or others like Dojis at support, Bullish Harami) at or near these support levels during the identified volatile periods.
Seek Confirmation: Wait for the candlestick pattern to fully complete at the close of its period (e.g., end of the hour for an hourly chart). Some traders wait for the next candle to trade above the high of the bullish pattern for further confirmation.
Volume Analysis: Higher trading volume accompanying the formation of a bullish candlestick pattern adds to its reliability, indicating stronger conviction behind the buying pressure.
Context is Key: Bullish reversal patterns are most potent when they appear after a discernible pullback within a larger uptrend, or at the end of a consolidation phase near strong support.
By combining the timing advantage of predictable volatility spikes with the confirmation signals from bullish candlestick patterns at technically significant support levels, traders can refine their entry strategies for BTCUSD.
6. Other Key Technical Indicators for Comprehensive Analysis
While the core observations provide a strong foundation, incorporating other technical indicators can offer a more holistic view of BTCUSD's market dynamics:
Moving Averages (MAs): MAs smooth out price data to identify trend direction and potential support/resistance. The 50-day, 100-day, and 200-day SMAs (Simple Moving Averages) or EMAs (Exponential Moving Averages) are widely watched. Price trading above these MAs is generally bullish. Crossovers, like a "golden cross" (50-day MA crossing above the 200-day MA), are considered strong long-term bullish signals. Conversely, a "death cross" (50-day MA crossing below the 200-day MA) is bearish.
Relative Strength Index (RSI): This momentum oscillator measures the speed and change of price movements, ranging from 0 to 100. An RSI above 70 is often considered overbought (suggesting a potential pullback), while below 30 is oversold (suggesting a potential bounce). However, in strong trends, BTCUSD can remain in overbought or oversold territory for extended periods. Bullish or bearish divergences between price and RSI (e.g., price making a new high while RSI makes a lower high) can signal weakening momentum.
MACD (Moving Average Convergence Divergence): This trend-following momentum indicator consists of the MACD line and a signal line. A bullish crossover occurs when the MACD line crosses above the signal line, suggesting increasing upward momentum. A bearish crossover is the opposite. The MACD histogram visualizes the distance between the MACD and signal lines; a growing positive histogram is bullish.
Horizontal Support and Resistance Levels: Beyond Fibonacci, historical price action creates distinct support (price floor) and resistance (price ceiling) levels. These are areas where the price has previously reversed or consolidated. Identifying these levels on daily and weekly charts provides a broader map of potential turning points.
Trendlines and Channels: Drawing trendlines connecting successive lows (uptrend line) or highs (downtrend line) helps visualize the dominant trend. Price often respects these lines. Parallel trendlines can form channels, providing dynamic support and resistance boundaries. A break out of a well-established trendline or channel can signal a significant change in trend.
Volume Analysis: Trading volume is a critical confirming indicator. A price rally accompanied by increasing volume is generally seen as healthy and sustainable. Conversely, a rally on declining volume may indicate weakening conviction. Spikes in volume during breakouts above resistance or bounces from support add validity to the price move.
Integrating these indicators with the primary observations about psychological levels, Fibonacci support, and candlestick patterns during volatile periods can provide a more robust and nuanced trading framework.
7. Risk Management in Bitcoin Trading
The high volatility inherent in BTCUSD, while offering profit potential, also necessitates stringent risk management. Without it, traders expose themselves to significant losses. Key risk management practices include:
Stop-Loss Orders: Always define an exit point for a trade if it moves against you. A stop-loss order automatically closes a position when the price reaches a predetermined level, limiting potential losses.
Position Sizing: Determine the appropriate amount of capital to allocate to a single trade based on your overall portfolio size and risk tolerance. A common rule is to risk no more than 1-2% of trading capital on any individual trade.
Risk/Reward Ratio: Before entering a trade, assess the potential profit (reward) versus the potential loss (risk). Aim for trades where the potential reward is significantly greater than the risk (e.g., 2:1 or 3:1).
Diversification: While this analysis focuses on BTCUSD, traders should consider diversifying their overall crypto portfolio if they are investors, rather than concentrating all funds in one asset.
Emotional Discipline: Avoid making trading decisions based on fear (FUD - Fear, Uncertainty, Doubt) or greed (FOMO - Fear Of Missing Out). Stick to a well-defined trading plan.
8. Potential Future Outlook (Based on Technicals)
Based on the current technical posture where Bitcoin shows strength above a key psychological level and finds support at Fibonacci retracement zones, the outlook leans cautiously optimistic, contingent on these supports holding.
Bullish Scenario: If BTCUSD continues to respect these support levels, particularly during periods of consolidation, and bullish candlestick patterns during volatile US evening/Asian morning hours lead to upward impulses, further upside is likely. A sustained break above immediate overhead resistance, confirmed by volume, could see BTCUSD challenge its next major resistance zones and potentially trend towards new highs. The ongoing defense of psychological levels is paramount for this scenario.
Bearish Scenario: Should the identified support levels (psychological and Fibonacci) fail to hold, the outlook could shift. A decisive break below these supports, especially on increased selling volume, would indicate that sellers have gained control. This could lead to a deeper correction, targeting lower support structures and potentially invalidating the current bullish sentiment. Increased volatility during the US evening/Asian morning hours could, in this case, exacerbate downward moves if bearish patterns emerge.
9. Conclusion
The technical analysis of BTCUSD reveals a market displaying notable strength, characterized by its ability to hold above a significant psychological price point and find robust support at Fibonacci retracement levels. This underlying resilience is a positive sign for bulls. The tendency for volatility to surge during the US evening and Asian morning trading sessions presents strategic windows for traders, particularly when seeking entries confirmed by validated bullish candlestick patterns at these critical support junctures.
A comprehensive trading approach should also integrate other indicators like moving averages, RSI, MACD, and volume analysis to confirm signals and understand the broader market context. While the current technical setup suggests a favorable environment for bulls, the inherent volatility of Bitcoin demands disciplined risk management practices. Traders must remain vigilant, adapting their strategies to the evolving price action and ensuring that any bullish conviction is continuously validated by the market's behavior at these key technical inflection points. The interplay between these technical elements will be crucial in determining BTCUSD's trajectory in the near to medium term.

BTC | New ATH Incoming | + 135% ??A very interesting fractal from 2021 lead to a 135% increase - and a new all time high.
Bitcoin has been following similar patterns to the bullish twin-peaks in 2021. After a multi-month correction, the price proceeded to increase another 135% over the next few months. Some weeks fast, and some weeks sideways.
Is it possible that BTC follows a similar pattern - and increase another 135%, all the way to 170k?
Hec, I'd even be happy with just a 100% ! That would lead us up to around 149k, which can also be considered a phycological resistance zone.
While you're here! Check out this post on PEPE:
_________________
BINANCE:BTCUSDT

The latest Bitcoin analysis strategyThe price has rebounded above the 0.786 Fibonacci retracement support level at $102,400. The EMA trend indicators show upward divergence, with the EMA15 fast trend line continuing to act as support and extending higher, expected to provide underlying support for the candlesticks near $101,000. A bullish channel has formed on the Bollinger Bands, but the price is 受阻 (resisted) at the upper band pressure level of $106,300, increasing the probability of short-term sideways trading.
Candlestick patterns indicate the price has consistently traded at the top of the EMA trend indicators, with bullish momentum starting to contract and top-side pressure showing a clear downward shift. The MACD has continuously reduced trading volume while approaching the zero line, with DIF and DEA converging, signaling that a top divergence pattern has spread to the medium-term trend. During the Bollinger Bands' sideways phase, the upper band resistance is at $105,200, and the lower band support is at $101,800.
The latest U.S. inflation data came in below expectations, strengthening market expectations for Federal Reserve rate cuts—a factor typically boosting risk asset performance. Additionally, the initial progress in U.S.-China trade negotiations, where both sides agreed to reduce tariffs, has improved geopolitical conditions and provided further support for Bitcoin.
you are currently struggling with losses, or are unsure which of the numerous trading strategies to follow, at this moment, you can choose to observe the operations within our channel.

BTC/USDT Scalping Opportunity – Fib & Trendline Confluence!As analyzed, BTC is sitting perfectly at the Fibonacci level combined with trendline support – a strong confluence zone for a long scalp.
📌 Entry 1: 101.8k
📌 Entry 2: 101.6k
🛡️ Stop Loss: 1hr candle close below 101.4k
🎯 Target: 300 – 1000 points
This zone has been tested and respected multiple times. We either bounce strong from here or hunt the liquidity at 100.7k before reversal. Both plans are marked in green – stay sharp!
#Bitcoin #BTCUSDT #Scalping #CryptoTrading #PriceAction #Trendline #FibStrategy

BTCUSD; Heikin Ashi IdeaBINANCE:BTCUSD
Possible continuation at marked area, or we will have a correction to lower daily demand area where impulsive move started.

Bitcoin Update – Expecting a Correction to $96K! Crypto traders! 💙 Bitcoin looks ready for a pullback to our key level at $96,000. I’m waiting to BUY in this zone, but if the level breaks and price stabilizes below, I’ll consider a SHORT trade to our next target (as previously defined).
⚡️ Pro Trading Tip:
✅ If you’re a trader, always have a strategy—be ready for any scenario!
✅ For long-term investors, accumulate on dips near support levels.
📌 Risk management is key! Double your position size at each lower level to drastically reduce your average entry price.
💎 The Golden Rule of Crypto Success:
🔹 Keep losses small & disciplined.
🔹 Let your winners run to maximize gains!
🔹 The market is unpredictable, but YOU control your capital!
🚀 Bitcoin never sleeps—what’s your play?
👇 What’s your take on this move?
For detailed entry points, trade management, and high-probability setups, follow the channel:
ForexCSP

Momentum Fades: Is Bitcoin Poised for a Pullback to Rebalance?Given the recent easing of US-China tariff tensions 🇺🇸🇨🇳, we’re observing a notable rotation of capital into equities 📈. This shift is lending strength to the US dollar 💵, which in turn has exerted downward pressure on Bitcoin’s price action. After a strong momentum-driven rally 🚀, Bitcoin is now showing early signs of weakness, suggesting a potential consolidation or a measured pullback.
With equity markets—particularly tech stocks—appearing overextended 🏦, a retracement seems likely. Since Bitcoin remains closely correlated with the tech sector, a synchronized pullback across both asset classes is a plausible scenario. I’m closely monitoring for a counter-trend opportunity, specifically eyeing a short entry should we see a decisive break in market structure 🔍.
It’s important to note that this setup is highly dependent on price action confirming the thesis as outlined in the accompanying video. If the anticipated conditions do not materialize, this trade idea will be promptly invalidated. ⚠️
Disclaimer:
This analysis is for informational purposes only and does not constitute financial advice. Trading cryptocurrencies and equities involves significant risk. Please conduct your own research and consult with a professional advisor before making any investment decisions. 📊
