No Clear Break Yet – Bounce or Bigger Correction?There haven’t been any major changes in Bitcoin’s directional structure compared to yesterday.
We saw a rebound while successfully holding the local low set during yesterday’s early morning session, and price action has followed the expected path quite well—reaching into the resistance zone and reacting accordingly.
The recent rebound from the $100,700 low may offer enough of a recovery move, but for a sustained continuation to the upside, we now need to see price hold the first support zone between $103,000 and $102,000, and ideally also preserve the second support around $101,500.
However, even if these support zones hold, failure to break previous highs could still result in another downward leg—potentially leading to a break back below $100K. This is an important scenario to keep in mind.
In short, we still need to determine whether this bounce is:
The completion of a correction wave and the start of a new uptrend
or
Just a temporary rebound before a deeper correction unfolds on the higher timeframe.
Even if we see meaningful bullish movement on the lower timeframes, it must also be confirmed across higher timeframes to be reliable. This is not a zone to hold blindly with blind optimism—whether long or short, if you’re in profit after a solid wave, consider partial profit-taking and manage your position proactively.
At the moment, the market remains in a range-bound structure, with neither the highs nor the lows broken decisively. I recommend using today’s update in conjunction with yesterday’s analysis—it will help you better understand the current structure, improve your positioning, and support your trading decisions.
Btcusdanalysis

BTCUSD; Heikin Ashi BITSTAMP:BTCUSD
Weekly time frame and divergences.
Maybe big correction after sweep of previous ATH...
It is very interesting how different methods, approaches we traders use, either to actively look for daily or weekly opportunity or longer term investment.

BTCUSD BULLISH CHART PATTERNHere I Created This BTCUSD Chart Analysis
Pair : BTCUSD (BITCOIN)
Timeframe: 15 - Minutes
Pattern: Parallel Channel
Momentum: Bullish/ Buy
Entry Level : BUY 103200
Support zone : 104800
Target Will Be : 104200
Disclaimer : This signal is based on personal analysis for learning purposes. Trade at your own risk and always use proper risk management.


#BTC Long Setup Idea – Watching Monday's LowPlan:
Will look to enter a long position if BTC sweeps Monday’s low and reclaims above with strong confirmation.
Reasoning:
• Liquidity grab below Monday’s low
• Potential bullish reversal after sweep
• Waiting for confirmation to avoid fakeouts
⚠️ Risk & Disclaimer:
• No entry without confirmation
• Use proper risk management
• Not Financial Advice – DYOR
• Trade according to your own strategy

(BTC/USD) Short Trade Setup: Key Resistance Rejection with Targe1. Entry Point: 104,855
This is where the trader plans to enter a short position (sell).
Price is slightly below this level at the moment (103,775).
2. Stop-Loss Zone: ~104,807
Highlighted in purple above the entry.
Indicates where the trader will exit if the market moves against them to limit losses.
3. Resistance Point: 103,086
This level has been tested multiple times and may act as a ceiling for prices.
If broken and held, it might invalidate the short setup.
4. Target Point: 93,159
This is the take-profit level for the short trade.
Represents a drop of approximately -10.76% from the entry point.
5. Trend Analysis:
The chart shows an uptrend leading into a potential distribution or topping pattern near the resistance zone.
A potential bearish move is anticipated, hence the short strategy.
6. Support Zones:
Highlighted in purple near the target area (around 93,159).
Historically strong buying areas.
Interpretation:
The trader expects the current resistance level to hold, prompting a downward correction toward the target zone at 93,159. If price moves above 104,807, the setup is invalidated, hence the stop-loss placement.

CME & Deribit Insights:Smart Money Takes Profits Ahead of ExpiryCME session update.
115 000$ partially closed just closed right before the price drop — someone had a piece of their options portfolio at 115,000 strike level already squared away. Safe to say it was an experienced player who got out near the top 💡
The good news: "he" still have about 2/3 of the portfolio open at that 115K strike.
The bad news: nothing’s happened yet …
But here’s what Deribit is showing us......
👀 Observation : In the May 30 options series, the highest trading volume is concentrated between 110,000–120,000 strike levels — which makes sense given the current underlying price.
But here’s the twist: this isn’t so much new positioning as it is existing players selling off . Yep — those moves were definitely noticed. Some traders are locking in profits, even though we’re still 17 days out from expiry .
Overall, classic playbook:
Smart money lightens the load , while the not-so-smart money tries to pick up the pieces.
(Though let’s be honest — there’s way less "dumb money" in options than in spot markets 😉)
💡 Sentiment remains Bullish, but correction is prevailing at the moment!
🎯 No Valuable Data, No Edge!

BTC at Critical DP: Rising Wedge Breakdown or Bounce?!Hello guys!
1. Bearish Breakdown (Primary Setup):
If price breaks below the rising wedge support and sweeps the recent low, it confirms the breakdown.
This would be a strong signal to enter short positions, with a downside target around the 99,000–98,500 zone.
Breakdown confirmation: Close below both wedge support and the horizontal support from the previous swing low.
2. Bullish Bounce (Alternative Setup):
If price respects the wedge support and shows bullish momentum (e.g., strong wick rejections or bullish engulfing candle), the wedge may invalidate.
In this case, look for long opportunities targeting the upper wedge boundary and possibly higher resistance zones beyond 104,000.
📌 Strategy Summary:
🔻 Breakdown = SHORT to target area (below 100K)
🔺 Support holds = LONG toward 104K+
Risk management is crucial here, as the pattern is at a tipping point. Wait for a clear breakout or bounce before entering a position.

BTC longterm overviewIt seems that we have around 4 months to the end of this bull-run and Bitcoin top.
-------------------------------------
Share and follow me for further analyses.

BTC on daily timeframe
"Hello traders, focusing on BTC on high timeframes, the price is currently in a mitigated Order Block (OB). This level often acts as a trap, and historically, after reaching this level, the price does not show strong signals for rejection. Therefore, I anticipate a higher price movement, with the initial target potentially being $120,000."
If you need further assistance or have any specific questions, feel free to let me know!

BTC Breakdown Alert: Key Support Levels in FocusDescription
#BTC If we break below the grey support zone, expect a potential move down toward the highlighted purple demand area. Watch for reaction at the grey box to determine bearish continuation or support bounce.

BTCUSDT - at support? Holds or not ??#BTCUSDT - so far that was a perfect holdings of our upside region and market just reached at his first supporting area that is around 101600
Keep close it because if market slip below that then next it can drop towards downside further areas as mentioned on chart.
Keep close n stay sharp.
Good luck
Trade wisely

BTCUSD FALLING WEDGE PATTERNHere I Created This BTCUSD Chart Analysis
Pair : BTCUSD (Bitcoin)
Timeframe: 15- Minutes
Pattern: Falling wedge
Momentum: Bearish/ SELL
Entry Level : SELL 104000
Resistance zone : 104100
Target Will Be : 102800
Disclaimer : This signal is based on personal analysis for learning purposes. Trade at your own risk and always use proper risk management.

BTC Crossroads: Will Tariff News Trigger a Counter-Trend Move?Given the recent easing of US-China tariff tensions, Bitcoin may consolidate or experience a slight pullback as capital rotates into equities. The resulting strength in the US dollar could further contribute to a Bitcoin retracement. I'm watching for a potential counter-trend setup, specifically a short entry on a break of market structure. However, this scenario is contingent on the price action unfolding as described in the video; otherwise, the idea will be invalidated.
Not financial advice.

BTC - 180k topBTC - Local bottom was around 74k, now heading towards 180k which will be the top for this cycle.
74 – – – - – – 54 bottom.

#BTC/USDT Bullish Crossover in Play!CRYPTOCAP:BTC Update: Bitcoin is currently holding support and showing signs of strength with a bullish EMA crossover — the 50 EMA crossing above the 100 EMA, which historically signals upward momentum based on past fractals.
The lower support zone is marked in blue, in case the price dips further.
Immediate resistance remains at the GETTEX:98K level — a confirmed close above this could trigger a move toward $103K.
Stay tuned for more real-time updates.
Do hit the like button if you like it, and share your views in the comments section.
Thank you
SHARE THE IDEA ABOUT BTCUSD BEARISH PATTERNCurrent Market Overview:
Price Action: Bitcoin has rallied approximately 40% from its April lows, reaching a high near $105,525 today.
Support Levels: Key support is identified around $100,000, with additional support near $92,000.
Resistance Levels: Immediate resistance is observed around $107,000, with a potential upside target near $120,000 if bullish momentum continues.
Bearish Pattern Analysis:
While the broader trend remains bullish, certain patterns indicate possible short-term bearish movements:
Head and Shoulders Formation: Some analysts have noted a potential head and shoulders pattern forming, which could signal a reversal if confirmed.
Momentum Indicators: The Relative Strength Index (RSI) is above 70, suggesting overbought conditions that might precede a pullback.

$BTC go to 142000🪙 Bitcoin Analysis - Daily Timeframe
🚀 Entry Point:
The ideal buy entry is at $96,302, where we have a confluence of the 0.618 Fibonacci level, FVG, and a Breaker Block. This zone could trigger buy orders and potentially push Bitcoin towards the first target at its previous all-time high of $109,000, and ultimately to the final target at $142,650.
🔴 Critical Support:
The current support level is $93,947.
If a daily candle closes below this level, a bearish structure will form, opening the door for further decline to the next support at $85,000.
💡 Trading Signal: ❤️
Buy Limit: $96,302
Stop Loss: $93,347
Take Profit Targets: $109,000 - $142,000
🔵 Risk Management:
Risk only 1% of your capital in this trade.
Adjust margin size so that in case the stop loss is hit, your account loss will not exceed 1%.
This is a Swing Trade setup. Stay disciplined and manage your risk effectively. ✅

Update! $BTC range Bound... Consolidation? Breakout? Breakdown? CRYPTOCAP:BTC appears to have formed a range: between approximately between 76800 and 104,300
Current price: 104300
Here are the key observations:
Key resistance zone is around 104300 - Price has tested this level multiple times but failed to close above it decisively.
Clear to say that A break above which will lead to All time highs possibly up to 135k
If #BTC Bitcoin continues to reject this level then expect these layers of support to be tested:
97700 and then 91100
CRYPTOCAP:BTC remains bullish if prices remains above 91100. Further break down will lead to bottom of range 84100 and 76800 (coinciding with 200 EMA )
Trading Implications:
For Longs: Avoid new positions unless there's a breakout with volume above $105,000.
For Shorts: This is a possible scalp opportunity near the top of the range, with a stop slightly above $105,000.
Not financial Advice!

Bitcoin blows up the market: $100,000 broken.Bitcoin (BTCUSD) surged past the key $100,000 mark again on Thursday, May 8, 2025 — for the first time since February this year. During the day, BTC traded between $101,500 and $102,700, posting a daily gain of around 5.3%. Its market capitalization exceeded $2 trillion.
Why Bitcoin is back at $100K — and what’s driving it higher:
Macro tailwinds:
Growing expectations of Fed rate cuts , reinforced by Donald Trump’s calls for lower interest rates, have fueled risk appetite across markets — Bitcoin included.
US – UK trade deal hype : Hints of a potential trade agreement between the US and the UK announced by President Trump added a major boost to market sentiment, sparking a rally.
Institutional demand : Massive inflows into US spot Bitcoin ETFs continue. Over $1.8 billion flowed in last week alone, with some sources reporting $2.68 billion by Thursday — the largest weekly inflow since mid-December 2024. Companies like MicroStrategy are leading the charge with more BTC purchases.
Weaker dollar & falling bond yields : These trends have enhanced Bitcoin’s appeal as a hedge.
Market sentiment & BTC dominance : Breaking above $100K triggered optimism and possible FOMO (fear of missing out). Bitcoin’s market dominance now exceeds 60%, the highest since early 2021, reflecting investor preference for BTC over altcoins in the current phase.
The appointment of Paul Atkins as SEC Chair , along with a softer US regulatory stance and Arizona’s new pro-crypto law, are setting the stage for continued growth.
FreshForex analysts note that the current rally is mainly driven by institutional players, while retail investors have yet to fully engage.

Bitcoin BTC Is Entering Into CorrectionHello, Skyrexians!
I got a lot of comments to analyze BINANCE:BTCUSDT because it has almost reached ATH and people don't understand what is happening. In my opinion last pain ahead and after that likely we see great gains.
Let's take a look at 4h time frame. We can finally notice the full 5 waves cycle which is likely to be finished. If you remember my recent analysis this is just the wave 1 inside higher degree wave 3. Awesome Oscillator has printed divergence, so there is a great chance that correction has been already started. The target for this correction is 0.5 Fibonacci at $90k. I don't recommend you to short this move if you are not experienced because this is trade against the trend.
Best regards,
Ivan Skyrexio
___________________________________________________________
Please, boost this article and subscribe our page if you like analysis!

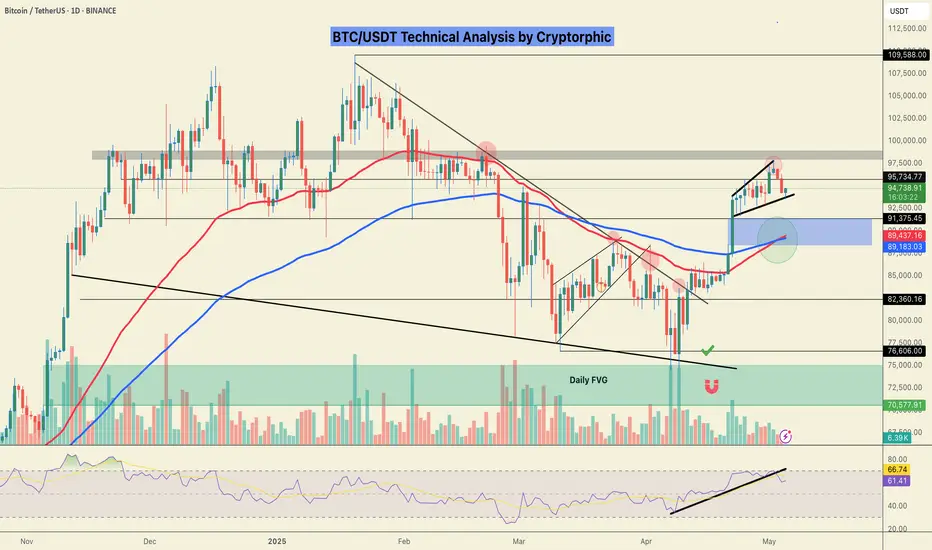
DeGRAM | BTCUSD ended the period below 100k?📊 Technical Analysis
● Price rocketed out of the $91 300 demand zone, snapping the 6‑month descending trend and converting the $99 500 former cap into support.
● A tight bull pennant is forming just above that level; a decisive break targets the marked resistance level/supply band at $108 000. Long bias void below $93 300.
💡 Fundamental Analysis
● U.S. Treasury’s plan to boost quarterly bill issuance is flattening real yields and lifting non‑yielding assets.
● Hong Kong’s new spot‑BTC ETFs amassed >$500 M AUM in two weeks, signalling fresh Asia‑Pacific demand and tightening offshore float.
✨ Summary
Pennant continuation above new support and expanding Asian ETF inflows argue for a push from $99.5 K to $108 K; protect longs if price closes under $93.3 K.
-------------------
Share your opinion in the comments and support the idea with a like. Thanks for your support!

