TOTAL 2 ANALYSEThe longer BTC dominance continues to decline, the more likely it is that Total 2 will break through key resistance levels.
For now, I’m anticipating a retest of the highlighted area, which would support a logical continuation to the upside, in line with the H4 analysis on BTC dominance.
Btcusdanalysis

Bitcoin Btc usdt Daily analysis
Time frame daily
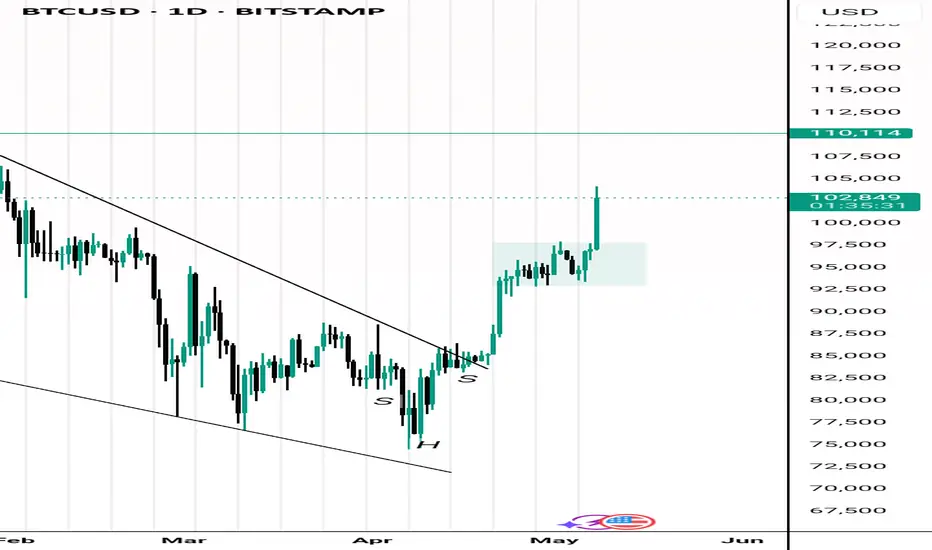
As you can see byc is moving up and down in the green tunnel
My last target (yellow rectangle) is touched and byc couldn't break the upper side of tunnel
Now, my target is 120.000 $ ( red rectangle)
If this time , btc can break the green uptrend line as resistance line , my next target is 145.000$,
👉👉Important notice 👈👈
Here is not suitable Time for entry the long or short position because btc is in the middle of the tunnel

BTCUSDT: Safe Zone Vs Risk Zone, Which one would you choose? Dear Traders,
WE have possible buying opportunities, with the first entry, the only reason that we think that price would reverse is, possible end of year bullish push which may take price to another record higher high. Although, since the price already has rejected we think price is unlikely to reject at the level, and may drop to 75k region.
good luck.

Dominance BTCHere’s something interesting on the 4H chart.
We can clearly see that BTC dominance has broken its bullish structure. A retest around 64.50% is likely, followed by a potential 2.60% drop toward 62.50%.

#BTCUSDT: Will Bitcoin Make Any Correction To $90,000?Hey Everyone,
Happy Sunday
Currently, Bitcoin’s price is consolidating within a shorter timeframe, which has heightened the likelihood of it reaching the $90,000 ‘FVG’ region. However, this could be attributed to the hectic week we experienced, with numerous significant market announcements that have heightened uncertainty in the cryptocurrency market. At present, there are two opportunities for Bitcoin: one is riskier, while the other is considerably safer. You can utilise this analysis as a secondary bias.
We extend our best wishes and good luck in your trading endeavours. Your unwavering support is greatly appreciated.
If you wish to contribute, here are several ways you can assist us:
- Like our ideas
- Comment on our ideas
- Share our ideas
Team Setupsfx_🚀❤️

Bitcoin: Blood in the Streets – Now is the Time!Once again, there’s blood in the streets—and from this point on I start scaling into spot positions again, slowly but deliberately.
All of these are spot entries with soft stop-losses—not hard exits, but areas I’ll react to if needed.
So why now? For one, we’re sitting right above the 38,2% Fibonacci level for the ending of the wave A. At the same time, we’re about to tap into a daily Fair Value Gap, while trying to hold the range support—two important technical levels lining up on the higher time frame.
Below that, we have an untapped VWAP at $65.5K, which could act as a magnet, as it often does. And yeah—if we go under $62K or even $60K, the classic “time to work at McDonald’s” joke comes back. But seriously: in markets like this, you need to stay calm, have some humor, and most of all, know what’s possible.
So I’m cautiously watching the S&P 500 closely, which plays a big role in this setup for me.
That’s where I stand on BTC right now—careful optimism, grounded in context and reasoning for me.

BTC OutlookPotential Move Toward 140K in the Long-Term Channel Expansion
BTC is currently trading inside an expanding ascending channel.
From my perspective, price is currently pushing toward a new local high, and there’s a strong probability we see continuation toward the 140K region in the mid-to-long term – assuming no major shift in macro or market sentiment.
Note: This is not financial advice. Always manage your risk and trade based on your own strategy.

BTC Overextended: Awaiting the Perfect Pullback for a BuYBTC/USDT Analysis – 1D Timeframe
Bitcoin is currently looking overextended on the daily chart 📈, with price action pushing directly into a well-defined key resistance level 🚧. This area has historically acted as a strong supply zone, and with momentum appearing stretched, I’m anticipating a potential retracement in the near term.
My plan is to wait for BTC to pull back towards previous support zones Around the 61.8 Fibo level🛡️. I have a clear Point of Interest (POI) marked out, where I’ll be watching for price to react. If we see a bullish Break of Structure (BOS) on the pullback—I’ll be looking for a long entry from this area 🎯.
Key Levels to Watch:
Resistance: Current daily highs (where price is overextended) 🚩
Support/POI: Previous consolidation and demand zones below, which have shown strong buying interest in the past 🏦
Trade Plan:
- No FOMO entries at resistance! ❌
- Wait for a clean retrace into my POI
- Look for bullish confirmation (BOS) on lower timeframes before entering long ✅
- Manage risk accordingly and trail stops if the move plays out
Summary:
Patience is key here. I’m not interested in chasing price into resistance. Instead, I’ll let the market come to me and only act if my criteria are met. If BTC gives us the pullback and a bullish BoS, I’ll be ready to take the trade. Until then, I’m on the sidelines and monitoring price action closely 👀.
Disclaimer:
This analysis is for educational purposes only and does not constitute financial advice. Always do your own research and manage your risk appropriately. Trading cryptocurrencies involves significant risk and may not be suitable for all investors. 🚨

Bitcoin Hits $100K: Bull Run IgnitesWhat Tariff Shock? Bitcoin Surges Past $100K as Market Recovery Continues
The cryptocurrency market has been making headlines again as Bitcoin (BTC) surges past the $100,000 mark, signaling a robust recovery and potentially the start of a new bull cycle. In an environment marked by economic uncertainty, geopolitical tensions, and fluctuating central bank policies, Bitcoin’s remarkable resurgence has captured the attention of retail investors, institutional participants, and financial analysts alike.
This article delves into multiple facets of Bitcoin’s ongoing rally, including its recent rebound after a sharp drop, the role of whales in fueling the push toward $100K, the realized cap hitting a record high, and whether aggressive profit-taking by investors signifies a local top. Additionally, we’ll explore the implications of Bitcoin's return to $100K and why it hints at a "significant price move" that could shape the broader financial landscape.
________________________________________
Bitcoin Rebounds After Sharp Decline: The $100K Push
Bitcoin’s journey to $100,000 has been anything but smooth. After experiencing a sharp correction earlier in the year, many market participants feared that the cryptocurrency's bull run was over. However, Bitcoin's ability to rebound from its lows with renewed vigor has defied expectations.
Whales Drive the Rally
One key factor behind Bitcoin’s resurgence is the activity of "whales," large-scale investors who hold significant amounts of BTC. On-chain data reveals that whales have been accumulating Bitcoin during periods of lower prices, effectively acting as a stabilizing force during market downturns. By reducing liquidity in the market and concentrating their holdings, whales have created conditions conducive to a price surge.
In addition, whale wallets have been observed transferring large sums of Bitcoin out of exchanges and into cold storage, signaling a long-term bullish outlook. This withdrawal pattern reduces the supply of Bitcoin available for trading, increasing upward pressure on the price.
________________________________________
Realized Cap Hits Record High: A Bullish Signal
Another notable development supporting Bitcoin's rally is its realized capitalization (realized cap) hitting an all-time high. Unlike market capitalization, which multiplies the total supply of Bitcoin by the current price, the realized cap calculates the value of each Bitcoin at the price it was last moved. This metric provides a clearer picture of the aggregate cost basis of Bitcoin holders.
The realized cap reaching a record high indicates that a significant portion of Bitcoin has changed hands at higher price levels, reflecting increased investor confidence. This metric aligns with the narrative of accumulation, as both retail and institutional investors appear to be buying Bitcoin at higher prices in anticipation of future gains.
Accumulation Continues
On-chain analytics reveal that accumulation trends have persisted throughout Bitcoin's recovery. Wallet addresses holding between 1 and 10 BTC have grown substantially, showing that smaller investors are also entering the market. This broad-based accumulation not only adds to Bitcoin's bullish momentum but also reduces volatility by distributing supply across a wider range of participants.
________________________________________
Profit-Taking and Local Top Concerns
While Bitcoin's surge past $100,000 has been met with enthusiasm, some analysts caution that aggressive profit-taking by investors could signal a local top. Short-term holders, in particular, have been selling their Bitcoin to lock in gains, as evidenced by the increasing Spent Output Profit Ratio (SOPR).
Signs of a Local Top?
A high SOPR indicates that investors are realizing profits at a significant rate, which often coincides with price corrections. However, it’s important to note that profit-taking is a natural part of any market cycle and does not necessarily signal the end of a bull run. In fact, periods of consolidation and minor corrections can strengthen the foundation for a more sustainable rally.
Market sentiment, as measured by the Fear & Greed Index, has also entered the "Greed" zone, suggesting that bullish enthusiasm may be running high. Historically, extreme greed has preceded short-term pullbacks, making it crucial for investors to remain cautious.
________________________________________
New Bull Cycle? Bitcoin’s Return to $100K Hints at Significant Price Move
Bitcoin’s return to the $100,000 milestone has rekindled hopes of a new bull cycle, with analysts pointing to several factors that support this narrative. The cryptocurrency market has historically moved in cycles, driven by supply-demand dynamics, macroeconomic conditions, and technological advancements. The current environment appears to align with the early stages of a new bull phase.
Institutional Adoption and Macro Tailwinds
Institutional interest in Bitcoin has grown exponentially over the past few years. Major financial institutions, including hedge funds, pension funds, and publicly traded companies, have embraced Bitcoin as a hedge against inflation and a store of value. This influx of institutional capital has not only validated Bitcoin’s role as a legitimate asset class but also provided a steady source of demand.
Moreover, macroeconomic tailwinds such as high inflation, declining confidence in fiat currencies, and geopolitical instability have enhanced Bitcoin's appeal as a decentralized, non-sovereign asset. Central banks’ monetary policies, including quantitative easing and low interest rates, have further eroded the purchasing power of traditional currencies, driving investors toward Bitcoin.
Supply Shock and Halving Cycles
Bitcoin’s fixed supply of 21 million coins and its halving cycles play a crucial role in its price dynamics. The most recent halving in 2024 reduced the block reward for miners, effectively decreasing the rate at which new Bitcoin enters circulation. This supply shock, coupled with growing demand, has historically preceded significant price rallies.
On-chain data shows that long-term holders, who typically accumulate Bitcoin during bear markets, are now distributing their holdings during this bull phase. This redistribution of supply suggests that a new wave of investors is entering the market, further fueling the rally.
________________________________________
What’s Next for Bitcoin?
As Bitcoin continues to defy expectations, the question on everyone’s mind is: What’s next? While predicting Bitcoin’s price movements with precision is challenging, several scenarios could play out in the near term.
Scenario 1: Sustained Bull Run
If accumulation trends persist and institutional interest continues to grow, Bitcoin could maintain its upward trajectory, potentially reaching new all-time highs. Key resistance levels to watch include $120,000 and $150,000, which could serve as psychological barriers for further price appreciation.
Scenario 2: Short-Term Correction
A short-term correction is always a possibility, especially given the aggressive profit-taking observed in recent weeks. However, such corrections are often healthy for the market, allowing for consolidation and setting the stage for more sustainable growth.
Scenario 3: Macro-Driven Volatility
External factors, such as changes in monetary policy, regulatory developments, or geopolitical events, could introduce volatility to the market. While Bitcoin has shown resilience in the face of macroeconomic challenges, it remains sensitive to major news events.
________________________________________
Conclusion
Bitcoin’s surge past $100,000 marks a pivotal moment for the cryptocurrency market, signaling a robust recovery and the potential start of a new bull cycle. Driven by whale activity, record-high realized capitalization, and persistent accumulation, Bitcoin has defied skeptics and reasserted its dominance as the leading digital asset.
While concerns about a local top and profit-taking are valid, the broader trends suggest that Bitcoin is preparing for a significant price move. Whether this rally leads to sustained growth or faces temporary setbacks, one thing is clear: Bitcoin remains a transformative force in the financial world, offering a decentralized, inflation-resistant alternative to traditional assets.
As we look ahead, the combination of institutional adoption, macroeconomic tailwinds, and Bitcoin’s unique monetary policy positions it for continued success. For investors and enthusiasts, the journey to $100,000 and beyond is more than just a milestone—it’s a testament to the enduring promise of blockchain technology and the future of decentralized finance.

Bitcoin bullish rsi can lead to 133kbitcoin can lead to 133k without any stop as bullish convergence and diversion has been identified with RSI above 50 there is no stopping.
MA & EMA BOTH ARE SHOWING GOLDEN CROSS OVER .
Probable higher high ,lower low pattern can form for more push to 200k

Bitcoin – Price Hits $100KThe current price of Bitcoin has soared all the way, breaking the 100,000 mark. Thumzup, a listed company on the US stock market, has announced its plan to raise up to $500 million for its Bitcoin acquisition strategy. Metaplanet, a listed company in Japan, has once again spent $53.4 million to increase its holdings of 555 Bitcoins. In addition, New Hampshire has become the first state in the United States to pass the Strategic Bitcoin Reserve Act, authorizing the state's treasurer to hold Bitcoins in a regulated reserve structure. This has led some local governments to regard Bitcoin as a strategic reserve asset with long-term value. The Federal Reserve has announced that it will maintain the benchmark interest rate at 4.25%-4.50%, which is in line with market expectations. Moreover, the Federal Reserve's meeting minutes imply that interest rates may start to be cut in July, and the market has reacted optimistically to this, to a certain extent, driving up the prices of cryptocurrencies such as Bitcoin.
you are currently struggling with losses, or are unsure which of the numerous trading strategies to follow, at this moment, you can choose to observe the operations within our channel.
Trading Strategy:
sell@101500-102000
TP:97500-98000

$BTC Finally $100K Surprised and Take Profit Done✨ CRYPTOCAP:BTC Surprise Finally Touch $100K Milestone again, All Take Profit and bonus Done.
💫 From Breaking News:
• Arizona Bitcoin Bill: Crucial SB 1373 Advances for State Bitcoin Reserve
• New Hampshire Becomes First to Approve Bitcoin Reserve—Will Other States Follow?
First introduced in January, HB 302, gives officials the ability to allocate state funds to both precious metals, and specific digital assets with a market capitalization of over $500 billion. That means Bitcoin, which, as of this writing, has a market cap of roughly $1.9 trillion per TradingView, is a prime candidate.
The newly enacted law states that any digital assets obtained must be kept using high security custody protocols. This can be done directly in a state managed multisignature wallet, via a qualified financial institution custody, or by investment in U.S. regulated exchange traded products (ETPs). Dennis Porter, CEO and Co-Founder of Satoshi Action, said:
“Satoshi Action drafted the model, New Hampshire engraved it into law, and now every treasurer nationwide can follow that roadmap. HB 302 proves you can protect taxpayer money, diversify reserves, and future-proof state treasuries all while embracing the most secure monetary network on Earth. New Hampshire didn’t just pass a bill; it sparked a movement.”
#Write2Earn #BTC #BinanceSquareFamily #MarketRebound #SUBROOFFICIAL
Disclaimer: This article is for informational purposes only and does not constitute financial advice. Always conduct your own research before making any investment decisions. Digital asset prices are subject to high market risk and price volatility. The value of your investment may go down or up, and you may not get back the amount invested.

DeGRAM | BTCUSD is continuing to rise📊 Technical Analysis
● Breakout above a multi-month triangle cleared the $95–98K zone. The price approached the long-term resistance line, steering price toward $108K.
💡 Fundamental Analysis
● Strategy bought 1,895 BTC and Semler Scientific added 167 BTC, marking a surge in corporate buying.
● Arizona passed legislation to invest up to 10% of $31.5B state assets in Bitcoin.
● New Hampshire governor signs crypto reserve bill into law.
● Metaplanet reaches 5,555 Bitcoin milestone with latest 555 BTC buy.
✨ Summary
Bullish breakout confirmed. Key levels: ~ GETTEX:92K support, ~$93–95K resistance, and $108K target. Strong institutional/state buying underpins the uptrend.
-------------------
Share your opinion in the comments and support the idea with a like. Thanks for your support!

BTC Fractal Update!!CRYPTOCAP:BTC is repeating the same ABC pattern that led to past 70 %+ rallies.
We're now at a decision point — next weekly close will confirm:
Scenario 1: Rejection Below $96K (Circle 1)
→ Likely dip to $78K–$80.5K (channel bottom + 0.5 Fib)
→ Final shakeout before major move.
Scenario 2: Breakout Above $96K (Circle 2)
→ Retest at $90.5K
→ Then rally toward $160K+ begins (Circle 3)
BTC is hovering near the $100K mark — up 5% from the $96K breakout — mirroring the previous breakout from $63K (Circle 2), where it surged to $ 67K (+5%) before a sharp retest to $59.2K, followed by a major rally.
A similar healthy retest could be on the cards before CRYPTOCAP:BTC breaks its ATH!
If you find this analysis helpful, please hit the like button to support my content! Share your thoughts in the comments, and feel free to request any specific chart analysis you’d like to see.
Happy Trading!!

BTC LONG TP:99,500 03-05-2025🚀 Continuation in motion!
We’re going LONG toward 99,500, with the 2H timeframe showing clear bullish continuation 📈
Entry zone sits between 95,500 and 94,200 — solid range to average in smart.
This move should play out within 17 to 30 hours, so precision matters ⏳
We’re seeing acceleration in bullish momentum, and this could be the final spike pushing BTC to 107–108k in the coming week.
Don’t miss the ride. Follow me for updates and let’s lock in those gains together 💰🔥

BTCUSDTSecond trade of the day is on BTCUSDT — and I’ve already entered the position.
I’ve set the Risk-to-Reward Ratio to 1:1 this time, as I entered with a higher lot size than usual.
🔍 Criteria:
✔️ Timeframe: 15M
✔️ Risk-to-Reward Ratio: 1:1
✔️ Trade Direction: Buy
✔️ Entry Price: 98,835.27
✔️ Take Profit: 99,320.67
✔️ Stop Loss: 98,347.72

BTC LIMITHello friends
Due to the price drop, we can buy in the price drop and move with it to the specified targets, of course with capital and risk management.
*Trade safely with us*

btc on bullish#BTCUSD now above the third pattern, price is expected to continue bullish from 98150.
Above and 2 times breakout at 97326 will take the price above 98150, stop loss 96781.
Above 98150 have bullish formation which will target 100k, any reverse below 96781 will retrace bullish back.

Bitcoin Parabolic Curve - 2022 to 2026 Market CycleThis line chart shows the current Bitcoin market cycle from the bear market bottom in November 2022. As you can see, the price has formed a parabolic curve, which was violated around the beginning of March. A couple of weeks later, there was a retest of the curve, which was rejected. The price of BTC has since returned to the bottom side of the curve and is following it upwards.
I am also watching the Bitcoin monthly chart and, more specifically, the monthly Stochastic RSI indicator. As you can see in the chart below, between the second and third months after the market cycle peak, the Stochastic RSI indicator has always dropped below the "20" level, and was near zero at the close of the third month.
There was some speculation that the new all-time high set on January 20th at just over $109k was the peak for this market cycle. At the beginning of April, the Stochastic RSI dropped well below the 20 level but rebounded and was at 16.81 when the April candle closed. One week into May, the Stochastic RSI has pushed back above the 20 level and currently sits at 26.38.
I am still keeping an open mind, but if the high set on January 20th were the market cycle peak, based on past history, I would have expected the Stochastic RSI to have been much lower at the close of April. If the May candle closes with the Stochastic RSI above the 20 level, it will give me much more confidence that Bitcoin has not peaked for this market cycle.
My assumption for now is that Bitcoin is still following a 4-year market cycle. If this is true, I would expect a market cycle peak sometime in the final months of this year. Either way, it has been a very interesting market cycle with huge changes for the crypto asset class.

Bitcoin Dominance - the two scenarios!Bitcoin dominance continues to rise after breaking out of a rising wedge pattern on the weekly chart. It has now also broken through the 0.786 Fibonacci level.
Next stop is Rectangle 1, where Bitcoin dominance is expected to reach 68% — and most likely, this will mark the top of dominance before it starts to drop, triggering a historic altcoin season.
Scenario 2:
Dominance keeps pushing higher toward Rectangle 2, potentially surpassing 70%. At that point, many altcoins may form new lows, and weak projects could get wiped out.
Fear in the market will hit extreme levels —
but that could signal the beginning of an altseason and the collapse of BTC dominance.
Best regards Ceciliones 🎯

BTC/USD) bullish trend analysis Read The ChaptianSMC Trading point update
Technical(BTC/USDT) analysis outlines a bullish outlook with key technical levels and scenarios. Here's a breakdown of the idea:
Key Observations:
1. Trend Break and CHoCH (Change of Character):
The chart shows a clear break of the downtrend, confirmed by the CHoCH label — a common Smart Money Concept (SMC) signal indicating a potential trend reversal from bearish to bullish.
2. Key Zones Highlighted:
EVC-Buying Zone: Around 86,000 – 88,000 (aligned with EMA 200), marked as a strong accumulation area.
New Support Level: Around 92,000 – 93,000, potentially forming a bullish support after the recent rally.
Resistance Levels: Two major resistance zones near:
99,600 (intermediate resistance and target)
106,400 (final target)
3. RSI Indicator:
RSI is near 64, indicating strong momentum but not yet overbought — a potential sign of further upside.
4. Two Bullish Scenarios:
Scenario 1 (Aggressive Bullish): BTC continues upward from the current level and breaks above resistance toward the 106,447 target.
Scenario 2 (Retracement Bullish): BTC dips to the new support or even into the buying zone (86–88k), then rebounds to reach the same targets.
Mr SMC Trading point
---
Idea Summary:
The chart suggests bullish continuation, with potential pullbacks into strong demand zones. It supports both breakout and retracement entries, with targets at 99,632 and 106,447. If price holds above EMA 200 and RSI remains supportive, the upside thesis remains valid.
Pales support boost 🚀 analysis follow)

DeGRAM | BTCUSD Holds the Accumulation Zone📊 Technical Analysis
● BTC rebounded off rising‐channel boundary and has formed a base in the $93K–95.3K accumulation zone. A decisive break above ~$95,700 would confirm a fresh leg to $98,000.
● Higher lows and tightening range signal building bullish pressure for an impulsive move toward the channel top.
💡 Fundamental Analysis
● Spot BTC ETFs logged ~$675 M of net inflows on May 2.
✨ Summary
Rising‐channel support + sustained ETF demand favor a short‐term long bias: targets GETTEX:98K → $100K; view invalidated below $91,500.
-------------------
Share your opinion in the comments and support the idea with a like. Thanks for your support!
