Bitcoin bullish rsi can lead to 133kbitcoin can lead to 133k without any stop as bullish convergence and diversion has been identified with RSI above 50 there is no stopping.
MA & EMA BOTH ARE SHOWING GOLDEN CROSS OVER .
Probable higher high ,lower low pattern can form for more push to 200k
Btcusdanalysis

Bitcoin – Price Hits $100KThe current price of Bitcoin has soared all the way, breaking the 100,000 mark. Thumzup, a listed company on the US stock market, has announced its plan to raise up to $500 million for its Bitcoin acquisition strategy. Metaplanet, a listed company in Japan, has once again spent $53.4 million to increase its holdings of 555 Bitcoins. In addition, New Hampshire has become the first state in the United States to pass the Strategic Bitcoin Reserve Act, authorizing the state's treasurer to hold Bitcoins in a regulated reserve structure. This has led some local governments to regard Bitcoin as a strategic reserve asset with long-term value. The Federal Reserve has announced that it will maintain the benchmark interest rate at 4.25%-4.50%, which is in line with market expectations. Moreover, the Federal Reserve's meeting minutes imply that interest rates may start to be cut in July, and the market has reacted optimistically to this, to a certain extent, driving up the prices of cryptocurrencies such as Bitcoin.
you are currently struggling with losses, or are unsure which of the numerous trading strategies to follow, at this moment, you can choose to observe the operations within our channel.
Trading Strategy:
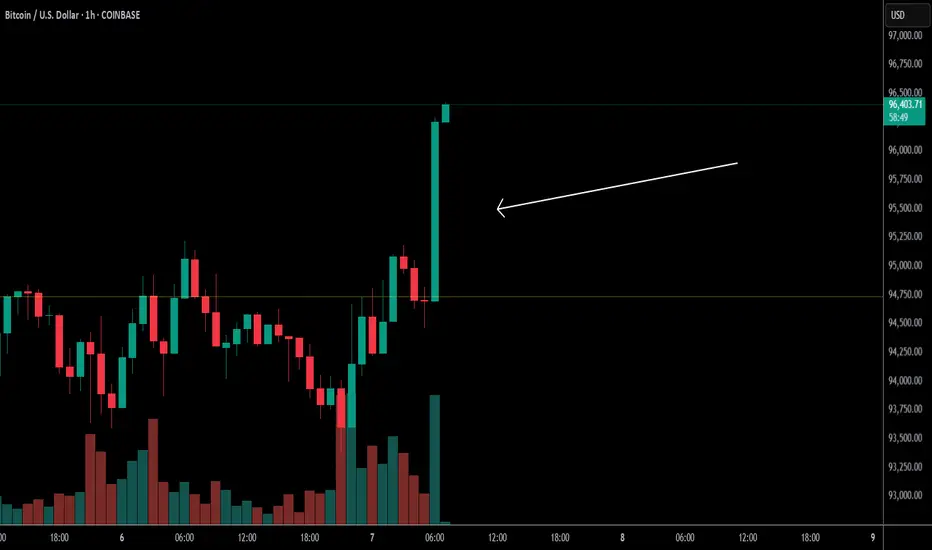
sell@101500-102000
TP:97500-98000

$BTC Finally $100K Surprised and Take Profit Done✨ CRYPTOCAP:BTC Surprise Finally Touch $100K Milestone again, All Take Profit and bonus Done.
💫 From Breaking News:
• Arizona Bitcoin Bill: Crucial SB 1373 Advances for State Bitcoin Reserve
• New Hampshire Becomes First to Approve Bitcoin Reserve—Will Other States Follow?
First introduced in January, HB 302, gives officials the ability to allocate state funds to both precious metals, and specific digital assets with a market capitalization of over $500 billion. That means Bitcoin, which, as of this writing, has a market cap of roughly $1.9 trillion per TradingView, is a prime candidate.
The newly enacted law states that any digital assets obtained must be kept using high security custody protocols. This can be done directly in a state managed multisignature wallet, via a qualified financial institution custody, or by investment in U.S. regulated exchange traded products (ETPs). Dennis Porter, CEO and Co-Founder of Satoshi Action, said:
“Satoshi Action drafted the model, New Hampshire engraved it into law, and now every treasurer nationwide can follow that roadmap. HB 302 proves you can protect taxpayer money, diversify reserves, and future-proof state treasuries all while embracing the most secure monetary network on Earth. New Hampshire didn’t just pass a bill; it sparked a movement.”
#Write2Earn #BTC #BinanceSquareFamily #MarketRebound #SUBROOFFICIAL
Disclaimer: This article is for informational purposes only and does not constitute financial advice. Always conduct your own research before making any investment decisions. Digital asset prices are subject to high market risk and price volatility. The value of your investment may go down or up, and you may not get back the amount invested.

DeGRAM | BTCUSD is continuing to rise📊 Technical Analysis
● Breakout above a multi-month triangle cleared the $95–98K zone. The price approached the long-term resistance line, steering price toward $108K.
💡 Fundamental Analysis
● Strategy bought 1,895 BTC and Semler Scientific added 167 BTC, marking a surge in corporate buying.
● Arizona passed legislation to invest up to 10% of $31.5B state assets in Bitcoin.
● New Hampshire governor signs crypto reserve bill into law.
● Metaplanet reaches 5,555 Bitcoin milestone with latest 555 BTC buy.
✨ Summary
Bullish breakout confirmed. Key levels: ~ GETTEX:92K support, ~$93–95K resistance, and $108K target. Strong institutional/state buying underpins the uptrend.
-------------------
Share your opinion in the comments and support the idea with a like. Thanks for your support!

BTC Fractal Update!!CRYPTOCAP:BTC is repeating the same ABC pattern that led to past 70 %+ rallies.
We're now at a decision point — next weekly close will confirm:
Scenario 1: Rejection Below $96K (Circle 1)
→ Likely dip to $78K–$80.5K (channel bottom + 0.5 Fib)
→ Final shakeout before major move.
Scenario 2: Breakout Above $96K (Circle 2)
→ Retest at $90.5K
→ Then rally toward $160K+ begins (Circle 3)
BTC is hovering near the $100K mark — up 5% from the $96K breakout — mirroring the previous breakout from $63K (Circle 2), where it surged to $ 67K (+5%) before a sharp retest to $59.2K, followed by a major rally.
A similar healthy retest could be on the cards before CRYPTOCAP:BTC breaks its ATH!
If you find this analysis helpful, please hit the like button to support my content! Share your thoughts in the comments, and feel free to request any specific chart analysis you’d like to see.
Happy Trading!!

BTC LONG TP:99,500 03-05-2025🚀 Continuation in motion!
We’re going LONG toward 99,500, with the 2H timeframe showing clear bullish continuation 📈
Entry zone sits between 95,500 and 94,200 — solid range to average in smart.
This move should play out within 17 to 30 hours, so precision matters ⏳
We’re seeing acceleration in bullish momentum, and this could be the final spike pushing BTC to 107–108k in the coming week.
Don’t miss the ride. Follow me for updates and let’s lock in those gains together 💰🔥

BTCUSDTSecond trade of the day is on BTCUSDT — and I’ve already entered the position.
I’ve set the Risk-to-Reward Ratio to 1:1 this time, as I entered with a higher lot size than usual.
🔍 Criteria:
✔️ Timeframe: 15M
✔️ Risk-to-Reward Ratio: 1:1
✔️ Trade Direction: Buy
✔️ Entry Price: 98,835.27
✔️ Take Profit: 99,320.67
✔️ Stop Loss: 98,347.72

BTC LIMITHello friends
Due to the price drop, we can buy in the price drop and move with it to the specified targets, of course with capital and risk management.
*Trade safely with us*

btc on bullish#BTCUSD now above the third pattern, price is expected to continue bullish from 98150.
Above and 2 times breakout at 97326 will take the price above 98150, stop loss 96781.
Above 98150 have bullish formation which will target 100k, any reverse below 96781 will retrace bullish back.

Bitcoin Parabolic Curve - 2022 to 2026 Market CycleThis line chart shows the current Bitcoin market cycle from the bear market bottom in November 2022. As you can see, the price has formed a parabolic curve, which was violated around the beginning of March. A couple of weeks later, there was a retest of the curve, which was rejected. The price of BTC has since returned to the bottom side of the curve and is following it upwards.
I am also watching the Bitcoin monthly chart and, more specifically, the monthly Stochastic RSI indicator. As you can see in the chart below, between the second and third months after the market cycle peak, the Stochastic RSI indicator has always dropped below the "20" level, and was near zero at the close of the third month.
There was some speculation that the new all-time high set on January 20th at just over $109k was the peak for this market cycle. At the beginning of April, the Stochastic RSI dropped well below the 20 level but rebounded and was at 16.81 when the April candle closed. One week into May, the Stochastic RSI has pushed back above the 20 level and currently sits at 26.38.
I am still keeping an open mind, but if the high set on January 20th were the market cycle peak, based on past history, I would have expected the Stochastic RSI to have been much lower at the close of April. If the May candle closes with the Stochastic RSI above the 20 level, it will give me much more confidence that Bitcoin has not peaked for this market cycle.
My assumption for now is that Bitcoin is still following a 4-year market cycle. If this is true, I would expect a market cycle peak sometime in the final months of this year. Either way, it has been a very interesting market cycle with huge changes for the crypto asset class.

Bitcoin Dominance - the two scenarios!Bitcoin dominance continues to rise after breaking out of a rising wedge pattern on the weekly chart. It has now also broken through the 0.786 Fibonacci level.
Next stop is Rectangle 1, where Bitcoin dominance is expected to reach 68% — and most likely, this will mark the top of dominance before it starts to drop, triggering a historic altcoin season.
Scenario 2:
Dominance keeps pushing higher toward Rectangle 2, potentially surpassing 70%. At that point, many altcoins may form new lows, and weak projects could get wiped out.
Fear in the market will hit extreme levels —
but that could signal the beginning of an altseason and the collapse of BTC dominance.
Best regards Ceciliones 🎯

BTC/USD) bullish trend analysis Read The ChaptianSMC Trading point update
Technical(BTC/USDT) analysis outlines a bullish outlook with key technical levels and scenarios. Here's a breakdown of the idea:
Key Observations:
1. Trend Break and CHoCH (Change of Character):
The chart shows a clear break of the downtrend, confirmed by the CHoCH label — a common Smart Money Concept (SMC) signal indicating a potential trend reversal from bearish to bullish.
2. Key Zones Highlighted:
EVC-Buying Zone: Around 86,000 – 88,000 (aligned with EMA 200), marked as a strong accumulation area.
New Support Level: Around 92,000 – 93,000, potentially forming a bullish support after the recent rally.
Resistance Levels: Two major resistance zones near:
99,600 (intermediate resistance and target)
106,400 (final target)
3. RSI Indicator:
RSI is near 64, indicating strong momentum but not yet overbought — a potential sign of further upside.
4. Two Bullish Scenarios:
Scenario 1 (Aggressive Bullish): BTC continues upward from the current level and breaks above resistance toward the 106,447 target.
Scenario 2 (Retracement Bullish): BTC dips to the new support or even into the buying zone (86–88k), then rebounds to reach the same targets.
Mr SMC Trading point
---
Idea Summary:
The chart suggests bullish continuation, with potential pullbacks into strong demand zones. It supports both breakout and retracement entries, with targets at 99,632 and 106,447. If price holds above EMA 200 and RSI remains supportive, the upside thesis remains valid.
Pales support boost 🚀 analysis follow)

DeGRAM | BTCUSD Holds the Accumulation Zone📊 Technical Analysis
● BTC rebounded off rising‐channel boundary and has formed a base in the $93K–95.3K accumulation zone. A decisive break above ~$95,700 would confirm a fresh leg to $98,000.
● Higher lows and tightening range signal building bullish pressure for an impulsive move toward the channel top.
💡 Fundamental Analysis
● Spot BTC ETFs logged ~$675 M of net inflows on May 2.
✨ Summary
Rising‐channel support + sustained ETF demand favor a short‐term long bias: targets GETTEX:98K → $100K; view invalidated below $91,500.
-------------------
Share your opinion in the comments and support the idea with a like. Thanks for your support!

BTCUSD BULLISH SUSTAINANCE.BTCUSD Trading Signal
Market Sentiment: The market is currently experiencing a price surge following a strong rally throughout April. Bitcoin has shown positive momentum and remains in a clear ascending market structure.
Key Levels:
Resistance: $92,000 (broken)
First Target: $95,750
Final Target: $97,800
Technical Overview:
Bitcoin continues its upward movement, supported by strong volume and higher highs. Moving averages point to a strengthening market, with momentum indicators confirming an ongoing bull run. Traders may consider entering on pullbacks or confirmed breakouts above $95,750.

BREAKING NEWS - India launches missile attack on Pakistan
🚨MartyBoots here , I have been trading for 17 years and sharing my thoughts on btc here..
🚨
BTC is a geopolitical asset
Bitcoin is likely to rise after its declineFrom the perspective of historical trends and technical indicators, when the short-term moving averages show a bullish arrangement, it is usually a relatively strong signal. However, the previously mentioned signs of a bearish divergence in the MACD indicator imply the risk of a pullback. If Bitcoin can break through the recent resistance level, such as $95,000, it may trigger a new round of upward trend. Conversely, if it fails to break through and the selling pressure continues to increase, there may be a certain degree of decline.👉👉👉
From the demand side, although the inflow of ETF funds is still lower than the level in 2024, the apparent demand has turned positive since the end of February, indicating a certain purchasing power. If this kind of demand continues to grow, it will provide support for the price of Bitcoin. On the supply side, the total amount of Bitcoin is fixed, and the increase in mining difficulty has slowed down the growth rate of new currency supply, which is conducive to price stability or increase to a certain extent.
BTCUSD Trading Strategy
buy @ 93500-9370
sl 925000
tp 94800-95000
If you approve of my analysis, you can give it a thumbs-up as support. If you have different opinions, you can leave your thoughts in the comments.Thank you!👉👉👉


BTC SHORT TERM FOLLOW UP BE SURE TO BUY AT 89-91k"Last alert for the dip — this is a follow-up to my initial analysis on the short-term period."

Bitcoin Struggles at the $95,000 BarrierIn today’s session, BTC has once again posted a decline of over 2%, as the previous bullish bias struggles to break through the $95,000 resistance level. The neutrality forming on the chart around this zone reflects the uncertainty in market sentiment, which is also evident in the Crypto Fear and Greed Index, currently oscillating in the neutral range at 45 points. The market appears to be watching closely for developments in the trade war and the Federal Reserve's interest rate decision on Wednesday before resuming the buying pressure that has driven BTC in recent weeks.
Short-Term Bullish Trend
Since April 9, a sustained bullish trend has been forming in BTC’s price, until momentum stalled near the $95,000 resistance zone. Prolonged price neutrality around this level may begin to slow the upward momentum that had been developing and lead to a consolidation phase. However, the long-term outlook still shows a clear dominance of buying interest.
Technical Indicators:
RSI: The RSI line approached the overbought zone near the 70 level, but has since begun to trend downward, suggesting that the recent buying momentum is weakening. This opens the door for potential short-term bearish corrections.
MACD: The MACD histogram is slowly approaching the zero line, which may indicate a balance of forces in the market. Furthermore, if a crossover between the MACD line and the signal line occurs in the short term, it could be interpreted as the start of a sustained bearish momentum that may affect upward price movements.
Key Levels to Watch:
$95,000 – Major Resistance: The most relevant resistance level for BTC, aligned with the 61.8% Fibonacci retracement. A breakout above this zone could confirm the strength of buying interest and pave the way for a more extended bullish trend.
$90,000 – Nearby Support: This level aligns with neutral consolidation areas from previous sessions and could serve as a short-term support in the face of potential pullbacks.
$86,500 – Key Support: This level is marked by the 50-period simple moving average. A drop to this level could break the short-term bullish structure and extend bearish momentum.
Written by Julian Pineda, CFA – Market Analyst

BTCUSD Daily Trend Analysis from May 05, 2025Based on my analysis, BTCUSD is likely to experience a bearish trend over the next four trading days. A sell signal has been confirmed, with a stop-loss set at 97,939. Key support levels to watch are 83,974 and 80,491 — the latter becoming relevant only if the price breaks and closes below 83,974.
Please note: this is a personal market outlook and not a trading recommendation. Traders should rely on real-time technical analysis and implement appropriate risk management practices before making any trading decisions.

btc on bullish#BTCUSD price have been declined and now forming to reverse above 95915 for sell retrace.
Above 94463 holds a strong bullish which will reach 95915, stop loss at 93725.
Below 93725 holds another bearish confirmation which will drop 93k-92500.

BTCUSDT - near to his resistance ? What's next??#BTCUSDT - market just placed his resistance area and now market trade below that.
Keep close that and if market holds current high then we can expect a drop from here.
Good luck
Trade wisely

BTCUSDTHello everyone! The downtrend in BTCUSDT continues with strong volume. Since May 3rd, the bearish trend has remained intact, and the current delta rate stands at -45%.
This indicates that the downward momentum is likely to continue for a while.
Therefore, I’m planning to open a short position on BTCUSDT.
You can find the entry, exit, and TP levels below.
🔍 Criteria:
✔️ Timeframe: 15M
✔️ Risk-to-Reward Ratio: 1:1.50
✔️ Trade Direction: Sell
✔️ Entry Price: 94586.48
✔️ Take Profit: 94113.32
✔️ Stop Loss: 94902.08
🔔 Disclaimer: This is not financial advice. It's a trade I’m taking based on my own system, shared purely for educational purposes.
📌 If you're also interested in systematic and data-driven trading strategies:
💡 Don’t forget to follow the page and subscribe to stay updated on future analyses.
