Beyond FOMO: Strategic Analysis of BTC.D and Market ProspectsLet's begin by examining CRYPTOCAP:BTC.D on the monthly timeframe. Here we see the old EXP model, which formed in December 2020. This model reflected the decrease in bitcoin dominance during 2020-2021. For our current analysis, we're interested in the level of the first point — 73.02%.
On the weekly timeframe, we see an AMEXP model that formed in January 2023 and effectively describes the entire current upward trend.
Note the price reaction from the model levels of 51.7% and 59.64%. Within this model, we have two more upper levels: 68.9% and 90.36%.
The dominance level of 90.36% seems unrealistic from a common sense perspective: such a scenario is only possible with a total collapse of the entire crypto market, when all assets (including bitcoin) would depreciate to the point where bitcoin's capitalization would constitute 90% of the entire market. I hope we never see these values. However, reaching the 68.9% level seems quite likely.
Most likely, the price will try to break through the 68.9% level (we may see a bounce from this level, which might be mistakenly perceived as the beginning of a new alt season). After that, the price will likely make a new maximum and rise above the 73.2% level. And only then will we finally see the formation of a downward trend in bitcoin dominance.
What might be happening in the market if our bitcoin dominance analysis proves correct?
Let's look at the #BTC chart, where the expansion model was validated on the weekly timeframe (green model):
According to the model levels, we can expect growth to at least $109,354, and at maximum — to a new all-time high (ATH) with targets of $115,116, $116,757, and even $152,723 or $174,102 (although the probability of reaching the last two targets, despite their presence in the model, is relatively low).
If we look at CRYPTO:ETHUSD , the picture looks significantly worse — the asset is in a deep bearish phase.
Against the backdrop of general positive sentiment, CRYPTO:ETHUSD may grow to $2 059 or even to $2 626, but we will consider this merely as a bounce. We can only talk about a real trend change when the price moves beyond the yellow model.
Everyone is waiting for the reversal of bitcoin dominance (we have only calculated the most probable reversal point), as its exponential growth should be replaced by the long-awaited alt season.
However, few consider a possible negative scenario: the correction of bitcoin dominance may occur against the backdrop of a general market decline, where bitcoin will fall faster than altcoins. Against the background of growing macroeconomic uncertainty (problems in the global economy have not disappeared, they continue to accumulate, and no matter how they try to "postpone" them — this will not pass without a trace), we consider the negative scenario to be the main one.
For the past year, everyone has been saying that bitcoin is a super-reliable asset, and if something goes wrong — you need to buy bitcoin. Most retail investors love bitcoin and hate altcoins — largely because they have many unprofitable altcoins in their portfolio and no bitcoin. Each time, missing the moment to buy bitcoin, they succumbed to FOMO. Now, as bitcoin moves toward a new maximum, everyone is rushing to buy it again.
At the same time, we have a market where 80-90% of participants are in large losses. For most assets to just break even (not to mention profits), they need to grow by 300-400%.
Of course, we're not saying everything will necessarily be bad, but we prefer to stick to a strategy that primarily takes into account the negative scenario. For now, we will refrain from investment positions and give preference exclusively to speculative ones.
Btcusdanalysis

BTC Buy SetupROBERT055
Summary:
Entry Zone (Buy): Near around 95,500 – 96,000
TP1: 99,000
TP2: 103,000

$AITECH/USDT Analysis:🧠 $AITECH/USDT Analysis:
After a long downtrend inside a falling channel, $AITECH broke out with strength, flipping the previous supply zone into support.
- Target: 0.15613
- Potential Gain: +303% from breakout
Watch for a retest & confirmation.
DYOR. NFA.

BTC is ready to cross 112,300 and 145,836BTC Weekly chart showing strong support at 91554 level Next resistance is 112,300 and 145,836. Below support is 74,786
Note: This is not a buy/sell trade call. Trade at your own
will.

BTC-----Sell around 96300, target 95300-95000 areaTechnical analysis of BTC contract on May 2:
Today, the large-cycle daily level closed with a medium-yang line yesterday, the K-line pattern was single-yin and single-yang, the price was at a high level, and the attached indicator was running in a golden cross. However, although the price broke through the high point yesterday, it did not continue. It is currently in a waving trend. In this way, we still have to look at the range shock trend in terms of trend, and the transaction is still high-altitude and low-multiple; the short-cycle hourly chart showed that the US market rose and broke the high yesterday, and the price retreated under pressure in the early morning. The current K-line pattern is continuous and negative, and the attached indicator is running in a dead cross, so there is a high probability that there will be a demand for a decline during the day.
Therefore, today's BTC short-term contract trading strategy: sell at the current price of 96,300 area, stop loss at 96,800 area, the first target is 95,300 area, and the second target is 95,000 area;

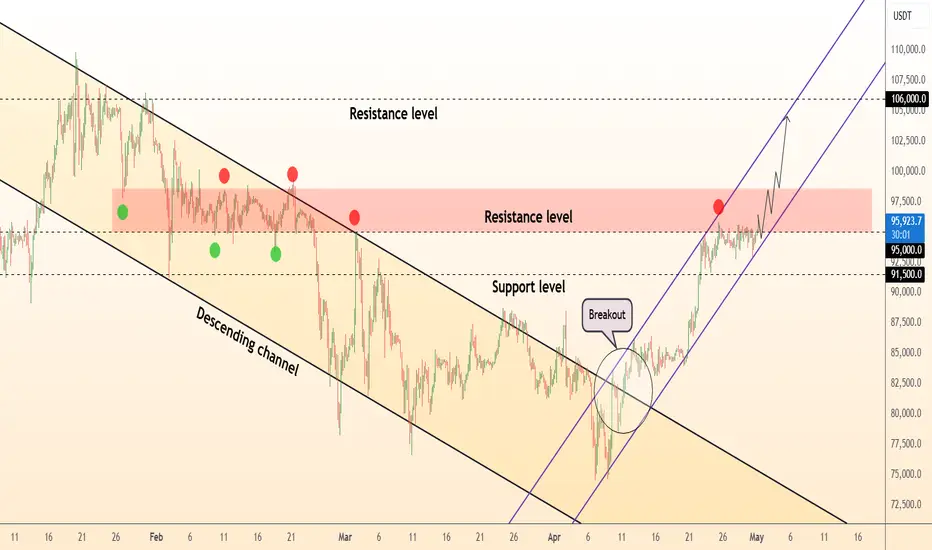
DeGRAM | BTCUSD 📊 Technical Analysis
● Price exited a 3-month descending channel and is climbing inside a new rising channel; $91 500 support keeps bulls in control.
● Price just under the $95k supply zone; a break unlocks the upper rail near GETTEX:98K and the next objective at $106k.
💡 Fundamental Analysis
● Spot-BTC ETFs hauled in ≈ $3.4 B last week, underscoring persistent institutional demand.
● US JOLTS openings fell to a four-year low, boosting Fed rate-cut odds and softening the USD—both tail-winds for Bitcoin.
✨ Summary
Rising-channel structure, hefty ETF inflows, and softer U.S. data favor a push above $95 K toward $98 K–106 K; bias invalidated below $91 500.
-------------------
Share your opinion in the comments and support the idea with a like. Thanks for your support!
BTCUSD - NFP WILL DECIDE!!MARKET UPDATE
After price ranged for most part of the week we've seen an impulsive move to the upside pre NFP. Heading up into NFP News Release I still remain Bearish on BTC (But NFP will decide).
MARKET PROFILE
I'm viewing the market profile of this week as an ACCUMULATION, MANIPULATION & DISTRIBUTION Model. We've seen price Accumulate earlier in the week heading into Thursday, and the displacement on Thursday to the upside I'm viewing as a Manipulation into the daily key Supply Level so my anticipation is for NFP News Release to bring about the Distribution to the downside.
IN SUMMARY
This is only my view on BTC current price action and not a financial advice. You're free to share your opinion on this down in the comment.

#BTC/USDT Update. Bitcoin is currently trading around a key resistance zone.
The immediate support lies near $95,554, while a confirmed breakout above $97,300 could trigger an uptrend toward $104,000.
Until then, trade with caution.
DYOR. NFA.

BTCUSDT LONG SCALPING BTCUSDT LONG SCALPING
BUY ABOVE 97100
Target 1: 97350
Target 2: 97600
SL: 96830

Bitcoin Vs Microsoft 🚨MartyBoots here , I have been trading for 17 years and sharing my thoughts on COINBASE:BTCUSD .
🚨
.
NASDAQ:MSFT vs COINBASE:BTCUSD
Do not miss out on COINBASE:BTCUSD as this is a great opportunity. You are still early
Watch video for more details

BITCOIN - A real bullish sign!3D chart shows a Bullush exaggerated Divergence on RSI indicator.
Bullish Exaggerated Divergence happen when:
1- Price: Forms a double bottom (two equal lows).
2- RSI: The second low is higher than the first.
- Implication: Momentum is picking up despite flat price, hinting at a possible upward reversal.
It's called exaggerated because price looks stable (same lows), but RSI reveals a hidden shift in momentum.
There’s also a breakout from a falling wedge pattern and a perfect break above the 50 EMA with a massive green candle.
We are now at the beginning of Bitcoin’s true bullish rally.
Best regards Ceciliones🎯

BTC-----Sell around 94000, target 92700 areaTechnical analysis of BTC contract on April 30: Today, the large-cycle daily level closed with a small negative line yesterday. The K-line pattern was a continuous positive single negative, and the price was still at a high level. The attached indicator was in a golden cross operation. Although the volume was shrinking, the price retracement could not be seen to continue at present, and the strength was relatively small. The price did not break the previous low point, so at present, the general trend remained bullish; the short-cycle hourly chart showed that the European and US prices continued to consolidate at a high level yesterday. The price began to fall under pressure in the early morning and continued in the morning. The current K-line pattern was a continuous negative, and the attached indicator was in a dead cross operation. Therefore, there is a high probability that there is still a demand for decline during the day. Pay attention to the low support position near the 92700 area below.
Therefore, today's BTC short-term contract trading strategy: sell at the 94000 area, stop loss at the 94500 area, and target the 92700 area;

DeGRAM | BTCUSD Flipped the Trend Line📊 Technical Analysis
● BTC keeps the $91 500 level.
● While it holds, the chart still points to $98 000 then $108 000.
💡 Fundamental Analysis
● US spot-ETFs took in $591 M on 28 Apr, extending a six-day inflow streak that topped $3 B for the week.
● MicroStrategy added 15 355 BTC at ~$92 737, lifting corporate demand.
● Network hashrate set a 1 ZH/s ATH, underscoring security.
● Exchange balances sit at a seven-year low as coins move to cold storage.
● DXY is at 3-year lows and yields are down.
✨ Summary
Persistent ETF inflows, corporate accumulation, record hashrate, shrinking float and a weaker USD reinforce the bullish setup; staying above $91 500 supports a run to $98–100 k.
-------------------
Share your opinion in the comments and support the idea with a like. Thanks for your support!

Bullish Bitcoin Find ResistanceFenzoFx—Bitcoin remains bullish above the 50-period simple moving average but lost momentum near the $95,995 resistance. It currently trades around $94,650.
A breakout above $95,995 could trigger a move toward $99,560. Conversely, a close below $92,875 may lead to a drop toward $91,720, with further downside potential to $88,830 if selling pressure intensifies.
>>> Prop Trading
>>> No Deposit Bonus
>>> %100 Deposit Bonus
>>> Forex Analysis Contest
All at FenzoFx Decentralized Forex Broker

BTC looking for retesting the support inorder to go higher. BTC looking for retesting the support inorder to go higher.
In worst case, the price can break above the 96000 range and take the resistance and come down towards lower lows
if the price is first moving towards 93000 range today or tomorrow, then btc has officially become a strong candidate for long entrys.

Is Bitcoin Overextended? Here's My Trade Plan If BTC Retraces!Bitcoin Daily Chart Analysis 📝
🚀 Current Market Structure:
The daily BTC/USDT chart clearly shows a strong bullish trend, with price action recently making a significant upward move. The current candles are consolidating near the highs, suggesting a potential overextension after a parabolic rally. This often precedes a corrective phase, as buyers may take profits and new participants wait for a more favorable entry.
🔍 Wyckoff Perspective:
Your approach aligns with the Wyckoff Method, specifically looking for a retracement to the 50% level of the current swing. This would place the ideal entry zone around the $93,071 area, as marked on your chart. According to Wyckoff, after such a retrace, we should watch for an accumulation range—a period of sideways movement where smart money absorbs supply. The key signal to watch for is a "spring" (a false breakdown below the range), followed by a strong bullish breakout, confirming demand dominance.
🌐 Fundamental Backdrop:
Fundamentally, Bitcoin remains supported by several macro factors:
Institutional adoption continues, with ETFs and large funds increasing exposure.
The recent halving event has reduced new supply, historically a bullish catalyst.
Regulatory clarity in major markets (e.g., US, EU) is improving, reducing uncertainty. However, risks remain from potential regulatory crackdowns, macroeconomic headwinds (such as interest rate hikes), and geopolitical tensions.
💬 Sentiment & Analyst Consensus:
Market sentiment is currently optimistic, with the Crypto Fear & Greed Index hovering in the "Greed" zone. Many analysts are calling for a healthy correction before the next leg up, echoing your expectation of a retrace. Some prominent voices suggest that a pullback to the $92,000–$94,000 range would be constructive, allowing for reaccumulation and a more sustainable rally.
📈 Technical Triggers to Watch:
Retrace to 50% Level: Monitor for price action around $93,071–$94,593.
Accumulation Range: Look for a period of low volatility and tight range after the retrace.
Spring & Breakout: A false breakdown below the range, quickly reclaimed, followed by a strong bullish candle, would be the classic Wyckoff entry trigger.
⚠️ Disclaimer
This analysis is for informational purposes only and does not constitute financial advice. Cryptocurrency markets are highly volatile and risky. Always conduct your own research and consult with a professional before making investment decisions.

BTCUSDT 1W UpdateYes, history is likely to repeat itself, making it possible for Bitcoin to reach a new all-time high in the range of $130K to $150K this year.
Are you ready?

Bitcoin's Crossroads: Golden Cross Signals, Capital Floods In
The Bitcoin narrative is rarely static. It oscillates between fervent optimism and deep skepticism, driven by a complex interplay of technical patterns, on-chain data, macroeconomic shifts, and evolving investor perceptions. Recently, several compelling signals have converged, painting a picture of a market potentially at a significant juncture. A rare "Golden Cross" technical pattern has formed, an event often associated with the start of major bull cycles. Simultaneously, on-chain data reveals a surge in "hot supply," indicating a significant influx of new capital and heightened market activity. Adding another layer, Bitcoin demonstrated surprising resilience and relative strength against traditional assets like gold and tech stocks during recent market turbulence, exhibiting an unusually low beta that hints at potential maturation.
This confluence of technical momentum, fresh capital inflow, and changing market behavior warrants a deep dive. What exactly is the Golden Cross, and what does its appearance portend for Bitcoin? How should we interpret the nearly $40 billion in "hot supply," and what risks and opportunities does this influx of potentially newer, less experienced capital present? And critically, does Bitcoin's recent outperformance and low correlation signal a fundamental shift in its role within the broader financial landscape? This article will dissect these interconnected developments, exploring their historical context, potential implications, and the inherent uncertainties that always accompany the world's leading cryptocurrency.
Decoding the Golden Cross: A Technical Harbinger?
Technical analysis (TA) is a cornerstone of trading in many markets, including cryptocurrency. It involves studying past price action and volume data to identify patterns and trends that might predict future movements. One of the most widely recognized and discussed bullish signals in TA is the "Golden Cross."
• What is a Golden Cross? A Golden Cross occurs when a shorter-term moving average (MA) of an asset's price crosses above a longer-term moving average. The most commonly watched Golden Cross involves the 50-day simple moving average (SMA) crossing above the 200-day SMA.
o The 50-day SMA reflects the average closing price over the last 50 trading days, representing recent momentum.
o The 200-day SMA reflects the average closing price over the last 200 trading days, representing the longer-term underlying trend.
• Traditional Interpretation: When the faster-moving 50-day MA overtakes the slower 200-day MA, it suggests that recent price momentum is strengthening significantly relative to the long-term trend. Technicians interpret this as a potential confirmation that a bottom may be in, and a new, sustained uptrend could be starting. It's often seen as a lagging indicator (confirming a trend already underway) but one that can signal the potential for significant further upside. Conversely, the opposite pattern, where the 50-day MA crosses below the 200-day MA, is known as a "Death Cross" and is considered a bearish signal.
• The "Once Per Cycle" Phenomenon: The claim that this specific Golden Cross (50-day crossing 200-day) happens "once every cycle" for Bitcoin generally refers to its appearance after major bear market bottoms and preceding significant bull runs in Bitcoin's roughly four-year halving cycles. Historically, looking back at Bitcoin's chart, these crosses have indeed often preceded periods of substantial price appreciation. For example, Golden Crosses occurred in 2012, 2015, 2019, and 2020, each preceding major bull markets, albeit with varying time lags and magnitudes.
• Historical Performance and Caveats: While historically bullish for Bitcoin, the Golden Cross is not an infallible predictor.
o Lagging Nature: By the time the cross occurs, a significant portion of the initial rally off the bottom may have already happened.
o False Signals: Markets can experience "whipsaws," where a Golden Cross forms briefly only to reverse into a Death Cross shortly after, trapping overly eager bulls. This was seen briefly in some shorter timeframes or even on the daily chart during choppy periods in Bitcoin's history.
o Context Matters: The broader market environment, macroeconomic factors, and fundamental developments play crucial roles. A Golden Cross during a period of intense regulatory crackdown or global recession might not have the same impact as one occurring during quantitative easing and growing institutional interest.
o Confirmation Needed: Traders often look for confirmation signals after a Golden Cross, such as sustained price action above the moving averages, increasing volume, or bullish follow-through patterns.
What to Expect from the Golden Cross?
The formation of a Golden Cross on Bitcoin's daily chart is undeniably a positive technical development that captures market attention. It suggests underlying strength and improving medium-term momentum. Historically, it has often marked the transition from a bear market recovery phase to a more sustained uptrend.
However, expectations should be tempered with caution. It's a signal, not a guarantee. It indicates potential but requires confirmation through continued price strength and favorable market conditions. Relying solely on this pattern for investment decisions is risky. It should be considered alongside other factors – on-chain data, fundamental developments, and macroeconomic context – to form a more complete picture. The most reasonable expectation is that the Golden Cross increases the probability of further upside but doesn't eliminate the possibility of consolidation, pullbacks, or even failure of the nascent uptrend.
The Heat is On: Understanding the Surge in 'Hot Supply'
While technical analysis looks at price charts, on-chain analysis delves into the activity happening directly on the Bitcoin blockchain, providing insights into investor behavior and capital flows. A key metric highlighted recently is the rise of "Bitcoin hot supply."
• What is 'Hot Supply'? "Hot Supply" typically refers to Bitcoin that has been moved on the blockchain relatively recently, often within the last few months (definitions can vary slightly between analytics platforms, e.g., coins moved within the last 1-3 months or sometimes up to 6 months). These coins are considered "hot" because they are more likely to be involved in active trading or spending, as opposed to "cold" supply held in long-term storage (often associated with HODlers). It represents the portion of the Bitcoin supply that is more liquid and actively circulating.
• Nearing $40 Billion: The fact that this hot supply is nearing a value of $40 billion is significant. It indicates a substantial amount of Bitcoin changing hands and reflects a "surge in capital turnover," as described in the analysis. This suggests heightened market activity, increased liquidity, and, crucially, the entry of new participants or the reactivation of dormant capital.
• New Investors Flooding In (at High Prices?): The analysis explicitly links this surge to new investors and speculators taking an interest, likely attracted by Bitcoin's recent price recovery and multi-month highs. The mention of "$95K" (even if potentially a typo or hypothetical peak target in the source analysis) symbolizes the risk that many of these new entrants might have acquired Bitcoin at relatively elevated prices compared to the cycle lows. This creates a cohort of investors with a higher cost basis.
• Implications of High Hot Supply:
o Increased Liquidity: More coins moving means more potential buyers and sellers, which can facilitate smoother price discovery and larger trades.
o Fuel for Rallies: An influx of new capital provides buying pressure that can sustain upward price momentum. Speculative interest often feeds on itself in bull markets.
o Increased Volatility: Coins held by newer entrants or short-term speculators are often considered "weaker hands." These holders may be more susceptible to panic selling during price dips or quick profit-taking during rallies, potentially leading to sharper price swings in both directions.
o Potential Overhead Supply: If the price stalls or reverses, the large volume of coins acquired at recent highs ( SGX:40B worth moved recently) represents potential selling pressure as these holders seek to break even or cut losses.
Interpreting the Influx:
The surge in hot supply is a double-edged sword. On one hand, it confirms growing interest and provides the necessary capital flow to potentially validate the bullish signal from the Golden Cross. New demand is essential for sustained price increases. On the other hand, it introduces a layer of fragility. The market's ability to absorb potential selling from these newer, higher-cost-basis holders during inevitable corrections will be a key test of the underlying strength of the current trend. Monitoring whether this "hot supply" gradually cools down (moves into longer-term holding) or remains elevated will be crucial in the coming months.
Bitcoin's Relative Strength: Outshining Gold and Tech Amid Turmoil
Beyond technicals and on-chain flows, Bitcoin's performance relative to traditional assets, especially during periods of market stress, offers valuable insights into its evolving perception. The observation that Bitcoin outperformed both gold (a traditional safe-haven) and tech stocks (risk-on assets) in April, particularly amidst "tariff turmoil" or other geopolitical/economic uncertainties, is noteworthy.
• Challenging Correlations: Historically, Bitcoin often traded with a high correlation to risk assets like tech stocks, particularly during market downturns. Investors tended to sell Bitcoin alongside equities during risk-off periods. Gold, conversely, often acts as a safe haven, rallying during uncertainty. Bitcoin outperforming both simultaneously suggests a potential breakdown in these typical correlations, at least temporarily.
• Why the Outperformance? Several factors could contribute:
o Unique Drivers: Bitcoin's price is influenced by factors unique to its ecosystem, such as halving cycles, adoption news, regulatory developments, and flows into new instruments like spot ETFs. These can sometimes override broader market trends.
o Inflation Hedge Narrative: Persistent inflation concerns may lead some investors to seek alternatives to fiat currency, benefiting both gold and Bitcoin, but perhaps Bitcoin more so due to its perceived higher growth potential.
o Safe-Haven Experimentation: While gold remains the established safe haven, some investors might be tentatively allocating a small portion to Bitcoin as a potential alternative store of value or hedge against systemic risk, especially if they perceive traditional systems as vulnerable.
o Decoupling Narrative: Some proponents argue that Bitcoin is increasingly decoupling from traditional markets as it matures and establishes itself as a distinct asset class. The recent performance could be seen as evidence supporting this view.
o Coincidence/Timing: It's also possible that the timing was coincidental, with Bitcoin-specific catalysts driving its price higher while unrelated factors weighed on gold and tech stocks during that specific period.
Significance of Relative Strength:
Demonstrating strength during periods when traditional assets are struggling enhances Bitcoin's appeal. It challenges the simplistic "risk-on only" label and suggests it might offer diversification benefits. If this pattern persists over longer periods and across different market stressors, it could significantly bolster the case for Bitcoin's inclusion in traditional investment portfolios.
Maturation Signal? The Low Beta Phenomenon
Closely related to relative strength is the concept of beta. Beta measures the volatility or systematic risk of an asset compared to the overall market (often represented by an index like the S&P 500).
• Beta Explained:
o A beta of 1 indicates the asset's price tends to move with the market.
o A beta greater than 1 indicates the asset is more volatile than the market.
o A beta less than 1 indicates the asset is less volatile than the market.
o A beta of 0 suggests no correlation.
• Bitcoin's Historically High Beta: Traditionally, Bitcoin has exhibited a high beta, especially relative to equity markets. It was often seen as a high-volatility asset that amplified broader market moves, particularly to the downside during risk-off events.
• Recent Low Beta Observation: The finding that Bitcoin displayed an "unusually low beta during recent market stress" is significant. It implies that its price movements were less correlated with, and potentially less volatile than, the broader market during that period of turbulence.
• Implications of Low Beta:
o Maturation Narrative: A lower, less correlated beta is often characteristic of more mature assets or distinct asset classes. It suggests investors might be viewing Bitcoin with a longer-term perspective, less prone to knee-jerk selling based on short-term fluctuations in other markets.
o Diversification Potential: Assets with low correlation to traditional portfolios (like stocks and bonds) are valuable for diversification, as they can potentially reduce overall portfolio volatility. A sustained low beta would strengthen Bitcoin's diversification credentials.
o Shift in Holder Base?: It could indicate a shift towards more institutional and long-term holders who are less reactive to daily market noise compared to purely retail speculators.
o Store of Value Aspirations: While still highly volatile compared to traditional stores of value like gold, a decreasing beta could be interpreted as a tentative step towards fulfilling some store-of-value properties, particularly if it holds value better than risk assets during downturns.
Is it Sustainable?
While the recent low beta is an encouraging sign for Bitcoin bulls and proponents of its maturation narrative, it's crucial to question its sustainability. Was it a temporary anomaly driven by specific market conditions in April, or does it represent a durable shift? Bitcoin's correlation and beta have fluctuated throughout its history. Renewed market panic, significant regulatory shocks, or major shifts in macroeconomic policy could potentially cause correlations to snap back. Continued observation across different market environments is needed to determine if this low beta is a new regime or a fleeting characteristic.
Synthesizing the Signals: A Complex Tapestry
Bringing these threads together – the Golden Cross, the surge in hot supply, relative outperformance, and low beta – reveals a complex and somewhat contradictory picture:
1. Technical Momentum Meets New Money: The Golden Cross provides a technically bullish backdrop, potentially encouraging more participants. The SGX:40B in hot supply confirms that new capital is entering, providing the fuel that could validate the technical signal.
2. Speculation vs. Maturation: The influx of hot supply points towards increased speculation and potentially "weaker hands." Yet, the low beta and relative outperformance during stress hint at underlying strength and potential maturation, suggesting a core base of holders is becoming less reactive. This highlights the heterogeneous nature of the Bitcoin market, with different investor cohorts exhibiting different behaviors simultaneously.
3. Opportunity and Risk: The convergence creates both opportunity and risk. The opportunity lies in the potential for the Golden Cross and new capital to ignite a sustained rally, further bolstered if Bitcoin continues to act as a diversifier (low beta). The risk lies in the potential fragility introduced by the high volume of recent entrants (hot supply) who might capitulate during dips, potentially invalidating the Golden Cross and reversing the low beta trend.
The current environment suggests Bitcoin is navigating a transition. The technicals point upwards, fresh capital is flowing in, and its behavior relative to traditional markets is showing intriguing signs of change. However, the presence of significant "hot" money serves as a reminder that volatility and sharp corrections remain distinct possibilities.
Overarching Risks and Necessary Caveats
Despite the positive signals, numerous risks persist:
• Technical Analysis is Not Predictive: The Golden Cross is a historical pattern, not a crystal ball. It can fail.
• 'Hot Supply' Risk: A large cohort of investors with a high cost basis can become a source of significant selling pressure if sentiment shifts.
• Macroeconomic Headwinds: Persistent inflation, rising interest rates (globally), geopolitical conflicts, or a global recession could dampen appetite for risk assets, including Bitcoin.
• Regulatory Uncertainty: While spot ETFs marked progress, the global regulatory landscape for crypto remains fragmented and uncertain. Unexpected crackdowns remain a threat.
• Correlation Risk: The low beta and decoupling narrative could prove temporary. Bitcoin could easily recouple with risk assets during a broader market panic.
Conclusion: Bitcoin at an Inflection Point?
Bitcoin currently stands at a fascinating crossroads, illuminated by a confluence of compelling, albeit sometimes conflicting, signals. The rare Golden Cross offers a technically bullish omen, suggesting underlying momentum is shifting favorably for a potential long-term uptrend, echoing patterns seen in previous cycles. This technical optimism is fueled by tangible evidence of renewed interest, with nearly $40 billion in "hot supply" indicating a significant surge in capital turnover and the arrival of fresh speculative and investment capital.
Simultaneously, Bitcoin's recent behavior exhibits intriguing signs of potential maturation. Its ability to outperform traditional safe havens like gold and risk assets like tech stocks during periods of market stress, coupled with an unusually low beta, challenges its historical "risk-on only" profile. This suggests a growing base of investors may be viewing it through a longer-term lens, potentially as a unique store of value or a portfolio diversifier, less swayed by short-term market noise.
However, this complex picture demands caution. The very influx of capital that fuels optimism also introduces fragility, as newer entrants with higher cost bases may be quicker to sell during downturns. The Golden Cross, while historically significant, remains a lagging indicator with no guarantee of future success. And the low beta, while encouraging, could prove ephemeral in the face of severe macroeconomic shocks or shifts in market sentiment.
Ultimately, Bitcoin's trajectory towards 2030 and beyond will depend on its ability to navigate these dynamics. Can it convert the current technical momentum and capital influx into a sustainable trend? Will its utility and adoption grow sufficiently to solidify its role beyond pure speculation? Will it continue to carve out a unique space in the financial ecosystem, proving its resilience and diversification benefits across various market conditions? The current signals suggest the potential is there, but the path forward remains intrinsically linked to broader economic forces, regulatory evolution, and the ever-unpredictable psychology of the market. Bitcoin is flashing signs of both renewed vigor and evolving character, making the coming months and years critical in defining its future role.


BTC(20250429) market analysis and operationTechnical analysis of BTC contract on April 29: Today, the large-cycle daily level closed with a small positive line yesterday, and the K-line pattern was a single negative with continuous positive lines. The price was still consolidating at a high level. The attached chart indicator was in a golden cross operation, but pay attention to two points: First: the technical indicator signal was rising, but the price did not continue to break the high; Second: Although the attached chart indicator was shrinking, it showed a rebound trend after the retracement, and it did not continue, so the current trend was range-bound, and the rhythm was very important; the short-cycle hourly chart showed that the European session rose but did not break the high yesterday, and the US session was under pressure and then supported and rebounded. It was under pressure again in the Asian morning session, with the high point in the 95700 area and the low point in the 93450 area; the current price is in a sideways correction, so do not take action, just wait and see.
Therefore, today's BTC short-term contract trading strategy: sell at 95500 area, stop loss at 95900 area, target at 94500-94000 area; buy at 93700 area, stop loss at 93300 area, target at 95000 area; give real-time trading according to real-time trend during the trading session

BITCOIN BUY !!!Hello friends✌
As you can see in the picture, we have specified a purchase range for you to buy in stages, of course with capital and risk management.
🙏If you like it, support it with a ✔like✔ and ✔comment✔.
*Trade safely with us*

Last Dump On BTC Be SURE TO BUY ITHi im here again we will see a last dump on btc to 89-90k be sure to buy it and don't miss the chance

BTCUSD Testing Key Resistance Ahead of FOMC – Prepare for Volati🧠 Summary:
Bitcoin ( BITSTAMP:BTCUSD ) is currently testing a major resistance zone around $95 000 -- this is a strong supply zone from February. We have a lot of macroeconomic data and FOMC meeting coming soon so be prepared for some volatility.
🔍 Key Levels:
- Resistance zone: $94 000 - $98 000
- Support zone: $86 000 - $83 000
- Major Support zone: $72 000 - $68 000
📅 Upcoming Events:
Tuesday (Today):
JOLTS Jobs Openings – est. 7.5M. A beat could signal a still-tight labor market, giving the Fed less room to ease.
Wednesday:
Q1 GDP: Expected at just 0.5% — soft, but likely already priced in.
Core PCE (MoM): Forecasted at 0.1%, which is soft and typically market-friendly, though this excludes post-tariff pressures.
Friday:
Non-Farm Payrolls: est. +130K
Unemployment Rate: Expected to hold at 4.2%
📊 Macro & Fed Context:
It currently seems unlikely that the FED's are going to cut rates this meeting. (see Forbes & USA Today ).
📈 Technical Outlook:
With no imminent policy shift from the Fed, Bitcoin may remain rangebound for the next few weeks. A break above GETTEX:98K would be bullish, but without a catalyst, there’s potential for a pullback — possibly toward the $72K support zone — before resuming upward momentum.
🧭 Trading Plan (Not Financial Advice):
Patience is key here. I’m avoiding FOMO at current levels and waiting for clearer confirmation — whether that’s a breakout above resistance or a retest of major support around $72K.
---
💻 Learn more at yungzkittlez.com — Free trading education, market updates, and tools to help you trade smarter.
No fluff. Just real strategies from 5+ years in the game. 🌴
