BTC/USD Bullish Breakout from Rectangle PatternOverview:
The chart represents Bitcoin's price action against the US Dollar on the 1-hour timeframe, highlighting a Rectangle Pattern Breakout with a well-structured trade setup. This analysis will break down the pattern, key levels, and possible trading scenarios.
1️⃣ Chart Pattern Breakdown – Rectangle Consolidation
The price has been moving within a rectangle pattern (range-bound movement), where Bitcoin found support at lower levels and faced resistance at the upper boundary.
Rectangle Pattern: A continuation/consolidation pattern where price fluctuates between horizontal resistance and support before breaking out.
Curve Formation: The price action within the rectangle also forms a rounding bottom, indicating a potential shift from bearish to bullish sentiment.
Breakout Confirmation: BTC has broken out from the rectangle, suggesting bullish momentum.
2️⃣ Key Technical Levels
🔹 Support Level ($84,110)
This zone has acted as a strong demand area, preventing the price from falling further.
Buyers consistently stepped in at this level, making it a significant psychological floor for Bitcoin.
🔹 Resistance Level ($86,850 - $87,000 Zone)
This level had previously rejected upward movements, leading to multiple price pullbacks.
After the breakout, this area is expected to act as a new support level upon a retest.
🔹 Target Price ($89,931 – Next Resistance Zone)
If the breakout sustains, the next key target for bulls is around $89,931, based on prior resistance zones and technical projections.
🔹 Stop Loss ($84,110 – Below Support Zone)
A stop loss below the support zone ensures risk management in case of a false breakout.
3️⃣ Trading Strategy & Execution
📌 Entry Point – After price confirms the breakout above the rectangle’s resistance. Traders should wait for:
A pullback and retest of the broken resistance, which should now act as support.
A strong bullish candle confirming continuation.
📌 Take Profit (TP) – $89,931, based on historical resistance levels and price projection from the rectangle range.
📌 Stop Loss (SL) – Placed at $84,110, below the rectangle’s previous support zone to minimize downside risk.
📌 Risk-to-Reward Ratio (RRR) – The setup offers a favorable RRR, meaning potential profits outweigh the risks.
4️⃣ Market Sentiment & Additional Factors
✔ Bullish Outlook – The breakout signals strong buying interest and potential upside continuation.
✔ Volume Confirmation – Traders should monitor volume spikes during the breakout to confirm institutional participation.
✔ Economic Events & News – External factors like macroeconomic data or Bitcoin-related news can impact price action.
Conclusion – BTC/USD Trading Setup
Pattern Identified: Rectangle Pattern Breakout
Current Trend: Bullish breakout from consolidation
Trade Type: Long position (Buy setup)
Key Levels:
✅ Support: $84,110
✅ Resistance: $86,850 - $87,000
✅ Target: $89,931
✅ Stop Loss: $84,110
🔥 Final Thought : Bitcoin has broken out of a key consolidation range, signaling a bullish move towards $89,931. Traders should wait for confirmation and manage risk accordingly! 🚀📈
Btcusdanalysis

Bitcoin Analysis: Potential Path to $150K and Market TrendsCurrent Price & Key Levels
- BTC/USDT Price: BINANCE:BTCUSDT (as per chart).
- Critical Support: Bottom of the ascending channel .
- Key Resistance: Upper trendline of the channel (to be confirmed).
Technical Signals
1. Ascending Channel:
- Price is at the bottom of the channel, historically a bounce zone.
- A break above the upper trendline could signal a bullish continuation.
2. Moving Averages:
- SMA 200 (4H) and SMA 20 (1D) are critical for trend confirmation.
- A bullish crossover (e.g., SMA 20 > SMA 200) would strengthen the buy signal.
3. Dominance (BTC.D):
- If Bitcoin dominance turns bearish, expect capital rotation into altcoins (altseason potential).
- Monitor dominance alongside price action for market shifts.
$150K Target: When and How?
- Scenario 1:
- A strong breakout from the ascending channel + rising volume → Acceleration toward $150K.
- Timeline:Mid-2025/Late-2025 (historically aligns with post-halving cycles).
- Scenario 2:
- Slow grind upward with corrections → $150K likely by 2026, pending macroeconomic stability (e.g., ETF inflows, regulatory clarity).
Altcoin Season Watch
- Trigger:
- If Bitcoin’s dominance drops below 57%, altcoins may surge.
- Focus on high-cap alts (ETH, SOL) and narratives like AI, DePIN, or RWA.
Trade Strategy
- Entry:
- Buy on confirmed breakout above the channel + SMA crossover.
- Stop Loss:
- Below the channel’s lower trendline (e.g., $80,000).
- Take Profit:
- targets: $100,000.120,000
- Final target: $150,000 (scale out profits).
Risks to Monitor
- Macro Factors: Fed rate decisions, geopolitical tensions.
- Bitcoin ETF Flows: Sustained inflows/outflows impact momentum.
- Regulation: Crackdowns or approvals (e.g., ETH ETF).
---
Conclusion
- Bullish Outlook: $150K is achievable if Bitcoin holds the ascending channel and dominance remains stable.
- Altseason Hedge: Prepare a basket of altcoins if BTC.D trends downward.
Like, comment, and follow for updates! 🚀

BTC-----More around 83300, target 85000 areaTechnical analysis of BTC contract on April 2: Today, the large-cycle daily level closed with a small positive line yesterday, and the K-line pattern was a single positive line with continuous negatives. The price was at a low level, and the attached indicator was a golden cross with a shrinking volume. In the big trend, the decline was very obvious, and the pullback was difficult to continue. The probability of breaking the previous high point was even smaller. Instead, it was easy to fall under pressure and break the low. This is the trend law, not speculation; the four-hour chart showed a pullback trend for two consecutive trading days. The K-line rose and fell after a continuous positive yesterday. The current K-line pattern was a continuous negative. From the technical indicators, the current correction will enter the second stage of the downward trend. The short-cycle hourly chart yesterday's US market rose to a high in the early morning and continued to fall in the morning. The current K-line pattern was a continuous negative, and the attached indicator was a dead cross. Then there is a high probability of falling during the day, depending on the strength and the breakout of the European market.
Today's BTC short-term contract trading strategy: Sell at the 85,000 area of the pullback, stop loss at the 85,500 area, and target the 84,000-83,500 area;

Déjà Vu, BTC's Historical Pattern EncoreIt is possible the pattern that shaped in late 2020 and 2021 might repeat again.
Everything just looks like the previous main high which is selected with the red square in the left of chart.
There is no guarantee even if it happens - movement and ratios of movement can be different.
Déjà vu on the charts isn't by chance.

Bitcoin (BTC/USD) Price Analysis: Bearish Breakdown Ahead?🔥 Bitcoin (BTC/USD) 1-Hour Chart Analysis 🔥
🔹 Trend Analysis:
🟡 Price was moving in an ascending channel 📈 but has broken below the trendline.
🟠 A retest of the broken trendline is happening, suggesting a potential drop 📉.
🔹 Trade Setup:
🔽 Short Entry: Expected rejection from the trendline.
❌ Stop Loss: $85,671 - $85,710 (Above resistance).
✅ Take Profit Target: $81,386 - $81,347 (Bearish target 🎯).
🔹 Indicators & Confirmation:
📊 EMA (9) at $84,254 → Acting as resistance 🚧.
🔄 Break & Retest Pattern → Typical for a bearish continuation 🛑📉.
🔹 Conclusion:
⚠️ Bearish Bias: If the price rejects the trendline, it could drop towards $81,386 🎯.
🚨 Invalidation: If the price breaks above $85,710, the short setup is canceled ❌.

BTC/USDT 15-Minute Chart Analysis🚀 BTC/USDT 15-Minute Chart Analysis 🏆
🔍 Market Overview:
The chart shows Bitcoin (BTC/USDT) price action on a 15-minute timeframe with key resistance & support levels, along with potential trade triggers.
📌 Key Observations:
📈 Strong Resistance (🚧 85,339.85 USDT)
🔥 Major hurdle for buyers! A breakout above this could ignite a rally.
🚀 If BTC closes above this level with volume, we might see a strong uptrend.
🛑 Important Support (🔵 84,727.22 - 84,912.40 USDT)
🛡️ Holding this zone is crucial for bulls to maintain momentum.
❌ Losing this support could trigger a bearish move.
📊 Moving Averages (7, 25, 99 SMA):
🟡 Short-Term SMA (7): Price is testing this moving average.
🔵 Medium-Term SMA (25): Acting as dynamic support.
🟢 Long-Term SMA (99): Still bullish, showing an uptrend bias.
⚡ Trade Triggers:
✅ Long Trigger (📈💰) - If BTC breaks 85,339.85 USDT with volume → 🚀 BUY Opportunity!
❌ Short Trigger (📉🔻) - If BTC drops below 84,727.22 USDT → 🏴☠️ Short setup possible!
📢 Trading Strategy:
💎 Bullish Plan: Watch for a breakout above 85,339.85 USDT with strong volume → 🎯 Targets: 85,500+ USDT.
⚠️ Bearish Plan: If BTC breaks below 84,727.22 USDT, look for a drop to 84,498.52 USDT or lower.
🔥 Final Thoughts:
Bitcoin is in a critical decision zone! 🎯 Breakout = Bullish Rally! ❌ Breakdown = Bearish Move!
📢 Stay Alert! Volume Confirmation is Key! 🎯

Bitcoin (BTC/USD) Short Trade Setup: Resistance Rejection & TargThis chart is a Bitcoin (BTC/USD) 15-minute price chart from TradingView, showing a potential short trade setup based on technical analysis. Here’s a breakdown of the key elements:
1. Resistance Zone & Short Setup
The purple highlighted area represents a resistance level around $85,358.
Price is consolidating within this resistance zone, suggesting a potential reversal.
The expected scenario involves a price rejection from this resistance, leading to a downward move.
2. Moving Averages
EMA (200, blue line) at $83,433: A long-term trend indicator suggesting a strong support zone.
EMA (30, red line) at $84,657: A short-term trend indicator, currently above the price, indicating a potential bearish setup if the price moves below it.
3. Target & Stop-Loss Le

BTCUSDT.. single supporting area , holds or not ??#BTCUSDT.. so market just reached at his most important area is around 81400 to 81600
And that is our in-between range area actually so keep close it and if market hold that area then again buying expected towards range upper line.
Note: below 81400 we will go for CUT n reverse on confirmation.
Good luck
Trade wisely

Why is Eth Falling? ETH/BTC Ratio Hits All-Time Low Since 2020Why is Ethereum Falling? ETH/BTC Ratio Hits All-Time Low Since 2020
The cryptocurrency market is a volatile landscape, constantly shifting and evolving. Recent data has revealed a significant development: the Ethereum to Bitcoin (ETH/BTC) ratio has plummeted to an all-time low since 2020. This stark decline, currently resting at a mere 0.02 has ignited a wave of speculation and concern within the crypto community, raising questions about Ethereum's current standing and future trajectory.
The ETH/BTC ratio serves as a crucial metric for comparing the relative performance of Ethereum against Bitcoin. When the ratio falls, it indicates that Bitcoin is outperforming Ethereum, and conversely, a rising ratio suggests Ethereum's ascendancy. The current dramatic drop highlights a significant divergence in the fortunes of these two leading cryptocurrencies.
The backdrop to this decline is multifaceted. Bitcoin, often seen as the “digital gold” of the crypto world, has exhibited remarkable resilience and strengthened its position. This consolidation is likely driven by several factors, including increased institutional adoption, regulatory clarity in some jurisdictions, and its established reputation as a store of value. These factors have contributed to a sense of stability and confidence in Bitcoin, attracting capital and bolstering its market position.
Ethereum, on the other hand, has faced challenges in maintaining its momentum. While it remains the leading platform for smart contracts and decentralized applications (dApps), it has struggled to keep pace with Bitcoin's surge. Several factors contribute to this relative underperformance.
Firstly, regulatory uncertainty surrounding Ethereum and its classification has cast a shadow over its future prospects. The evolving regulatory landscape, particularly in major economies like the United States, has created a sense of unease among investors. The lack of clear guidelines and the potential for stricter regulations have dampened enthusiasm and limited institutional investment.
Secondly, Ethereum has faced competition from emerging layer-1 blockchains that offer faster transaction speeds and lower fees. These “Ethereum killers,” as they are sometimes called, have attracted developers and users seeking alternatives to Ethereum's perceived limitations. While Ethereum has undergone significant upgrades, such as the transition to proof-of-stake (The Merge), the benefits have not yet translated into a sustained surge in its relative value.
Thirdly, the overall market sentiment has played a role. Bitcoin's narrative as a safe haven and store of value has resonated strongly during periods of economic uncertainty. In contrast, Ethereum, with its focus on innovation and development, is perceived as a riskier asset. When market volatility increases, investors often gravitate towards the perceived safety of Bitcoin.
The decline in the ETH/BTC ratio raises several critical questions. Is Ethereum in trouble? Is this a temporary setback or a sign of a more fundamental shift in the crypto landscape?
While the current situation is concerning, it is essential to consider the long-term potential of Ethereum. Its robust ecosystem, driven by a vibrant community of developers and innovators, remains a significant asset. Ethereum's role in powering decentralized finance (DeFi), non-fungible tokens (NFTs), and other emerging technologies positions it as a crucial player in the future of the internet.
Furthermore, Ethereum's ongoing development efforts, including layer-2 scaling solutions and future upgrades, aim to address its scalability and efficiency challenges. These improvements could potentially revitalize Ethereum's performance and restore its competitive edge.
However, the current market dynamics suggest that Ethereum faces an uphill battle. To regain its footing, it needs to overcome regulatory hurdles, address its scalability issues, and effectively communicate its value proposition to a broader audience.
The cryptocurrency market is notoriously unpredictable, and past performance is not indicative of future results. The ETH/BTC ratio could rebound, or it could continue its downward trajectory. The outcome will depend on a complex interplay of factors, including regulatory developments, technological advancements, and market sentiment.
In the meantime, the low ETH/BTC ratio serves as a stark reminder of the dynamic nature of the cryptocurrency market. It underscores the importance of diversification and the need for investors to consider the risks and potential rewards of each asset carefully.
The current situation also highlights the need for Ethereum developers and community members to focus on the core values of the project, and to continue to innovate and improve the technology. Ultimately, the success of Ethereum will depend on its ability to adapt to the changing landscape and deliver on its promise of a decentralized and equitable future.
In conclusion, while the record low ETH/BTC ratio raises concerns about Ethereum's current standing, it is premature to declare its demise. The cryptocurrency market is constantly evolving, and Ethereum's long-term potential remains significant. However, the current challenges demand a proactive and strategic approach to ensure its continued relevance and success in the years to come.

BTCUSDT BEARISH RISING WEDGE PATTERN IN 15-MI Created This BTCUSDT Chart Analysis In 15-M Tf
Entry: SELL from 83800
Resistance zone : 83800 / 84100
Target Will Be : 82200
BINANCE:BTCUSDT Make Rising wedge, Probably BTC going downtrend.

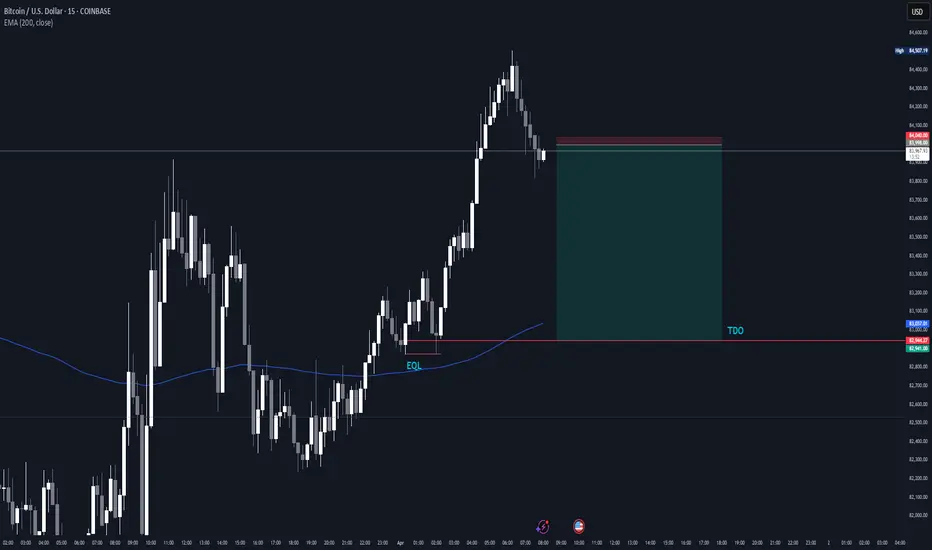
BTC USDT entry on retest of TSO - AM with invalidation above
looking for retracement to TDO & TYO
TYO should act as a huge magnet for price
EQLs below acting as a DOL
If you wanted to risk $100.00 on this trade, then your position size would be 2.36 BTC/USDT.
note: make sure to adjust this position size according to your own risk-management strategy and portfolio size.
Continue to believe in BTCI. Technical Analysis
(1) Support and Resistance Levels
BTC has a strong support at $80,000. It’s withstood selling pressure multiple times. When the price dropped to $82,000, it rebounded, validating this support. $85,000 and $87,000 act as resistance levels. Failed attempts to break through these thresholds show strong selling above these price points.
(2) Moving Average System
While BTC short - term moving averages are down due to price drops, long - term ones stay upward. This means the long - term uptrend isn’t disrupted. A golden cross may form when short - term averages recover and cross long - term ones, supporting upward movement.
(3) Technical Indicators
RSI shows BTC is in oversold zone, hinting at excessive selling. Market recovery may trigger a price rebound. Although MACD gives a bearish signal, the bearish momentum is weakening, indicating a possible reversal.
💎💎💎 BTC 💎💎💎
🎁 Buy@80500 - 81000
🎁 TP 83000 84000 85000
The market has been extremely volatile lately. If you can't figure out the market's direction, you'll only be a cash dispenser for others. If you also want to succeed,Follow the link below to get my daily strategy updates

BTC LONG TP:84,000 31-03-2025Bitcoin is currently presenting a promising bullish formation around the 84,000 mark on both the 1-hour and 2-hour timeframes. This suggests a strong upward momentum developing in the short term. Furthermore, over the next 3 days, we are observing a super bullish setup that indicates the potential for prices to reach between 90,000 and 95,000 by April.
These developments offer an exciting opportunity for traders looking to capitalize on the upward trend. Be sure to follow me closely as we navigate these market movements together and continue to generate profits!

Bitcoin (BTC/USD) 1-Hour Chart Analysis – Professional BreakdownThis BTC/USD 1-hour chart showcases a falling wedge breakout, indicating a potential bullish reversal after a downtrend. The analysis suggests that Bitcoin could move toward its next resistance target of $87,550, offering a profitable long setup for traders. Let's analyze the chart in detail.
1️⃣ Market Context: Understanding the Trend
📉 Previous Downtrend
Before the wedge formation, Bitcoin was in a strong downtrend after reaching a resistance level near $87,000–$88,000.
Sellers took control, creating lower highs and lower lows, forming a descending wedge pattern.
The price declined sharply, reflecting profit-taking, increased supply, and weak demand.
📊 Current Market Setup
Bitcoin found strong support around $81,412, a level where buyers have stepped in multiple times.
The price action compressed into a falling wedge, a classic bullish reversal pattern, indicating that bearish momentum was weakening.
The breakout from the wedge suggests that bulls are regaining control, signaling a potential uptrend.
2️⃣ Key Technical Levels & Market Structure
🔹 Resistance Level ($87,000–$88,000)
This zone has acted as a strong supply area where Bitcoin previously struggled to break through.
If Bitcoin approaches this level again, a break and retest scenario would be ideal for further continuation.
🔹 Support Level ($81,412)
This area has provided multiple bounces, confirming it as a demand zone where buyers are actively defending.
A break below this support would invalidate the bullish setup and could lead to a downward move.
📍 Breakout Confirmation
The falling wedge breakout is confirmed by bullish price action and strong buying pressure.
Bitcoin is now forming higher lows, indicating a potential trend reversal.
3️⃣ Technical Chart Pattern: The Falling Wedge
📌 What is a Falling Wedge?
A falling wedge is a bullish pattern that forms when price consolidates between two converging downward-sloping trendlines before breaking out upward.
✅ Characteristics of a Falling Wedge in This Chart
Series of lower highs and lower lows, forming a contracting price range.
Decreasing bearish momentum, seen by smaller candles near the support zone.
Bullish breakout with strong momentum, signaling a reversal.
💡 Implication:
A breakout from a falling wedge often leads to a strong upward move, especially if volume supports the breakout.
4️⃣ Trading Setup & Strategy
📍 Entry Strategy
A confirmed breakout above the wedge with a strong bullish candle.
A pullback and retest of the breakout level can provide a high-probability entry point.
🎯 Target Levels
Primary Target: $87,550 (Projected based on wedge height).
Extended Target: Above $88,000 if momentum continues.
🛑 Stop-Loss Placement
Below the support zone at $81,412 to minimize risk.
If Bitcoin falls below this level, it invalidates the bullish setup.
5️⃣ Risk & Considerations
⚠️ Potential Risks to Watch
Fake Breakouts: If BTC fails to hold above the breakout level, it could result in a bull trap, causing a price reversal.
Market Volatility: Crypto markets are highly volatile, and external factors (such as macroeconomic news or regulatory updates) could impact price movements.
Resistance Pressure: The $87,000–$88,000 zone could act as a strong resistance, leading to possible consolidation before a decisive move.
✅ Risk Management Tips:
Keep a tight stop-loss below key support.
Adjust position size based on volatility.
Wait for confirmation before entering trades to avoid false breakouts.
6️⃣ Conclusion: Bullish Bias but Caution Advised
📈 Bitcoin is showing signs of a potential uptrend after breaking out from the falling wedge pattern. However, traders should watch for a confirmation of strength before entering long positions.
Key Points to Watch:
BTC needs to hold above $83,500 to sustain bullish momentum.
A strong candle close above $85,000 will further confirm bullish control.
The $87,550–$88,000 resistance zone will be a crucial test for the next move.
🚀 Bullish outlook remains valid unless BTC drops below $81,412.
Hashtags for TradingView Idea
#Bitcoin #BTCUSD #CryptoTrading #TechnicalAnalysis #FallingWedge #CryptoSignals #TradeSetup #TradingStrategy

Bearish Trend Meets Bullish Momentum: Is BTC Ready for a Rebound📉 Bitcoin is currently in a strong bearish trend on higher timeframes, but 📈 the 1-hour timeframe shows a break of structure and bullish momentum. This suggests a potential short-term pullback into the previous range, aligning with the 50% Fibonacci retracement level. 🔄 Additionally, there’s a bearish imbalance above that could be rebalanced. While this presents a possible buy opportunity, ⚠️ it’s a high-risk setup due to the overall bearish trend. Always trade with caution! 🚨
Disclaimer
⚠️ This is not financial advice. Trading involves significant risk, and you should only trade with funds you can afford to lose. Always do your own research and consult a professional if needed. 💡

BTC is expected to hit 85000-86000 again, or even higherBTC has once again built a strong double bottom structural support in the 82000-81000 zone. BTC is likely to continue to rise. Once it breaks through the short-term resistance area near 83600, BTC may usher in a wave of accelerated rise and has the potential to continue to the 85000-86000 zone.
So we can still go long on BTC in the 82500-81500 zone. In addition, once BTC rises as expected, it is likely to grab the market share of gold, so it may also accelerate the decline of gold to a certain extent. This is a point we must be careful about next.
The trading strategy verification accuracy rate is more than 90%; one step ahead, exclusive access to trading strategies and real-time trading settings
BTC Breakout or Breakdown: 83K to 87K or Bust to 73K?BTC’s standing at a fork in the road, and it’s itching to make a move! If it pushes past 83,121, we’re looking at a smooth jump to 84,600—like a quick win you can almost taste. Keep the good vibes going, and 87,000 might just be the big payoff. But hold up—if it stumbles below 81,300, things could get messy. The bears might crash the party, pulling us down to 80K, then 79,900. And if the slide keeps going? We’re talking 74,700, maybe even a rough landing between 73,600 and 73,000.
Kris/Mindbloome Exchange
Trade Smarter Live Better

Bitcoin's Rocky Quarter: Tariffs, Whales, and Volatility Loom
Bitcoin's first quarter of 2025 has concluded with a whimper, marking its worst Q1 performance since the tumultuous bear market of 2018.1 While gold has surged to record highs, fueled by geopolitical tensions and US trade tariffs, Bitcoin has struggled to maintain momentum, leaving traders bracing for potential further volatility. This week’s preview reveals a confluence of factors that could significantly impact Bitcoin's price trajectory.
A Disappointing First Quarter
The initial months of 2025 were anticipated to be a period of growth for Bitcoin, particularly with the anticipation surrounding the halving event. However, the cryptocurrency failed to deliver on these expectations. Instead, it experienced a period of stagnation and even decline, contrasting sharply with the robust performance of traditional safe-haven assets like gold.
Several factors contributed to this underwhelming performance. The escalating trade tensions, particularly the US tariffs, have injected uncertainty into global markets, diverting capital towards established safe-haven assets.
Tariffs and Trade Tensions: A Persistent Headwind
The US imposition of trade tariffs has emerged as a significant headwind for Bitcoin. These tariffs, designed to protect domestic industries, have disrupted global trade flows and created a climate of economic uncertainty.2 Investors, wary of potential market disruptions, have sought refuge in traditional safe-haven assets like gold, which has historically outperformed during periods of economic instability.
The impact of these tariffs extends beyond immediate market reactions. They signal a potential shift towards protectionist policies, which could have long-term implications for global trade and investment flows. Bitcoin, often touted as a decentralized and borderless asset, is particularly vulnerable to disruptions in global trade and capital flows.
Whale Activity and Market Manipulation
Adding to the complexity of the market is the activity of large Bitcoin holders, often referred to as "whales."3 These entities, possessing significant amounts of Bitcoin, can exert considerable influence on market prices through large buy or sell orders. Recent observations suggest increased whale activity, potentially contributing to the volatility and price fluctuations.
Concerns about market manipulation have also resurfaced. The decentralized nature of Bitcoin, while a core strength, also presents challenges in terms of regulation and oversight. This lack of centralized control can create opportunities for manipulation, leading to price swings that are not necessarily reflective of fundamental market dynamics.
Bitcoin Bears Tighten Grip: Where’s the Next Support?
The recent price action indicates that Bitcoin bears are tightening their grip. The failure to sustain upward momentum has emboldened sellers, leading to a downward trend. Traders are now closely monitoring key support levels, anticipating potential further declines.
Identifying these support levels is crucial for understanding the potential trajectory of Bitcoin's price. Technical analysis, using tools like Fibonacci retracement levels and moving averages, can help traders identify potential areas of support where buying pressure may emerge. However, the volatile nature of Bitcoin makes it challenging to predict these levels with certainty.
Gold vs. Bitcoin: A Comparative Analysis
The stark contrast between gold's recent performance and Bitcoin's struggles has reignited the debate about their respective roles as safe-haven assets. Gold, with its long history and established reputation, has benefited from the current climate of uncertainty.
However, Bitcoin proponents argue that its decentralized nature and limited supply make it a superior store of value in the long term. The comparison between the two assets highlights the evolving nature of safe-haven assets and the growing acceptance of digital currencies. The quote "Gold has taken 26 years to 10X. Bitcoin has taken 4 years to 10X" shows the potential for rapid growth, but also its volatility.
Looking Ahead: Volatility and Uncertainty
The coming week promises to be a period of significant volatility for Bitcoin. Traders should brace for potential price swings, driven by a combination of factors, including:
• Continued Trade Tensions: The ongoing trade disputes and potential for further tariffs are likely to continue to impact market sentiment.
• Whale Activity: Large buy or sell orders from whales could trigger significant price fluctuations.
• Regulatory Developments: Any regulatory announcements or policy changes could have a substantial impact on Bitcoin's price.
• Macroeconomic Factors: Inflation data, interest rate decisions, and other macroeconomic indicators will continue to influence investor behavior.
•
In conclusion, Bitcoin's disappointing first quarter has set the stage for a period of heightened volatility. The confluence of trade tensions, whale activity, and market manipulation creates a challenging environment for traders. While the long-term potential of Bitcoin remains a subject of debate, the immediate future is marked by uncertainty and the need for caution.

Grasp the trend and analyze the full range of BTC longsTechnical analysis: Based on in-depth technical analysis, the current BTCUSD decline has slowed down, and there are signs of building double bottom support. The 50-day moving average and the 200-day moving average form a golden cross, the MACD indicator continues to strengthen and the bar chart continues to expand. As BTCUSD stops falling, market sentiment is gradually warming up, institutional funds continue to flow in, fundamental support is solid, and the upward momentum may gradually strengthen. It is the right time to go long.
BTCUSD operation strategy: Go long in the 82500-81500 area. Target 83000-84000
Trading discipline: 1. Don't blindly follow the trend: Don't be swayed by market sentiment and other people's opinions, operate according to your own operation plan, market information is complicated, and blindly following the trend is easy to fall into the dilemma of chasing ups and downs.
2. During the transaction, we will continue to pay attention to news and technical changes, inform us in time if there are changes, strictly implement trading strategies and trading disciplines, move forward steadily in the volatile market, and achieve stable asset appreciation.

ETH.DOMINANCE Bullish divergenceIn ETH.DOMINANCE chart show clear bullish divergence on daily timeframe which means ETHUSD and ALTCOINS in bullish momentum in coming days. Stay focus on bullish side and ready for uptrend.

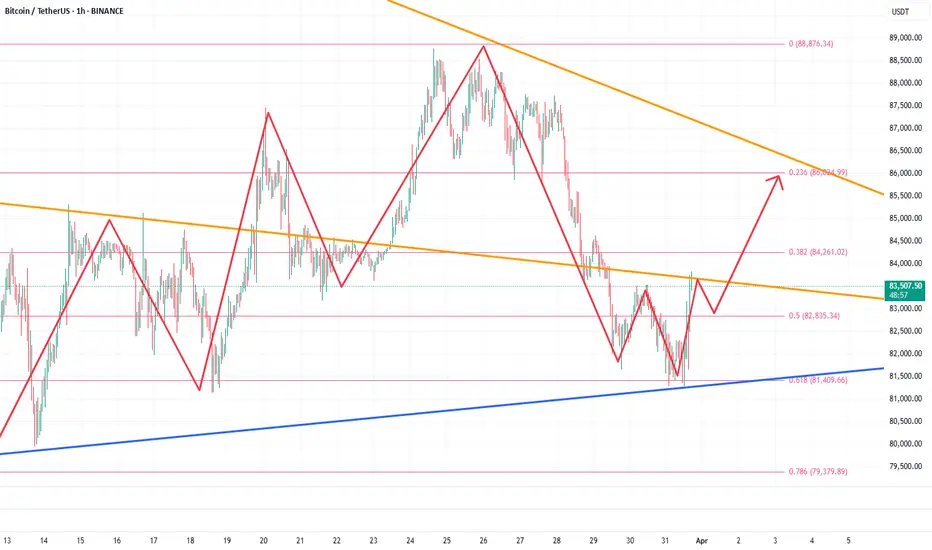
Bitcoin hit that 236 Fib circle I warned you about- and now ?As we come to the end of the week, we see the potential for further drop as PA slides along that 236 Fib circle. ( Red)
It NEVER ceases to amaze me how PA reacts to Fib circles and yet, as if by magic, there is some Macro News at exactly the same time
On this occasion, It seems the US inflation figures on Friday caused this Drop in price.
This Chart is the daily verion of the Weekly chart i often post about weekly candle closes.
I trust this chart
The chance for a drop to arounf 75K is very real and if that fails, down to the 2 Fib extension arounf 68K, though I think that is unlikely
We do need to watch on which side of thois Fib circle PA sits tomorrow. - Idealy, it breaks through tonight and next week candle sits on the "Support" side on the circle.
If it remains as resistance, A Steep drop is highly likely.
In my opinion.
Daily MACD is turned down, heading towards it ssignal line. If that crosses, the Daily becomes very BEARISH
We have to wait and see what happens and be ready to react.
I do have SPOT buy orders around 78 K
If we Drop Lower, I will dig up some funds and buy more lol
WE WAIT FOR WEEKKY CLOSE

Bearish Daily Setup - BTC/USD
### **📉 Bearish Daily Setup - BTC/USD**
**Bias**: Bearish
**Context**: Daily DR (Dealing Range) is broken, and price is rejecting premium level.
---
### 🧠 **Narrative:**
Price traded into a daily FVG (Fair Value Gap) near **premium zone**, then formed a lower high. The daily **DR (Dealing Range)** was broken to the downside, showing bearish intent. We also see rejection from a marked supply area (pink zone), confirming seller presence.
---
### 📌 **Entry:**
Sell entry around **84,600** (near retest of daily FVG & imbalance zone)
---
### 🎯 **Targets:**
- **TP1**: 76,555 (Recent low / liquidity pool)
- **TP2**: 74,000 (Clean imbalance area)
- **TP3**: 73,383 (Final liquidity draw)
---
### 🛑 **Stop Loss:**
Above recent high / supply zone
**SL**: 88,762
---
### 🔢 **RRR**: Approx. **1:4** (Excellent reward-to-risk)
---
### 🧩 **Extra Confluences:**
- Daily FVG (imbalance) filled and rejected
- Supply zone respected
- DR broken
- Momentum shifted bearish

Bitcoin (BTC/USD) Breakdown – Rising Wedge Signals Further Drop!1. Chart Overview
This 4-hour BTC/USD chart from BITSTAMP presents a well-defined Rising Wedge pattern, which is a bearish reversal structure typically signaling an upcoming price decline. After a strong upward movement, Bitcoin formed a wedge pattern with higher highs and higher lows converging. This indicates weakening bullish momentum, leading to a confirmed breakdown.
2. Key Technical Elements & Market Structure
A. Rising Wedge Formation (Bearish Pattern)
A rising wedge is a bearish reversal pattern that appears after an uptrend, showing gradually weakening buying pressure.
The chart shows that price action was following an upward sloping support and resistance trendline.
The higher highs and higher lows formed within the wedge indicate a loss of bullish momentum.
Eventually, the price broke below the lower trendline, confirming a bearish breakdown.
B. Breakdown Confirmation
A decisive bearish candle broke below the wedge's lower trendline, confirming the downward move.
After breaking down, the price attempted a small retest of the wedge’s support, which has now turned into resistance.
This successful rejection from the previous support adds to the bearish confirmation.
C. Support & Resistance Levels
Resistance Level ($88,547):
This zone acted as a strong supply area, where previous bullish moves were rejected.
If BTC/USD attempts to recover, this area may provide selling opportunities.
Support Level ($79,193):
This is the next downside target, aligned with previous price consolidation zones.
A break below this support could trigger further selling pressure.
3. Trading Setup & Strategy
A. Short Trade Setup
Entry Point: After BTC/USD confirmed the breakdown of the rising wedge.
Stop Loss: Placed slightly above the $88,547 resistance level to limit risk.
Target Price: A decline towards $79,193, which aligns with the previous major support zone.
B. Bearish Market Sentiment
BTC/USD is currently trading below the wedge, reinforcing bearish bias.
A successful retest of the broken wedge support would validate further downside continuation.
If price remains below the $85,000 level, sellers are likely to maintain control.
4. Market Outlook & Next Price Action
Bearish Scenario
If BTC fails to reclaim the wedge breakdown level, further downside is expected.
A breakdown below $80,000 psychological level could increase selling momentum toward $75,000-$77,000 levels.
Volume analysis suggests that selling pressure is increasing.
Bullish Scenario (Invalidation)
If BTC/USD reclaims the $88,547 resistance and closes above it, the bearish bias could weaken.
Bulls need to break above the rising wedge resistance trendline for a reversal.
5. Conclusion & Trading Plan
The Rising Wedge pattern breakdown confirms a bearish outlook for BTC/USD.
The risk-reward ratio for a short trade is favorable, targeting a move down to $79,193.
Traders should watch for volume confirmation and trend continuation signals before entering.
Key Takeaways
✅ Bearish Bias confirmed after the Rising Wedge breakdown.
✅ Short Position setup with entry, stop loss, and target defined.
✅ Resistance at $88,547 - Failure to break above it strengthens the bearish case.
✅ Target at $79,193 - A strong support area where buyers may step in.
6. Tags for TradingView Post
#BTC #Bitcoin #Crypto #TradingSetup #TechnicalAnalysis #CryptoTrading #BearishPattern #RisingWedge #Breakdown #ShortTrade #PriceAction #SupportResistance #MarketAnalysis
Would you like any further refinements or additional insights? 🚀
