BTC/USDT (Bitcoin) LONG SET UPEntry Price 1: $84,000
Entry Price 2: $83,500
Stop Loss: $82,000
Take Profit 1: $86,000 (Close 25%)
Take Profit 2: $88,000 (Close 50%)
Take Profit 3: $90,000 (Close 75%)
Take Profit 4: $92,000 (Close 100%)
Status: ACTIVE
Btcusdanalysis

Market overview
WHAT HAPPENED?
Last week, bitcoin tested the key zone of $85,000-$88,000 (volume zone). After receiving the seller's reaction, we formed a local structure that questioned the global decline.
In the daily analysis on TradingView on Friday, a support zone of $84,800-$83,500 (pushing volumes) was noted. After the test, we received a reaction and confirmed the buyers' intentions to move the quote to higher levels.
WHAT WILL HAPPEN: OR NOT?
At the moment, longs are a priority. The confirmation of this scenario will be overcoming the $87,500 level. The target for the movement is the $95,000 mark, and there is no significant resistance before it.
Despite the fact that we’re in an uptrend, there are no volume zones of the buyer up to the minimum mark of $76,000. Therefore, with strong market activity of the seller at the current level, it’s possible to resume the decline to the lows.
Sell Zones:
$95,000–$96,700 (accumulated volumes)
$97,500–$98,400 (pushing volumes)
$107,000–$109,000 (volume anomalies)
Buy Zones:
$77,000–$73,000 (volume anomalies, pushing volumes)
IMPORTANT DATES
About the macroeconomic news this week:
• Monday, March 24, 13:45 (UTC) — publication of the index of business activity in the manufacturing sector and the index of business activity in the US services sector for March;
• Tuesday, March 25, 14:00 (UTC) — publication of the U.S. consumer confidence index for March and data on new home sales in the United States for February;
• Wednesday, March 26, 7:00 (UTC) — publication of the UK consumer price index compared to February 2024;
Wednesday, March 26, 10:00 (UTC) — publication of the UK spring budget forecast;
• Thursday, March 27, 12:30 (UTC) — publication of US GDP for the 4th quarter of 2024, as well as the number of initial applications for US unemployment benefits;
• Friday, March 28, 7:00 (UTC) — publication of UK GDP for the 4th quarter of 2024;
• Friday, March 28, 12:30 (UTC) — publication of the basic price index of US personal consumption expenditures for February, as well as in comparison with February 2023.
*This post is not a financial recommendation. Make decisions based on your own experience.
#analytics
BTC/USDTas shared earlier,the market remains bullish as long as it holds above the 50 EMA and weekly Trendline.

Bitcoin (BTC/USD) 4H Analysis: Bullish Breakout or Pullback?🔍 Key Observations:
🔹 📈 Trendline Breakout: The descending trendline (white) has been broken, signaling a potential uptrend.
🔹 📍 Support & Resistance Zones:
🟢 Strong Support (~$80,349 - $82,000): 📉 If price drops, this zone could act as a bounce area. 🛑 Stop-loss is placed below.
🟡 Resistance (~$86,000 - $88,000): 🔄 Currently testing this level—either a breakout or a rejection could follow.
🔵 Next Target (~$94,000): 🚀 If Bitcoin pushes above resistance, this could be the next stop.
📊 Possible Price Action Scenarios:
✅ Bullish Path:
🟢 Breaks Above $86,000 → Targets $94,000 🚀
🔄 Small retest of support before continuing up 📈
❌ Bearish Path:
❌ Rejected at $86,000 → Pullback to $82,000 🔽
📉 If support fails, price may drop further
🎯 Conclusion:
🔥 Bullish Bias: 🟢 A breakout above $86,000 increases the chance of hitting $94,000+.
⚠️ Watch for retests! 🔄 A pullback before an upward move is possible.
🚀 Final Thought: If BTC **

‘Cagey’ Rebound on BTC/USD?Since BTC/USD (Bitcoin versus the US dollar) rebounded from the 200-day simple moving average (SMA) earlier this month at US$78,111, speculative bullish interest has been uninspiring.
Further Downside
As far as I can see, the major crypto pairing demonstrates scope to continue exploring south until it reaches support from US$68,926 on the monthly timeframe (I also noted this in previous analysis), which (somewhat) helps explain why technical demand from the 200-day SMA could be lacking.
Another technical observation supporting the lacklustre bullish showing is the Relative Strength Index (RSI), recently exiting overbought territory and fast approaching the neckline of a double-top pattern on the monthly chart, extended from the low of 60.44. A break beyond this line highlights the RSI’s 50.00 centreline threshold as a possible downside target. Adding to this, the RSI on the daily chart may have rebounded from oversold territory (forming a possible double-bottom), but remains south of 50.00 and is shaking hands with resistance around 45.46.
Monthly/Daily Support Area Warrants Attention
While I am not saying that a move to the upside won’t be seen, the path of least resistance appears to be to the downside, at least targeting space below the 200-day SMA at daily support from US$73,575. So, for me, the playbook here will be watching for possible fading opportunities at the underside of the daily range between US$108,396 and US$91,591 (which happens to converge closely with the 50-day SMA at US$93,608 and trendline resistance, extended from the all-time high of US$109.580). Alternatively, we could see price sell-off at current levels and aim for the noted daily support. It is this level, coupled with monthly support mentioned above at US$68,926, that I expect to see bulls attempt to make a show.
Written by FP Markets Market Analyst Aaron Hill

Bitcoin (BTCUSD) Falling Wedge Breakout – Bullish Setup! 📌 Overview of the Chart Setup
This daily Bitcoin (BTC/USD) chart presents a technical breakout from a falling wedge pattern, a well-known bullish reversal signal. The price has been forming lower highs and lower lows over the past months, consolidating within a tightening structure. However, the current price action suggests an early breakout attempt, which could lead to significant upside movement in the coming weeks.
Let’s break down the key levels, technical insights, and trading opportunities visible in this chart.
📉 Chart Pattern: Falling Wedge (Bullish Reversal)
🔹 What is a Falling Wedge?
A falling wedge is a bullish continuation or reversal pattern characterized by converging downward-sloping trendlines. It typically signals a loss of bearish momentum, leading to a breakout to the upside.
🔹 Key Observations in the Chart
The price has been moving inside the falling wedge structure, with clear lower highs and lower lows.
The support level around $75,000-$80,000 has been repeatedly tested, forming a strong demand zone.
A trendline breakout has occurred, suggesting that bulls are regaining control over the price action.
Volume is expected to increase upon a confirmed breakout, reinforcing the bullish momentum.
📊 Important Technical Levels
1️⃣ Support & Resistance Zones
📌 Support Level: The $75,000-$80,000 zone has acted as a strong base, preventing further downside. Buyers have stepped in multiple times here.
📌 Resistance Level: The $95,000-$100,000 range represents a historical resistance where price has struggled to break through.
2️⃣ Trendline Breakout
The chart clearly shows a breakout above the falling wedge’s upper boundary, indicating a potential trend reversal from bearish to bullish.
If this breakout holds, Bitcoin could see strong buying pressure pushing it toward its next major resistance level.
📈 Trading Strategy & Setup
🔹 Entry Confirmation
To enter a long position, traders should wait for:
✅ A daily close above the wedge resistance (confirmed breakout).
✅ A successful retest of the breakout zone, which strengthens the bullish case.
A breakout retest is ideal because it provides a lower-risk entry point, ensuring the breakout is legitimate rather than a false move.
🔹 Target Price Projection
Using the height of the falling wedge as a projection, the potential price target is set at $118,000.
This level aligns with a 35%+ upside from the breakout zone.
Bitcoin must clear the $95,000-$100,000 resistance before reaching the final target.
🔹 Stop Loss Placement
A stop loss is positioned at $59,896, slightly below the previous major support zone.
This ensures that if the breakout fails, losses are minimized while still allowing price fluctuations within expected volatility.
🔹 Risk-to-Reward Ratio
Entry around breakout level (~$87,000)
Target: $118,000 (35% upside)
Stop Loss: $59,896 (~30% downside)
Risk-to-reward ratio: ~1:3, making this an attractive trade setup.
📢 Market Psychology & Sentiment
Why This Pattern Matters?
A falling wedge represents seller exhaustion. Over time, the bearish pressure weakens, leading to a bullish breakout.
If Bitcoin can maintain this breakout, momentum traders and institutional investors may step in, accelerating the rally.
Breaking above the resistance at $95K-$100K would confirm bullish dominance, potentially leading to new all-time highs.
Potential Risks
❌ Fake Breakout: If Bitcoin fails to hold above the wedge resistance, we may see a pullback to support before another breakout attempt.
❌ Macro Factors: External factors like regulatory news, interest rate decisions, and market-wide sentiment could impact price action.
❌ Bitcoin Dominance: If altcoins start rallying, some capital may rotate out of Bitcoin, slowing the upside move.
🚀 Final Thoughts: A High-Probability Bullish Setup
✅ The falling wedge breakout suggests a strong bullish shift, with a 35%+ potential upside.
✅ A confirmed breakout above $95K-$100K will act as a final confirmation before the next leg up.
✅ Risk is managed with a stop loss at $59,896, ensuring downside protection.
🔹 Best trading approach? Wait for confirmation, manage risk, and let the trend develop.
Would you like additional insights on entry techniques, volume confirmation, or potential invalidation points? 😊

BTC Today's analysisDuring the recent continuous and close tracking of the cryptocurrency market dynamics, I have always maintained an optimistic view on the price trend of BTC.
As it turns out, this prediction has been strongly validated by the market. Since the last market analysis, the price of BTC has shown a strong upward momentum, steadily climbing from an initial price of around 84,000 to the current remarkable 85,200.
💎💎💎 BTC 💎💎💎
🎁 Buy@83500 - 84000
🎁 TP 86000 - 87000
The market has been extremely volatile lately. If you can't figure out the market's direction, you'll only be a cash dispenser for others. If you also want to succeed,Follow the link below to get my daily strategy updates

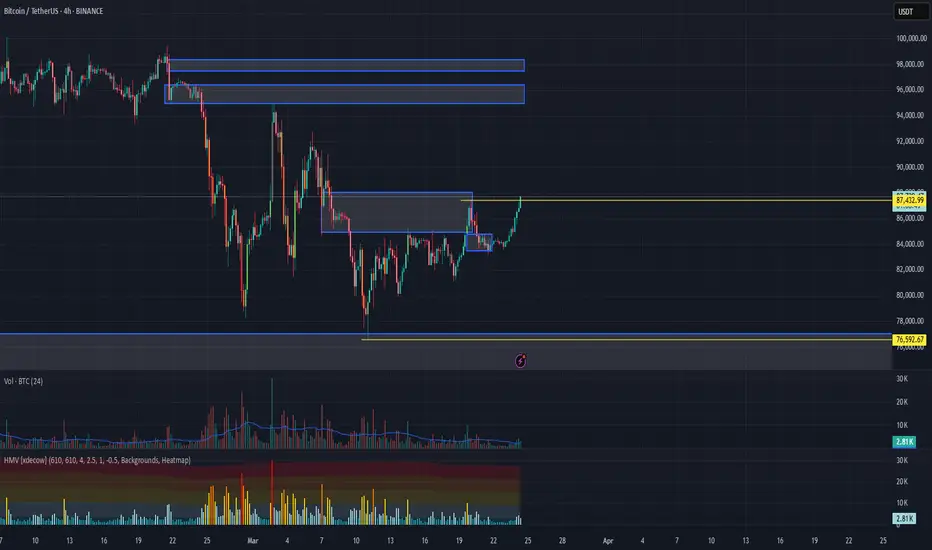
Bitcoin at a Critical Juncture – Breakout or Breakdown? 📉 BTC is at a key decision point! After pulling back from recent highs, it's now consolidating within a range, sitting right in the middle of the previous price swing. I'm keeping a close eye on this zone—if price breaks out, a high-probability trade opportunity could emerge.
🎯 In this video, we dive deep into price action and market structure, breaking down a potential trade setup—if the market aligns with our strategy.
🚨 Trade smart, manage risk—this isn’t financial advice! 🚀🔥

A Good Example of How Market Makers Manipulate BTC Price- As liquidation areas are visited, price drops back down, retraces back up just to fill the price imbalance before continuing to for a new low.
- The latest price action is similar to the previous, and there is a very good likelihood that the Bitcoin price will create another major new low
- Also take note of the fake out in the ascending channel to trap traders into placing long positions. The fake out was also able to trigger stop losses from short positions.
Let me know what you guys think and comment below.

BTC/USD Trading Analysis – Double Bottom & Rising Wedge BreakoutThis BTC/USD 4-hour chart showcases a potential bullish breakout setup based on technical patterns, key support and resistance levels, and price action analysis. The chart suggests a trend reversal following a downtrend, with signs of bullish momentum building up.
Let's break down the full technical analysis, covering the chart structure, key levels, price patterns, and trading strategy.
1. Market Structure & Identified Patterns
A. Double Bottom Reversal – Strong Bullish Signal
A double bottom pattern has formed, which is a bullish reversal signal that indicates the end of a downtrend.
This pattern consists of two significant low points (Bottom 1 and Bottom 2) near the $80,000 - $81,000 support zone.
The pattern confirms strong buying interest at this level, preventing further price drops.
A breakout above the resistance level would confirm the pattern’s validity, signaling a move toward higher targets.
B. Rising Wedge Formation – Potential Bullish Breakout
The price action is consolidating in a rising wedge, forming higher highs and higher lows within a narrowing range.
A rising wedge often suggests a potential breakout.
Since this wedge forms after a double bottom, the breakout is expected to be bullish, rather than a bearish breakdown.
If the price breaks above the wedge’s upper trendline, it will confirm a strong upward momentum.
2. Key Support & Resistance Levels
Support Levels:
Major Support Zone (80,000 – 81,000):
This level has been tested twice, confirming buyer strength.
It serves as the foundation for the double bottom pattern.
Stop Loss Level (72,921):
If the price drops below this level, it would invalidate the bullish setup.
This level is strategically placed to manage risk and protect against potential downturns.
Resistance Levels:
First Resistance Zone (95,000 – 100,000):
This is a critical level, as the price has faced multiple rejections here.
A breakout above this zone would confirm a strong bullish trend continuation.
Take Profit Targets:
TP1 (108,481): The first take-profit target aligns with previous highs and is a logical point for partial profit booking.
TP2 (114,372): This is the second profit target, calculated based on Fibonacci extensions and historical price movements.
3. Trading Strategy & Execution Plan
A. Entry Strategy
To execute a successful trade, we need to wait for confirmation of the breakout.
Ideal Entry: After a strong breakout above 95,000 – 100,000, indicating bullish momentum.
Confirmation Factors:
Increased trading volume → Signals strong buying interest.
Candle close above resistance → Confirms breakout.
Retest of broken resistance as support → Strengthens bullish continuation.
B. Risk Management
Stop Loss Placement: Below 72,921, ensuring limited downside risk.
Risk-to-Reward Ratio: The trade setup aims for a 1:3 or better risk-to-reward ratio.
C. Potential Scenarios
✅ Bullish Breakout:
If BTC breaks and holds above 95,000 – 100,000, we can expect a rally toward 108,481 (TP1) and 114,372 (TP2).
❌ Bearish Rejection:
If BTC fails to break resistance, it could retest 80,000 or drop lower, invalidating the bullish setup.
4. Final Thoughts – What to Expect?
This BTC/USD 4-hour chart analysis provides a high-probability bullish trade setup, supported by:
✅ Double Bottom Formation → Strong Reversal Signal
✅ Rising Wedge Breakout Potential → Momentum Building
✅ Key Resistance Breakout Levels Identified
📌 Conclusion:
If Bitcoin breaks above 95,000 – 100,000, expect a major bullish move toward 108,481 and beyond. However, if resistance holds, we might see a retest of lower support levels. Risk management is essential for a successful trade execution. 🚀

$BTC to the MoonFor BTC, we are still sticking to our "to the moon" analysis 🚀 hehehe. We remain in a trade with the following parameters:
Entry: 81,758
Stop Loss: 79,901
Target: 109,390
This is our trade operation, but we have also increased our hold position at this entry point, aiming for the very long term. Currently, our average price is 42,350.
What reinforces our analysis?
By analyzing the daily and H4 time frames, we can observe:
✅ Bullish continuation purges
✅ SMT (Smart Money Theory) confirming the movement
✅ A shift in the state of price delivery
With that in mind, I remain bullish, and may the moon be just the first target! Let's go, BTC! 🚀

BITCOIN HAS TO BREAK LONG TERM TREND by DEC - SQUEEZE APEX DECI have posted this before and I post it again now, just months away from a CRUCIAL point for Bitcoin PA
As with any time scale trading chart, An Apex is a point of reaction. PA usualy reacts BEFORE the Apex is met.
This Giant Apex is in DEC 2025
Every single ATH in the life span of Bitcoin has been rejected by the Arc of Resistance that is overhead.
We can also see how from the ATH in 2011, a trend line was formed that has acted as Support ever since 2012. PA has never dropped below this line.
So, as you can see, PA has been in a diminishing "Sandwich" and Now, we are coming to the Crunch
We can see how the ATH's have been a reducing % Rise ever since this point also.
And you will notice how this number on the chart reduces each time, even though the real value is increasing.
Low to ATH A ( ATH 2011) - 3,465,178%
Low to ATH B ( ATH 2013) - 49,670 %
Low to ATH C ( ATH 2017) - 9,865 %
Low to ATH D ( ATH 2021) - 2,148 %
E is not over yet but coing on current ATH we have
Low to ATH E ( ATH 2025) - 575 %
So, you see the reduction of % rise, held back all along by the ARC Of RESISTANCE
What is interesting, is that since PA has been in the chanel formed in 2011, when comapred to each other, we have been seeing a rise of 20% of the previous rise ( on average )
This closer chart shows you this in more detail
I will ignoew the A - B as thia is out of channel
C-B = 19.6 %
D-C = 21.77 %
Currently E-D = 26.7 %
As you can see, we are currently OVER that average % Rise.
And we are also heading into a tight APEX in Dec.
The expected 200K ATH this cycle will take us out of the pattern, out of the Apex and out of the 20 % average rise of previousl
This really is CRUNCH TIME for Bitcoin
The REALLY interesting thing is, What would be Next ?
This would break the Cycle routine.
We may already have broken that as described in previous charts of mine from years ago
But what IS Certain is that something HAS to happen.
This Cycle ATH will reveal a HUGE amount but we have yto Wait and see what will happen

BTC You'll regret it if you don'tBTC has been floating at 84000 today, yesterday it touched resistance at 87000, today's resistance is still valid, with the Fed's information, gold's rally has been full down, and more people will pay attention to BTC next
💎💎💎 BTC 💎💎💎
🎁 Buy@83500 - 84000
🎁 TP 86000 - 87000
The market has been extremely volatile lately. If you can't figure out the market's direction, you'll only be a cash dispenser for others. If you also want to succeed,Follow the link below to get my daily strategy updates

Bitcoin Market Analysis: Bullish OutlookCurrently, BTC price hovers around 84,000, showing a clear consolidation. In recent trading, bulls and bears are in a tight tussle at this price range.
Support Level Analysis
I peg the support at 81,000 - 82,000. Technically, this range is significant. Historical data indicates that as the price approaches this area, strong buying momentum emerges. During previous market corrections, this price band effectively halted sharp downward trends. Moreover, the concentrated distribution of holdings within this range implies that numerous investors have cost - bases here. Their unwillingness to see the price drop below their investment costs acts as a buffer, propping up the support.
Resistance Level Analysis
The resistance stays at 87,000. K - line trends reveal intense selling pressure when price approaches this mark. Multiple prior break - through attempts failed, with price retreating each time. This implies a large number of trapped or profit - taking positions at 87,000. As price nears, investors rush to sell, creating a strong resistance that curbs upward movement.
Bullish Reasons
Despite the current consolidation, I'm bullish. Economically, the global recovery boosts investors' risk appetite, drawing more to BTC as an innovative asset. Growing institutional interest, with BTC being added to portfolios, provides a solid price - rising base. Market sentiment is positive on Bitcoin's long - term prospects, buoyed by blockchain tech growth and wider applications. Technically, long - term indicators like the upward - diverging moving average show the long - term uptrend intact. Even with reduced trading volume during consolidation, market activity remains. New positive factors could easily break the current range and push price towards the resistance.
💎💎💎 BTC 💎💎💎
🎁 Buy@83500 - 84000
🎁 TP 86000 - 87000
The market has been extremely volatile lately. If you can't figure out the market's direction, you'll only be a cash dispenser for others. If you also want to succeed,Follow the link below to get my daily strategy updates

XAUUSD- short term downtrend H3 continue, sidewayGold Short-Term Downtrend (H3):
Gold is showing bearish momentum on the 3-hour chart, forming lower highs and lower lows. Sellers remain in control unless key resistance levels are broken. Watch for potential support around recent swing lows.

BTC Buy SETUP for todayThis is a BTCUSD buy setup with ENTRY< STOP LOSS TAKE PROFITS LEVES for today 23 of March 2025
