Bitcoin (BTC/USD) Technical Analysis – Bullish Setup🔵 Key Levels:
🎯 Target Point: 87,050.22 (🔼 Expected upward move)
🔵 Support Zone: 79,833.82 (🛡️ Strong demand area)
🔴 Current Price: 82,254.27
📊 Analysis:
🔵 RBS + RBR Zone (🔄 Role Reversal Support & Rally Base Rally) - Possible entry point for a long position.
🟠 Stop Loss: Below 79,833.82 (🚨 Risk Management)
🟣 Resistance Zone: Near 83,000 (🔄 Possible short-term pullback)
📈 Strategy:
1️⃣ Price might retrace to the blue zone (support) before continuing upward.
2️⃣ If it holds, 🚀 potential rally towards 87,050.22 🎯
3️⃣ If it breaks below support, ⚠️ possible downside risk.
✅ Conclusion:
A bullish setup with a 7.45% profit target 📊
Risk managed with a stop loss below support ⚠️
Btcusdbuy

BTCUSDT long idea3 confirm for long position on BTC
1. Bitcoin is going to retest on 74k-72k strong support zone.
2. Also its making massive bullish pattern.
3. Crashed +10% in 24 hours. So potentially bounce back hard.
Hopefully bitcoin can make new ATH.

BTC/USD Bullish Breakout Setup – Targeting $85,477 with 5.62% UpThe price has recently surged above both the 30 EMA (red) and 200 EMA (blue), signaling a strong bullish move.
The EMAs are beginning to turn upward, particularly the 30 EMA, suggesting short-term bullish momentum.
Key Levels Identified
Entry Zone (Purple Support Zone):
Around $80,105 – a potential buy zone after a pullback.
Labeled with STOP LOSS, indicating the invalidation level if price drops below this zone.
Target Zone (Purple Resistance Zone):
Around $85,477 – this is the target level, marked as “EA TARGET POINT”.
Offers a potential move of +5.62% or 4,551.83 points.
Price Action
Price broke above a previous resistance (now support) and has pulled back slightly.
The projected move suggests a bullish continuation after a minor pullback and consolidation.
Risk-Reward
Good risk-reward ratio implied with the large gap between the stop loss and target.
Stop loss is tight, just below the purple support zone (~$80,105).
Projection
The blue lines and annotations suggest a bullish play, with an expected upward movement after retesting the support.
✅ Possible Trade Idea
Buy Zone: ~$80,105 (on a confirmed retest)
Stop Loss: Slightly below $80,105
Target: ~$85,477
Expected Move: +5.62%
🔍 Additional Notes
Keep an eye on price behavior around the support zone—confirmation (e.g., bullish candle pattern or rejection wick) strengthens the entry.
The strong move leading to the breakout suggests high momentum, which could mean limited pullback.
News or macro developments could invalidate technicals—be aware of external factors.

BTC/USDTafter reclaiming the 50-week ema,btc enters acceration.
if it fails to hold,then it's a bear market.

$$$ BTCUSD MACRO-BULLISH $$$ 1W CHART $$$BITFINEX:BTCUSD 1W Chart
There are many reasons to look at this weekly chart and see that there's absolutely no reason to be bearish on Bitcoin yet.
Holding strong r/s flip support.
Holding regression trend.
Holding parabolic trend.
Stoch RSI at the bottom.
Weekly bullish divergence.
Assuming this plays out in a way that's similar to the last local bottom, the current target is around $134k-$135k.
It would take a lot to invalidate all of these bullish indicators, but if that does somehow happen, with a CLOSE of the weekly candle that invalidated these, then It's pretty much definitely over for a loooong time.
NFA blah blah blah..

BTCUSDT 1DBTC ~ 1D Analysis
#BTC Let us now pray that the trade war will be completed so that this bullish pattern goes according to plan.

BTC Possible buying opportunity Possible buying opportunity if Weekly 50 SMA and Fib level 61.80% hold the price.

BTC.DThe Bitcoin dominance is currently at this level, and we might see higher targets. I don't anticipate a decline in Bitcoin's value. Please share your thoughts in the comments.

Bitcoin Lost 50 SMA overnight, what next ? - still BULLISH.In a week where I am still expecting the beginnings of a bounce, we saw a Major Drop overnight.
This has pushed PA below the 50 SMA that I was hoping PA would bounce off, as it had previously.
So, Whats Next ?
It is not as bad as it may appear but CAUTION is a Very Very good idea.
There are a number of lines of support below and if we do not find any soon, 73K is the next line of Support. then down to 71K and ultimately, the long term line at 64K, though I still doubt we will get that low.
But FEAR is BIG...be a Vulture..Buy the remains of people Fear...Bitcoin IS a Scarce asset and people Still want it.
The Weekly MACD
The MACD is now in the bounce Zone. Yes, it may drop below neutral if this "Tariff Fear" continues. But Technically, We now have the ability to bounce once sentiment turns
On a slightly more bearish side is the fact that Histogram has dived deep and Red. The Bears are biting and has momentum
The RSI Relative Strength Index
Like the MACD, the RSI is now in an area where it has bounced in the past and yet, it can still drop further before we reach Neutral ( 30 line ) . It has to be said, the RSI is a bit behind the MACD in that it has a later date when it could reach Neutral. There is no guarantee that Neutral will hold RSI up....
Other Markets are struggling also
The DXY $ has had a sustained drop but is near an area of support. I am watching this closely.
Normaly, we see DXY and BTC move in opposite directions but we have seen both Recover at the same time, The lines between the teo are getting blurred.
GOLD - has been doing well for some omnths
However, in th elast 2 weeks, Gold has been selling off also and saw a steep drop towards the end of last week. Will be very interesting to see where this goes this week
The fact that Gold was selling, shows that investors were comfortable to leave a safe haven.
Lets see if that changes this weel
Conclusion for BITCOIN HOLDERS
This could all sound a little scary for Bitcoin and it should be taken as a HUGE Warning that we Lost the 50 SMA Support. This does open up the possibility of further drops and it may well happen
We are currently heading towards major support at 73K
This is an area I said we could hit a few weeks back and so I am not in a bad state of mind just yet.
If we Loose 71K, I will get uncomfortable.
The Lower timeframes are very much heading to OVERSOLD and so we shold get some support here and then we wait to see if Fear takes hold further.
This week, we Get the FOMC minutes and then Inflation data coming out of the USA
Thsi could Tip the balance either way, depending on the data
For me, I am NOT Selling Just yet.
I imagine many Short term holders will be and these coins will be snapped back up
We wait to see how today plays out
BUY THE DIP

Bitcoin BTC - Buy The News, Correction Is Almost Over Hello, Skyrexians!
The anticipated move has happened, BINANCE:BTCUSDT has retested the recent low and its dominance continues growing, alts are bleeding. When this nightmare will be finished and do we have any chance to see the reversal now?
Let's take a look at the daily time frame. As we pointed out earlier Bitcoin has printed wave 1 inside larger degree wave 3 and after that dropped in the wave 2. We have already told you 2 times that correction is over when price was next to $77-78, but multiple retests are not forbidden. 0.61 Fibonacci zone is the place where correction can be finished, so it can dump up to $73k. Two facts we need to rely on to find the correction bottom are: bullish divergent bar and the first green column on Awesome oscillator in conjunction with the divergence.
Best regards,
Skyrexio Team
___________________________________________________________
Please, boost this article and subscribe our page if you like analysis!

BTC/USD Weekly Analysis – Cup and Handle Breakout Toward Target🔍 Overview
The chart displays a classic Cup and Handle pattern on the weekly timeframe, a well-established bullish continuation formation often found in long-term uptrends. This pattern, combined with major technical confluences such as trendline support and strong horizontal levels, provides a high-conviction long setup with defined risk and reward.
☕ 1. The Cup Formation
Timeframe: Mid-2021 to early 2024
Shape: Rounded bottom, a hallmark of slow accumulation.
After reaching an all-time high in late 2021, BTC entered a bear market, dropping sharply and eventually bottoming out between $15,000–$20,000.
A gradual recovery followed, forming a wide and symmetrical base—indicating accumulation by institutional and long-term holders.
This phase represents a shift in market sentiment, from bearish to neutral, and eventually bullish, as buyers stepped in around key demand zones.
🔧 2. The Handle Formation
Timeframe: Early 2024 to late 2024
After reclaiming its previous high resistance area near $69,000–$75,000, BTC formed a short-term consolidation or pullback, creating the "handle" portion of the pattern.
The handle appeared as a descending channel, a healthy correction that typically precedes a breakout in this pattern.
This correction also aligned with a trendline retest, offering dynamic support and further strengthening the pattern's reliability.
💥 3. Breakout Confirmation
The breakout from the handle occurred above the descending resistance of the handle pattern.
Weekly candles showed strong bullish momentum, backed by rising volume and rejection from lower trendline levels.
BTC is now trading near $83,000, just above the trendline, confirming both pattern validation and support holding.
🎯 4. Target & Projection
The measured move of the Cup and Handle pattern is calculated by measuring the depth of the cup and projecting that from the breakout point.
Cup Depth: Approximately $60,000
Breakout Point: ~$75,000–$80,000
Target Price: ~$123,000–$125,000
This target aligns with historical Fibonacci extensions and psychological round-number resistance.
🔐 5. Key Levels
Support Zone: $20,000–$30,000 (multi-year accumulation base)
Trendline Support: Drawn from 2022 lows, holding well through handle correction
Resistance Zone: $100,000 psychological barrier
Stop Loss: Placed just below trendline and swing low at $76,340 to protect against downside volatility
🧠 Why This Setup is Strong
Multi-year Base Formation (2.5+ years of consolidation)
Pattern Reliability: Cup and Handle is a well-tested bullish continuation pattern
Confluence of Support: Both horizontal and dynamic trendline support levels
Momentum Structure: BTC has resumed higher highs and higher lows
Volume: Breakout occurred with a noticeable spike in volume, a key validation point
🏁 Conclusion
Bitcoin is displaying strong bullish potential through a large-scale Cup and Handle pattern. This technical setup is supported by:
Long-term accumulation
Structural breakout
Strong support levels
A clear roadmap toward $120K+ targets
As long as BTC maintains above the trendline and doesn't invalidate the handle's structure, the bulls remain firmly in control.

Bitcoin Bullish Continuation Towards $128KBTC/USD | 1D Chart | April 2025
📊 Technical Analysis:
Bitcoin is maintaining its bullish structure within a well-defined ascending channel. The price has bounced off the lower trendline (green), which has provided strong support multiple times (see green arrows).
Currently, BTC is consolidating near $83,800, and a breakout from this zone could initiate the next impulsive move towards the midline and upper trendline resistance (~$128,000).
Support Levels: ~$80,000 (trendline)
Resistance Levels: ~$90,000, ~$110,000, and ~$128,000
Bullish Trigger: A confirmed breakout above $90,000 could signal strong continuation
🌍 Fundamental Analysis:
Bitcoin Halving (April 2024): Historically, BTC rallies post-halving due to reduced supply. The next supply shock could fuel a rally.
Institutional Demand: Spot Bitcoin ETFs continue to see record inflows, with firms like BlackRock and Fidelity accumulating BTC aggressively.
Macroeconomic Factors: With inflation concerns persisting, investors are turning to Bitcoin as a hedge, pushing prices higher.
📈 Trade Idea:
Entry: $84,000 (Breakout Confirmation)
Stop Loss: $79,000 (Below Trendline)
Target Range: $110,000 – $128,000 (Channel Resistance)

Bitcoin (BTC/USD) Trade Setup & Analysis🔹 Trend Analysis:
📉 The chart shows a downtrend followed by a reversal attempt.
📈 The price bounced off a support zone and is moving upwards.
🔹 Indicators:
📊 The 9-period DEMA (83,805.38) is slightly above the current price, acting as a resistance level.
🔹 Trade Setup:
🟢 Entry Zone: Around 82,943 (Current Price)
🔴 Stop-Loss: 81,183.22 ❌ (Below support level)
🎯 Target Point: 85,563.52 ✅ (Upper resistance level)
🔵 Strategy: The trade anticipates a price dip before

BTC/USDT Analysis – 30-Minute Chart (OKX)BTC/USDT Analysis – 30-Minute Chart (OKX)
Key Support Levels:
Immediate support: 82,596 USDT
Stronger support: 81,900 USDT (Potential entry point)
Stop-loss: Below 79,426 USDT (Risk management)
Key Resistance Levels:
First resistance: 84,326 USDT
Next resistance: 85,726 USDT (Major supply zone)
Higher targets: 87,702 – 88,547 USDT
Indicators & Market Structure:
BTC is testing a short-term support after a bearish move.
The Stochastic RSI shows an overbought condition, signaling a potential retracement.
The EMA 20, 50, 100, and 200 are showing mixed signals; BTC needs to break above EMA 100 to confirm bullish momentum.
The MACD histogram is showing early signs of bullish momentum.
Trade Plan:
Bullish case: If BTC holds 82,596 – 81,900 USDT, a reversal towards 84,326 – 85,726 USDT is possible.
Bearish case: If BTC drops below 81,900 USDT, further downside towards 79,426 USDT may happen.
📌 Summary:
BTC is at a crucial level, consolidating around support. If it holds above 82,596 USDT, we could see a bounce toward 85,726 USDT. However, a break below 81,900 USDT could trigger more downside. Monitor price action carefully before entering a position. 🚀

ETH/USDT:UPDATEHello dear friends
Given the price drop we had, a head and shoulders pattern has formed within the specified support range, indicating the entry of buyers.
Now, given the good support of buyers for the price, we can buy in steps with capital and risk management and move towards the specified targets.
*Trade safely with us*

BTC/USDTBTC bottom is either in or very close based on Etf inflows.
tariff fuds,the 200-day ema,rsi,funding rateand a major trendline.

Bitcoin (BTC/USD) Technical Analysis: Breakout or Rejection at K200 EMA (Blue Line): 84,124 – This is a long-term trend indicator.
30 EMA (Red Line): 83,925 – A short-term trend indicator.
Key Levels
Resistance Point: Around 83,925 (marked in blue).
Support Zone: Around 82,184 (Stop Loss zone).
Target Point: 88,197, indicating a potential 6.34% upside.
Potential Trade Setup
Scenario 1 (Bullish Case):
If price breaks above resistance (83,925) and EMA 200, then a move towards 88,197 is expected.
A breakout confirmation might lead to an uptrend continuation.
Scenario 2 (Bearish Case):
If price rejects at resistance (83,925) and falls back below the support zone (82,184), a downward move could happen.
Pattern Analysis:
The chart suggests a potential accumulation phase before a breakout.
Possible retest of resistance before a rally.
Conclusion
Bullish above 83,925, targeting 88,197.
Bearish below 82,184, with potential downside.
Price action near the 200 EMA is crucial for the next move.

BTC already has the conditions to hit the 90000-95000 zone!A few days ago, I mentioned that BTC had the potential to surge towards the 90000-95000 range. Currently, BTC has already climbed above 87000 during its rebound, effectively opening the door to the 90000-95000 zone.
From a fundamental perspective, with bearish factors becoming clearer, if Trump adopts a more lenient stance on tariffs, BTC could extend its rebound. On the technical side, BTC has successfully broken through the short-term resistance around the 85500 level, turning the 85500-84500 area into a short-term support structure. This transition further supports BTC’s continuation to the upside, potentially testing the 90000-95000 range.
For short-term trading, we can consider waiting for a technical pullback and looking to go long on BTC once it retraces to the 85500-85000 region. The trading strategy verification accuracy rate is more than 90%; one step ahead, exclusive access to trading strategies and real-time trading settings
Bullish Breakout from Falling Wedge | Upside Potential Ahead!Market Overview:
The Bitcoin (BTC/USD) 4-hour chart is displaying a Falling Wedge pattern, a well-known bullish reversal structure. This indicates that the downtrend is weakening, and a potential breakout could lead to a strong upside move.
🔹 Key Technical Analysis
1️⃣ Falling Wedge Formation & Breakout
Bitcoin has been trading inside a falling wedge, marked by lower highs and lower lows, signaling a contraction in volatility.
A breakout above the upper trendline of the wedge is forming, suggesting a bullish reversal and the start of an uptrend.
Falling wedges typically lead to a rally equal to the height of the pattern, giving a measured move target of $114,334.
2️⃣ Price Action & Confirmation Levels
A clean breakout above $87,000 would confirm bullish momentum.
If price successfully retests the wedge’s upper boundary and holds support, further bullish continuation is expected.
The psychological level of $100,000 could act as an interim resistance before the final target is reached.
3️⃣ Upside Target & Resistance Zones
The measured move suggests a potential rally towards $114,334, aligning with previous resistance zones.
This target represents a 30.55% gain from the breakout level.
Traders should watch for pullbacks and retests as part of the breakout confirmation.
📈 Trading Plan - Long Setup
🔹 Entry: Look for a confirmed breakout above $87,000, or a retest of support.
🔹 Stop Loss: Below $84,000, protecting against false breakouts.
🔹 Take Profit: $100,000 - $114,334 (previous resistance & measured move target).
🔹 Risk-Reward Ratio: Strong bullish setup with favorable upside potential.
🛑 Risk Factors to Consider
⚠️ A failed breakout and a drop below $83,000 would invalidate the bullish setup.
⚠️ External factors such as macroeconomic events, regulatory news, and BTC ETF developments could influence volatility.
Final Thought
The breakout from the falling wedge signals a potential bullish continuation for Bitcoin, with targets set around $114,334. Traders should watch for confirmation above $87,000 and manage risk accordingly.

Can it hit 89,000 again?The price trend of BTC has once again become the focus of global investors' attention.
Previously, BTC experienced a period of consolidation, during which the bulls and bears engaged in repeated games. Now, the bulls of BTC have risen strongly, unleashing powerful upward momentum.
With a swift and fierce move, it has broken through the key resistance level of 85,000 at one stroke. This breakthrough is like a fuse igniting the market, and the upward trend has spread rapidly. It is expected that it will further challenge the range of 87,000-89,000 in the future.
The market has been extremely volatile lately. If you can't figure out the market's direction, you'll only be a cash dispenser for others. If you also want to succeed,Follow the link below to get my daily strategy updates

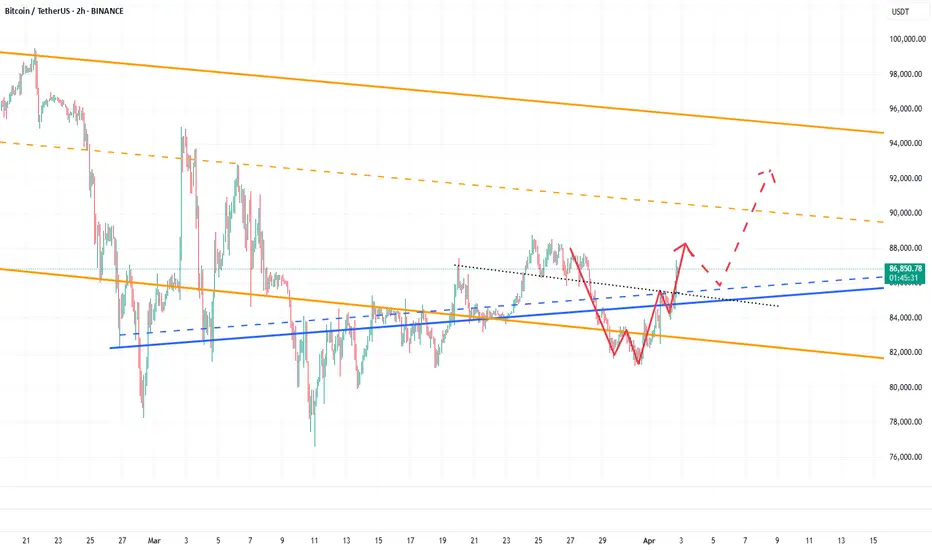
BTC/USD Bullish Breakout from Rectangle PatternOverview:
The chart represents Bitcoin's price action against the US Dollar on the 1-hour timeframe, highlighting a Rectangle Pattern Breakout with a well-structured trade setup. This analysis will break down the pattern, key levels, and possible trading scenarios.
1️⃣ Chart Pattern Breakdown – Rectangle Consolidation
The price has been moving within a rectangle pattern (range-bound movement), where Bitcoin found support at lower levels and faced resistance at the upper boundary.
Rectangle Pattern: A continuation/consolidation pattern where price fluctuates between horizontal resistance and support before breaking out.
Curve Formation: The price action within the rectangle also forms a rounding bottom, indicating a potential shift from bearish to bullish sentiment.
Breakout Confirmation: BTC has broken out from the rectangle, suggesting bullish momentum.
2️⃣ Key Technical Levels
🔹 Support Level ($84,110)
This zone has acted as a strong demand area, preventing the price from falling further.
Buyers consistently stepped in at this level, making it a significant psychological floor for Bitcoin.
🔹 Resistance Level ($86,850 - $87,000 Zone)
This level had previously rejected upward movements, leading to multiple price pullbacks.
After the breakout, this area is expected to act as a new support level upon a retest.
🔹 Target Price ($89,931 – Next Resistance Zone)
If the breakout sustains, the next key target for bulls is around $89,931, based on prior resistance zones and technical projections.
🔹 Stop Loss ($84,110 – Below Support Zone)
A stop loss below the support zone ensures risk management in case of a false breakout.
3️⃣ Trading Strategy & Execution
📌 Entry Point – After price confirms the breakout above the rectangle’s resistance. Traders should wait for:
A pullback and retest of the broken resistance, which should now act as support.
A strong bullish candle confirming continuation.
📌 Take Profit (TP) – $89,931, based on historical resistance levels and price projection from the rectangle range.
📌 Stop Loss (SL) – Placed at $84,110, below the rectangle’s previous support zone to minimize downside risk.
📌 Risk-to-Reward Ratio (RRR) – The setup offers a favorable RRR, meaning potential profits outweigh the risks.
4️⃣ Market Sentiment & Additional Factors
✔ Bullish Outlook – The breakout signals strong buying interest and potential upside continuation.
✔ Volume Confirmation – Traders should monitor volume spikes during the breakout to confirm institutional participation.
✔ Economic Events & News – External factors like macroeconomic data or Bitcoin-related news can impact price action.
Conclusion – BTC/USD Trading Setup
Pattern Identified: Rectangle Pattern Breakout
Current Trend: Bullish breakout from consolidation
Trade Type: Long position (Buy setup)
Key Levels:
✅ Support: $84,110
✅ Resistance: $86,850 - $87,000
✅ Target: $89,931
✅ Stop Loss: $84,110
🔥 Final Thought : Bitcoin has broken out of a key consolidation range, signaling a bullish move towards $89,931. Traders should wait for confirmation and manage risk accordingly! 🚀📈

BTC @ ~$100k == GOLD @ ~$1kGold is always a good fractal to use for projecting Bitcoin.
Gold price action around the MIL:1K area is very similar to what we are seeing on BTC currently.
Flip $90k to support and it's go time for BTC.
1st target is ~$200k.
-@CryptoCurb

Continue to believe in BTCI. Technical Analysis
(1) Support and Resistance Levels
BTC has a strong support at $80,000. It’s withstood selling pressure multiple times. When the price dropped to $82,000, it rebounded, validating this support. $85,000 and $87,000 act as resistance levels. Failed attempts to break through these thresholds show strong selling above these price points.
(2) Moving Average System
While BTC short - term moving averages are down due to price drops, long - term ones stay upward. This means the long - term uptrend isn’t disrupted. A golden cross may form when short - term averages recover and cross long - term ones, supporting upward movement.
(3) Technical Indicators
RSI shows BTC is in oversold zone, hinting at excessive selling. Market recovery may trigger a price rebound. Although MACD gives a bearish signal, the bearish momentum is weakening, indicating a possible reversal.
💎💎💎 BTC 💎💎💎
🎁 Buy@80500 - 81000
🎁 TP 83000 84000 85000
The market has been extremely volatile lately. If you can't figure out the market's direction, you'll only be a cash dispenser for others. If you also want to succeed,Follow the link below to get my daily strategy updates
