Explanation Why Bitcoin BTC Bull Run Is not Over YetHello, Skyrexians!
Time to update BINANCE:BTCUSDT huge analysis. Market became bigger and it needs more rime to form bull and bear stages. Now everyone is waiting for the bear market because it was every time, but this time it will be tricky for retailers.
Let's take a look at the 2 week time frame. If we apply our Fractal Trend Detector to this chart we can see that Bitcoin is still in the green zone and now is inside the huge support area. If it will be held we will see the following Elliott waves scenario where wave 3 will reach at least $144k. Awesome Oscillator also gives us a hint that it's still not over. The entire bull market will be finished only in the middle of 2026.
Best regards,
Skyrexio Team
___________________________________________________________
Please, boost this article and subscribe our page if you like analysis!
Btcusdbuy

BTC: Accumulate energy for the rise and soar into the sky!📍BTC's volatility has narrowed, with selling pressure showing signs of weakening. Throughout the choppy price action, the 84000-83500 zone has established itself as a critical support area in the short-term structure. This level now serves as a key defensive line.
📍Following this consolidation phase, BTC may stage a rebound from this support region. If the price manages to break through the resistance around 84800 with strength, further upside momentum could drive it towards the 90000 level.
🔎Trade Idea:
BTCUSD:Buy at 83500-83000
TP:84500-85000
SL:Adjust according to risk tolerance.
📩Trading means that everything has results and everything has feedback. I have been committed to market trading and trading strategy sharing, striving to improve the winning rate of trading and maximize profits. If you want to copy trading signals to make a profit, or master independent trading skills and thinking, you can follow the channel at the bottom of the article to copy trading strategies and signals

Buy BTCUSDTBTCUSDT is showing an enticing buy signal!
Take-profit targets: TP1 at 84800, TP2 at 86600.
If the price fails to break 84800 on the H1 timeframe, exit the trade to preserve capital. Stay sharp and let’s conquer the market together!

BTC: Capture buying opportunities accurately📍Fundamentals: From a macro perspective, with increased government endorsement, cryptocurrencies are gaining greater credibility and popularity in the market.
📍Technical Analysis:The downward momentum of BTC is showing signs of exhaustion, with multiple rebounds forming a structural bottom that provides strong support. Overall, the bullish trend remains intact. The key support zone to monitor is 83000-82000.
📌If BTC fails to break below this level in the short term, a rebound is likely, with upside potential targeting the 88000-89000 range.
🔎Trade Idea:
BTCUSD: Buy at 83000-82000
Target (TP):88000-89000
Stop Loss (SL):Adjust according to risk tolerance.
📩Trading means that everything has results and everything has feedback. I have been committed to market trading and trading strategy sharing, striving to improve the winning rate of trading and maximize profits. If you want to copy trading signals to make a profit, or master independent trading skills and thinking, you can follow the channel at the bottom of the article to copy trading strategies and signals

Support and resistance for BTCBTC tested resistance near 88000 yesterday following the Fed rate decision, and this test of resistance was effective.
However, BTC uptrend is not over, and the lower support should be watched in the 81,000-82000 area, when the price reaches this area can continue to go long.
🎁 Buy@81000 - 82000
🎁 TP 83000 84000 85000
🎁 Sell@87000 - 88000
🎁 TP 84000 83000 82000
Traders, if you liked this idea or if you have your own opinion about it, write in the comments. I will be glad
If you also aspire to achieve financial freedom,Follow the link below to get my daily strategy updates

BTC----Buy around 85500, target 87000 areaTechnical analysis of BTC on March 20: Today, the large-cycle daily level closed with a medium-yang line yesterday, and the K-line pattern was still a single-yin and single-yang line. The price was consolidated at a low level. The attached indicator was in a golden cross, but the fast and slow lines were still below the zero axis. The suppression at the weekly level was still quite obvious. The current trend is still the trend of time-for-space pullback, but there will not be too much movement, and we just need to follow the trend and maintain short-term trading; the short-cycle hourly chart showed that the European session rose and the US session continued in the early morning, and the price broke the high and then retreated quickly. The current price is consolidating at a high level, and the attached indicator was dead cross but there was no retracement strength. If we see a continued rise today, then the retracement strength cannot be large. The intraday low is near the 85400 area.
Today's BTC short-term contract trading strategy: buy at the 85500 area, stop loss at the 85000 area, and target the 87000 area;

BTC 4h Trade Setup: Potential Long Opportunity
Use the 12-hour chart for additional buy confirmation. For optimal entry, refine your position using lower timeframes.
Trade Setup: Long (Buy) Position
📍 Entry:
Enter around 80,800 USDT or 81,800 USDT in the next few hours.
A recent BUY signal and RSI near oversold territory suggest a potential reversal.
🛑 Stop Loss:
Set a stop loss below 80,000 USDT, around 79,500 USDT, to limit downside risk.
If the price breaks below 80,000, the next support is at 78,252.1 USDT.
🎯 Take Profit Targets:
1st TP: 86,500 USDT
2nd TP: 88,000 USDT
📌 This setup offers a favorable risk-to-reward ratio, with potential gains outweighing risks.
On the higher timeframe, the 21 EMA is still below the 50 EMA, indicating a prevailing downtrend. Trade cautiously and ensure you take profits accordingly.
📢 Disclaimer: This analysis is for informational purposes only and does not constitute financial advice. Trading involves risk, and past performance is not indicative of future results. Always conduct your own research and consult with a professional before making any investment decisions.

Bitcoin long-term holder behavior shift signalsBitcoin long-term holder behavior shift signals 'unique market dynamic' — Research BITSTAMP:BTCUSD
Bitcoin’s corrective phase set a four-month low at $76,600 on March 11. Despite this decline, long-term holders have continued to hold large amounts of BTC, suggesting a “unique market dynamic moving forward,” new research says.
“Long-Term Holder activity remains largely subdued, with a notable decline in their sell-side pressure,” Glassnode said in a March 18 markets report.
Long-term holders show signs of bullishness
Bitcoin’s recovery comes as selling pressure among Long-Term Holders (LTHs) — wallets that have held Bitcoin for at least 155 days — begins to wane.
The Binary Spending Indicator, a metric used to determine when LTHs are spending a significant proportion of their holdings in a sustained manner, shows a slowdown (see chart below) while the LTH supply is also beginning to rebound after several months of decline.
“This suggests that there is a greater willingness to hold than to spend coins among this cohort,” Glassnode noted, adding:
“This perhaps represents a shift in sentiment, with Long-Term Holder behavior moving away from sell-side distribution."
Bull market tops are often marked by intense sell-side pressure and strong profit-taking among LTHs, which signals a complete shift to bearish behavior.
However, despite Bitcoin's drawdown in recent weeks, this investor cohort continues to hold a large portion of their profits, especially for this later stage of the cycle, Glassnode said.
This could suggest that long-term holders may still be expecting more BTC price upside later in the year.
“This interesting observation may indicate a more unique market dynamic moving forward.”
New Bitcoin whale accumulation reshapes markets
New Bitcoin whales, addresses holding at least 1,000 BTC, where each coin has an average acquisition age of less than six months, are aggressively accumulating, according to CryptoQuant data.
This signals strong conviction in Bitcoin’s long-term outlook among the new large investors.
These wallets have collectively acquired over 1 million BTC since November 2024, “positioning themselves as one of the most influential market participants,” said CryptoQuant independent analyst Onchained in a March 7 analysis.
The chart below shows that their pace has accelerated notably in recent weeks, “accumulating more than 200,000 BTC just this month.”
“This sustained inflow highlights a shift in market dynamics, suggesting increased institutional or high-net-worth participation. ”
Meanwhile, several crypto executives have told Cointelegraph that Bitcoin’s recent price drop was a “normal correction,” with the market just waiting for a new narrative and a cycle top yet to come.
But not everyone agrees. For instance, CryptoQuant founder and CEO Ki Young Ju said that the Bitcoin bull cycle is over. He added:
“Expecting 6-12 months of bearish or sideways price action.”
This article does not contain investment advice or recommendations. Every investment and trading move involves risk, and readers should conduct their own research when making a decision.

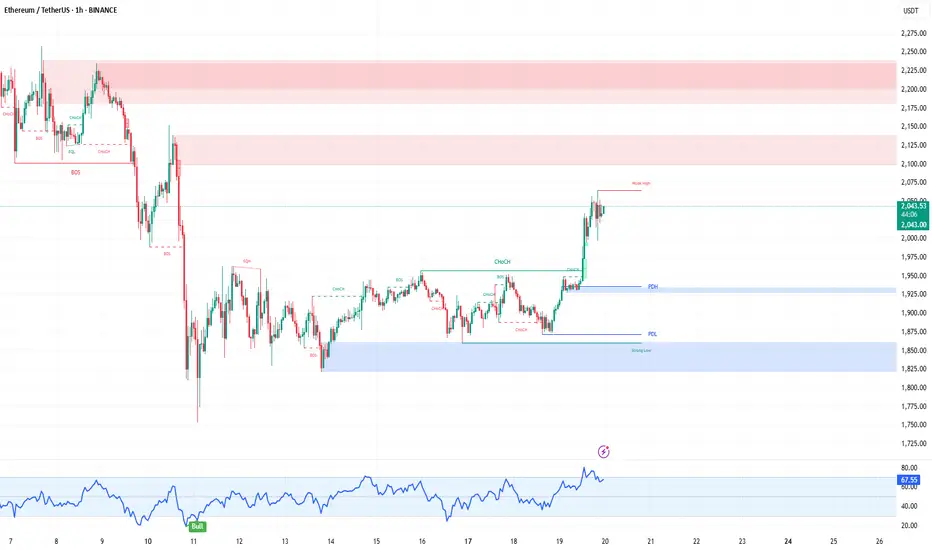
ETH/USDT 1H: Bullish Breakout Holding – Next Stop $2,175?ETH/USDT 1H: Bullish Breakout Holding – Next Stop $2,175?
🚀 Follow me on TradingView if you respect our charts! 📈 Daily updates!
Current Market Conditions (Confidence: 8/10):
Price at $2,043, maintaining strong momentum following a breakout.
RSI at 67.54, approaching overbought territory but still has room for continuation.
Clear break above previous resistance at $1,925, confirming bullish structure.
No significant bearish divergences present, reinforcing continuation potential.
LONG Trade Setup:
Entry: $2,035 - $2,045 zone.
Targets:
T1: $2,100 (short-term resistance).
T2: $2,175 (extended target).
Stop Loss: $1,925 (below recent support).
Risk Score:
6/10 – Lower risk due to strong structure, but resistance at $2,200 remains a key level to
monitor.
Market Maker Activity:
Accumulation evident at higher levels, with minimal selling pressure.
Clean breakout above resistance suggests further bullish continuation.
Key resistance ahead at $2,200, with strong support at $1,875.
Recommendation:
Long positions remain favorable within the $2,035 - $2,045 entry range.
Watch $2,100 and $2,175 for profit-taking zones.
Monitor volume on the approach to $2,200 to confirm breakout strength.
🚀 Follow me on TradingView if you respect our charts! 📈 Daily updates!
BTC/USDT 1H: Bullish Momentum Holding – Next Target $87,500?BTC/USDT 1H: Bullish Momentum Holding – Next Target $87,500?
🚀 Follow me on TradingView if you respect our charts! 📈 Daily updates!
Current Market Conditions (Confidence: 8/10):
Price at $85,494, showing strong bullish momentum with a recent breakout.
RSI at 69.71, approaching overbought but still has room to push higher.
Clear order block formation at $83,600, confirming institutional demand.
Previous resistance at $84,000 now acting as support, strengthening the bullish structure.
LONG Trade Setup:
Entry: $85,200 - $85,500 zone.
Targets:
T1: $86,000 (key short-term resistance).
T2: $87,500 (extended target).
Stop Loss: $84,000 (below recent support).
Risk Score:
7/10 – Elevated due to extended move, but structure remains bullish.
Market Maker Activity:
A
ccumulation visible at higher levels, suggesting Smart Money positioning for another push.
Minimal bearish divergence present, supporting further continuation.
Break above $84K suggests sustained momentum, but watch resistance at $86K for reaction.
Recommendation:
Long positions remain favorable within the $85,200 - $85,500 entry range.
Monitor $86K resistance for breakout potential; failure to hold may lead to a pullback.
Use tight stops to protect against a sudden liquidity sweep.
🚀 Follow me on TradingView if you respect our charts! 📈 Daily updates!

Btcusd trade idea e read caption This chart represents a technical analysis of Bitcoin (BTC/USD) on the 1-hour timeframe from Coinbase. Here are the key elements of the analysis:
1. Order Block (Green Zone):
The green zone represents a significant order block, indicating an area where institutional buying or selling activity previously took place. The price has reacted strongly to this zone, confirming its importance.
2. Entry Point (White Line & Label):
The price has broken above the order block, suggesting a bullish entry. This level is marked as an optimal entry zone for a long position.
3. Price Movement & Target Levels (Yellow Arrows):
Two yellow arrows suggest that the price is expected to move upwards towards key resistance or profit target zones.
4. Target Levels (Dashed Lines & Blue Labels):
$88,000.17 and $90,681.03 are identified as potential profit targets, indicating resistance levels where the price may face selling pressure.
5. Current Price & Trend:
Bitcoin is currently trading at $85,511.26, with a 3.40% increase. The strong breakout suggests bullish momentum.
6. Market Volume (Right-Side Volume Profile):
The volume profile on the right shows high trading activity around the $84,000 level, which could act as support in case of a pullback.
Summary:
A breakout above a key order block suggests bullish continuation.
Entry is positioned above the breakout.
Target levels are set at $88,000 and $90,681.
High probability of upward movement based on volume and trend analysis.
This analysis suggests a bullish setup with potential gains if the price sustains above the order block and moves toward the target zones.

BTC Current situationCurrently BTC has not reached the resistance point of 85000, we can directly choose to go short。
BTC
🎁 Sell@84900 - 85000
🎁 SL 86000
🎁 TP 83900 - 83500
Traders, if you liked this idea or if you have your own opinion about it, write in the comments. I will be glad
If you also aspire to achieve financial freedom,Follow the link below to get my daily strategy updates
Bitcoin Rising to Fill most recent CME GAP - what then ?We have seen some pretty Good CME Gaps in recent months, a sign of volatility.
And, as I have been saying, CME GAPS ALWAYS GET FILLLED
the proof of that is right here, showing you the recent ones.
So, eight now, we are filling a gap from Below
The question is, what will we do than? Once the Gap is filled at around 86485
I would be a Very rich man if I knew for sure but as I have been saying in a few posts, I do not think PA is fully ready to berak out just yet BUT we may see a push higher to around 90K before it returns to the Low, maybe even to dip lower into the 73K zone.
But, obviously, this may not happen. However, Next time you see a CME Gap, understand it WILL get Filled.
If in a bull run Move, it will remain a gap till a later date, or, as we range as we are now, you can see howe this happens.
The Dips are great buying opportunists
Almost like the Fair Value Gaps ( FVG )
Stay safe

BTCUSDT - Forecast for Today!My general opinion is that we will go back and forth in the intermediate zones until interest rate decision is announced and I'm bearish for now due to CDV. I have indicated the possible manipulations in these intermediate zones in the drawings on the chart.
Starting from the 4-hour point of control zone(indicated in the chart), I will start looking for short trends downwards and as usual, I will enter with confirmations in the low time frame.
I have a long list of my proven technique below:
🤖 IQUSDT: Smart Plan
🟠 IDEXUSDT: Spot Buy Area | %26 Profit if You Trade with MSB
📌 USUALUSDT: Buyers Are Active + %70 Profit in Total
🌟 FORTHUSDT: Sniper Entry +%26 Reaction
🐳 QKCUSDT: Sniper Entry +%57 Reaction

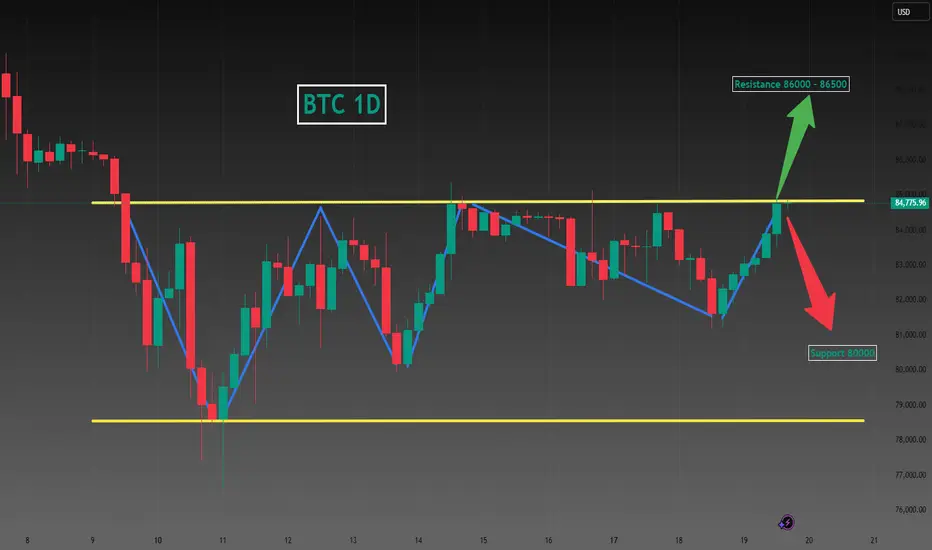
Bitcoin (BTC/USDT) Bearish Flag Breakdown – Potential Drop AheadKey Observations:
Bearish Flag Formation:
The chart mentions a "Bearish Flag," which is a continuation pattern suggesting a potential downward movement.
The price initially moved up (flagpole) but started consolidating before breaking downward.
Break of Trendline Support:
A clear upward trendline is visible, which has been broken to the downside, indicating a shift in momentum.
The breakdown happened after a series of lower highs, confirming selling pressure.
Short Trade Setup:
A short trade (sell position) is illustrated with a red stop-loss area above the entry and a green take-profit area below.
The risk-to-reward ratio seems favorable, with a target around 82,390 USDT.
Price Action & Direction:
The red arrow emphasizes further downward movement toward the support levels.
The next major support zone is around 82,800 - 82,390 USDT.
Conclusion:
The chart suggests a bearish outlook for Bitcoin in the short term.
The break of the trendline and bearish flag formation indicate further downside potential.
If Bitcoin fails to hold the immediate support level, it could move toward 82,390 USDT or lower.

BTC Today's analysis
BTC has been fluctuating at 84000 to 84500 yesterday, very stable, like a crocodile waiting for food to come, so we should always be vigilant
BTC 🎁 Buy@83000 - 83200
🎁 SL 83500
🎁 TP 84500 - 84800
If you're struggling to find direction or generate profits in finance,
I'm here to help. As a seasoned financial analyst,
I'm great at decoding market signals for profit - making chances.
I'll customize a plan for you. Contact me now to start seeing financial gains!

BTCUSD Analysis StrategyToday's Bitcoin market shows the dual characteristics of technical correction and cautious market sentiment. The short - term risk is inclined to the downside, but there is still rebound potential in the medium - and long - term.
The fact that the price of Bitcoin has fallen below $84,000 does not mean the end of Bitcoin. Instead, it is just a part of the market operation. For investors, the key to success lies in understanding the underlying factors of the market and correctly assessing the risks and opportunities. In a market full of uncertainties, only by staying calm and conducting rational analysis can one seize the future opportunities.
Bitcoin Trading Strategy
sell @ 90000
buy @ 78000
Finally, I'd like to remind every investor that the cryptocurrency market is inherently highly volatile, and every decision you make may have an impact on your investment returns. In this rapidly changing market, what we need is not just luck, but also a keen mind. You are all welcome to follow me. Let's discuss the future of Bitcoin together. Perhaps it is through the collision of ideas between you and me that we can gain a clearer understanding of this market.

Trading opportunity for BTCUSDT BitcoinBased on technical factors there is a Buy position in :
📊 BTCUSDT
🔵 Buy Now
🪫Stop loss 82000.00
🔋Target 89900.00
📏 R/R 2,4
💸RISK : 1%
We hope it is profitable for you ❤️
Please support our activity with your likes👍 and comments📝

Bitcoin Reversal or Dead Cat Bounce? Here's My Trading Plan! Analyzing BTC on the higher timeframe, we observe a clear structural shift in the prevailing trend 📊. Dropping down to the 4-hour chart, there is a decisive bullish break 📈, leaving behind an imbalance following the initial move—an area that could serve as a retracement target 🎯. Notably, this imbalance aligns with a Fibonacci retracement into equilibrium 📐, adding confluence to the setup.
I am considering a long position 💰, but only if the key conditions outlined in the video materialize ✅. If those conditions fail to align, I will discard this trade idea ❌.
⚠️ Not financial advice.

BTC Today's strategyToday, Btc is like a well baby constantly hovering around 84,300.
However, we all know that it can be deadly at any time, just as we know that its price will rise. We are merely trying to make some money in the process.
BTC 🎁 Buy@83800 - 84000
🎁 SL 83500
🎁 TP 84800 - 85000
If you're struggling to find direction or generate profits in finance,
I'm here to help. As a seasoned financial analyst,
I'm great at decoding market signals for profit - making chances.
I'll customize a plan for you. Contact me now to start seeing financial gains!

BITCOIN (UPDATE)Hello friends
As we predicted, Bit needed a correction after hitting a new ceiling.
Now that buyers are slowly entering, you can buy in steps, of course with capital management...
Price targets have also been specified.
*Trade safely with us*

BTCUSD Trading StrategyBitcoin is currently trading at approximately $84,364.87, with a 24-hour gain of 2.96% and a 7-day cumulative decline of -2.81%. Recently, influenced by news about the Trump administration's strategic reserves, the price experienced a "sell-the-news" style pullback, retreating from its high of around $100,000 to consolidate within the $80,000 range. The short-term support level stands at $74,000, while the resistance level is at $85,000.
Bitcoin Trading Strategy
sell @ 90000
buy @ 78000
If you're currently dissatisfied with your Bitcoin trading outcomes and seeking daily accurate trading signals, you can follow my analysis for potential assistance.

Potential reversal for a short term bullishTrading Plan:
1) Buy Area: 79,243 - 78,807
2) Sell Area: 87,414.31 - 88,198.32 - 88,790.43
A potential short-term bullish reversal for BTC may occur today once it hits the fair value gap. However, please note that the overall trend remains bearish, and there is a possibility that this trend will continue due to market uncertainty driven by geopolitical factors.
