BTC Rebounds After 100000 Drop, Eyeing Short at 109500 Resistanc📈 BTC Rebounds After 100000 Drop, Eyeing Short at 109500 Resistance
BTC dropped below the 100000 threshold 🔻 and then rebounded near 98000 🔺. This movement is related to the decline of DXY and the reduction of geopolitical risks. Now, BTC is challenging the 110000 level 🔼. The overhead resistance is around 109500. First - time tests of the 110000 level typically trigger pullbacks, so we favor short positions here 📉
🚀 Sell@109500 - 108500
🚀 TP 107500 - 106500 - 105500
Accurate signals are updated every day 📈 If you encounter any problems during trading, these signals can serve as your reliable guide 🧭 Feel free to refer to them! I sincerely hope they'll be of great help to you 🌟 👇
Btcusdbuy

Bitcoin Drive up to 115k So currently BTC on the weekly and monthly is showing us a drive up to 115,700 then possibly seeing a correction major or minor then a drive up to 122k is what I am currently seeing at the moment
Kris Mindbloome Exchange
Trade Smarter Live Better

Bitcoin's Podium-Ready 'Bull Flag' Hints at Price Boom to $120KBitcoin's Podium-Ready 'Bull Flag' Hints at Price Boom to $120K
Bitcoin, the pioneering cryptocurrency that has redefined the financial landscape, continues to spark intense debate and fervent speculation about its future price trajectory. Amidst the sea of technical analyses and market predictions, a compelling pattern has emerged on Bitcoin's price chart: the 'bull flag.' This bullish continuation pattern, often seen as a precursor to significant upward price movements, has ignited excitement among Bitcoin proponents, fueling predictions of a potential surge to $120,000.
This article delves into the intricacies of the bull flag pattern, exploring its formation, characteristics, and implications for Bitcoin's price. We will analyze the current market conditions, considering the recent retreat from $108,000 and the overall sentiment of Bitcoin bulls. Furthermore, we will examine the factors that could either validate or invalidate the bull flag pattern, providing a nuanced perspective on the potential for Bitcoin to reach $120,000. By synthesizing these insights, we aim to offer a comprehensive overview of the technical and fundamental factors that could shape Bitcoin's price trajectory in the coming months.
Understanding the Bull Flag Pattern
The bull flag is a technical analysis pattern that signals a continuation of an existing uptrend. It is characterized by two distinct phases:
1. The Flagpole: This represents the initial strong upward movement in price. It is a sharp, almost vertical rally that establishes the overall bullish trend.
2. The Flag: This is a period of consolidation that follows the flagpole. The price moves sideways or slightly downwards, forming a rectangular or parallelogram-shaped pattern that resembles a flag. This consolidation phase allows the market to digest the initial rally and prepare for the next leg up.
The bull flag pattern is considered a bullish signal because it suggests that the initial uptrend is likely to resume after the consolidation phase. Traders often look for a breakout above the upper trendline of the flag as a confirmation signal to enter a long position.
Bitcoin's Bull Flag Formation
Bitcoin's price chart has exhibited a pattern that closely resembles a bull flag. The flagpole can be identified by the significant upward movement that occurred in the months leading up to June 2025. This rally propelled Bitcoin to a high of $108,000, establishing a strong bullish trend.
Following this rally, Bitcoin entered a period of consolidation, with the price moving sideways and slightly downwards. This consolidation phase has formed a flag-like pattern on the chart, characterized by two parallel trendlines that slope gently downwards.
The formation of this bull flag pattern has led many analysts to believe that Bitcoin is poised for another significant upward movement. The target price for this potential breakout is often calculated by measuring the length of the flagpole and adding it to the breakout point on the upper trendline of the flag. In Bitcoin's case, this calculation suggests a potential target price of around $120,000.
Factors Supporting the Bull Flag Pattern
Several factors support the validity of the bull flag pattern and the potential for Bitcoin to reach $120,000:
• Strong Underlying Bullish Trend: The bull flag is a continuation pattern, meaning that it relies on an existing uptrend to be valid. Bitcoin's price has been in a strong uptrend for several years, driven by increasing institutional adoption, growing mainstream adoption, and limited supply.
• Positive Market Sentiment: The overall sentiment among Bitcoin investors remains positive, despite the recent retreat from $108,000. Many analysts believe that Bitcoin is still in the early stages of its adoption curve and that its long-term potential remains significant.
• Increasing Institutional Adoption: Institutional investors, such as hedge funds, pension funds, and corporations, are increasingly allocating capital to Bitcoin. This increased institutional adoption can drive up the price of Bitcoin and provide a more stable foundation for its long-term growth.
• Growing Mainstream Adoption: Bitcoin is becoming increasingly accepted as a form of payment and a store of value by mainstream consumers and businesses. This growing mainstream adoption can increase demand for Bitcoin and drive up its price.
• Limited Supply: Bitcoin has a fixed supply of 21 million coins. This limited supply makes Bitcoin a scarce asset, which can increase its value over time as demand grows.
• Halving Events: Bitcoin's halving events, which occur approximately every four years, reduce the rate at which new Bitcoins are created. These halving events can reduce the supply of Bitcoin and drive up its price. The next halving event is expected to occur in 2028.
• Macroeconomic Factors: Macroeconomic factors, such as inflation, currency devaluation, and geopolitical instability, can increase demand for Bitcoin as a safe haven asset.
Factors Invalidating the Bull Flag Pattern
While the bull flag pattern is a bullish signal, it is not foolproof. Several factors could invalidate the pattern and prevent Bitcoin from reaching $120,000:
• Breakdown Below the Flag: If the price breaks down below the lower trendline of the flag, the bull flag pattern is invalidated. This would suggest that the consolidation phase is not a temporary pause before another rally, but rather a sign of weakening momentum.
• Negative News and Events: Negative news and events, such as regulatory crackdowns, security breaches, or macroeconomic shocks, could dampen investor sentiment and trigger a sell-off in Bitcoin.
• Weakening Market Fundamentals: If Bitcoin's adoption rate slows down, network activity declines, or transaction volume decreases, it could indicate that the underlying fundamentals are weakening, which could invalidate the bull flag pattern.
• Profit-Taking: After a significant rally, some investors may choose to take profits, which could put downward pressure on the price of Bitcoin and prevent it from breaking out of the flag.
• Alternative Investments: The emergence of compelling alternative investments could divert capital away from Bitcoin, reducing demand and potentially invalidating the bull flag.
Bitcoin Retreats From $108K: A Temporary Setback?
As of June 26, 2025, Bitcoin has retreated from its recent high of $108,000. This pullback has sparked concerns among some investors, but Bitcoin bulls remain optimistic about the long-term prospects of the cryptocurrency.
The recent retreat could be attributed to a number of factors, including profit-taking after a significant rally, regulatory concerns, or macroeconomic headwinds. However, it is important to note that Bitcoin has experienced numerous pullbacks throughout its history, and these pullbacks have often been followed by even stronger rallies.
The key question is whether this pullback is a temporary setback within the bull flag pattern or a sign that the pattern is about to be invalidated. If the price can hold above the lower trendline of the flag and eventually break out above the upper trendline, it would confirm the validity of the pattern and increase the likelihood of Bitcoin reaching $120,000.
Trading the Bull Flag Pattern
Traders who are looking to capitalize on the bull flag pattern can consider the following strategies:
• Entry Point: Wait for a confirmed breakout above the upper trendline of the flag before entering a long position. This helps to avoid false breakouts and increases the probability of a successful trade.
• Stop-Loss Order: Place a stop-loss order below the lower trendline of the flag to limit potential losses if the pattern is invalidated.
• Target Price: Calculate the target price by measuring the length of the flagpole and adding it to the breakout point on the upper trendline of the flag.
• Risk Management: Always use proper risk management techniques, such as limiting the amount of capital you risk on any single trade.
Conclusion
Bitcoin's price chart is currently exhibiting a bull flag pattern, which suggests that the cryptocurrency could be poised for another significant upward movement. The potential target price for this breakout is around $120,000.
However, it is important to note that the bull flag pattern is not foolproof, and several factors could invalidate it. Investors should carefully monitor the price action, market sentiment, and underlying fundamentals to assess the likelihood of Bitcoin reaching $120,000.
The recent retreat from $108,000 is a reminder that Bitcoin is a volatile asset and that pullbacks are a normal part of the market cycle. Whether this pullback is a temporary setback within the bull flag pattern or a sign that the pattern is about to be invalidated remains to be seen.
Ultimately, the future of Bitcoin's price will depend on a complex interplay of technical factors, market sentiment, and fundamental developments. By staying informed and using proper risk management techniques, investors can position themselves to potentially profit from Bitcoin's continued growth and success. As always, remember to consult with a qualified financial advisor before making any investment decisions. The bull flag offers a tantalizing glimpse of potential gains, but prudent analysis and risk mitigation are essential for navigating the volatile world of cryptocurrency.
Setup: Entry at $108,658 with Target at $98,815 and Stop Loss at1. Entry Point: 108,658
This is where the trader expects to enter a short position.
Price is projected to reverse near this level.
2. Stop Loss: 110,341
Located above the entry point.
If price hits this level, the short trade is invalidated, limiting losses.
3. Target (Take Profit): 98,815
This is the EA Target Point, about 9,714 points (~8.94%) below the entry.
Represents a favorable risk-reward ratio.
---
🔄 Trade Idea Summary
Trade Type: Short (Sell)
Risk: ~1,683 points (110,341 - 108,658)
Reward: ~9,843 points (108,658 - 98,815)
Risk-Reward Ratio: ~1:5.85 (which is strong)
---
📊 Technical Indicators in Use
Moving Averages:
Likely 50-period (red) and 200-period (blue) MAs.
The 50 MA is below the price, indicating short-term bullishness.
However, the trade idea goes against this short-term trend, suggesting a reversal strategy.
---
🔍 Interpretation & Strategy
This chart implies the trader expects resistance near 108,658, possibly due to historical highs or supply zones.
The bearish outlook expects a significant drop to 98,815, possibly supported by macro patterns (like head & shoulders, or bearish divergence—not shown here but could be inferred).
The purple zones highlight high-probability reversal or reaction areas (support/resistance zones).
---
⚠️ Things to Watch
Invalidation: If price closes above 110,341 on a 4H/1D chart, the trade setup fails.
Confirmation: A strong bearish candlestick at or near the entry zone would strengthen the case.
Market Context: News, economic data, or BTC ETF inflows/outflows can quickly invalidate technical setups.

BTCUSDT: Bounce Incoming?BTCUSDT Technical analysis update
-March 2024 resistance is now expected to act as a strong support level.
-The price has touched the 0.618 Fibonacci retracement level, suggesting a potential reversal from this zone.
-The 200 EMA on the 2-day chart is positioned as a strong dynamic support, reinforcing the bullish case.
We can expect a bounce from the $72-75k level.

New buying opportunity may emerge for BTCBTC tends to fluctuate in the short term, but as BTC builds a double bottom structure to support the rebound pattern, it is currently inclined to fluctuate upward. Although the upward momentum has weakened after reaching around 106,000, as long as it stays above the 105,300-104,800 area, BTC is still expected to continue to rise and may challenge the 108,000-109,000 area again.
And with the collapse of the gold and oil markets, funds in the two markets may flow into BTC, which is more attractive and the mainstream market of cryptocurrencies. So as BTC retreats in the short term, BTC may have new short-term buying opportunities. Then if BTC retreats to the 105,500-104,500 area and does not fall below this area, we can consider going long on BTC at the right time.

MSTR Bulls Reload on BTC ConvictionMSTR – Institutional Flow + BTC Correlation + Bull Vertical Spread Setup
MicroStrategy (MSTR), operating as “Strategy,” just went full throttle—adding 10,100 BTC between June 9–15 at an average of $104,080 per coin, totaling over $1.05B. With this, they now hold 592,100 BTC (>$63B), solidifying their status as the largest Bitcoin-holding public company. That’s a bold move amid the ongoing Israel-Iran macro uncertainty, signaling confidence, not caution.
This latest BTC buy was funded via STRK and STRF ATM offerings and the $979.7M STRD preferred IPO. Since initiating their Bitcoin treasury strategy in 2020, MSTR has soared over 3,000%, and they’re projecting a 25% BTC yield for 2025 after already clocking in at 13.7% YTD.
🔎 Flow Watch
Institutional activity around current price levels has been sharp—confirming conviction behind the recent momentum. With BTC hovering at critical support, I’m eyeing a potential short-term bullish reversal. Given the tight correlation between BTC and MSTR, the setup looks primed.
🎯 My Strategy
I’m targeting a bull vertical spread—buying the 382.5 call and selling the 385 call. This defined-risk, limited-reward setup positions me to capture near-term upside if BTC begins a rebound and MSTR follows suit. The tight strike range and elevated IV make it ideal for a premium-efficient directional bet.

BTC is expected to retreat in the short term, focus on 104500📰 Impact of news:
1. The ceasefire agreement reached earlier did not take effect, and Trump believed that both sides violated the agreement
2. Federal Reserve Chairman Powell delivered a speech 3 hours later
📈 Market analysis:
I haven't updated BTC for a while. Today I want to share my views on BTC with you. BTC is currently encountering resistance and pressure at the 106,000 level and is beginning to retreat. From the technical indicators, MACD is in a dead cross, and RSI is retreating after reaching the overbought area. There is no problem with the short-term bearish trend, and it is expected that it will be able to retreat to the 104,500 level without much problem. However, the recent decline in the gold market, DXY market, and crude oil market may cause funds to flow into the BTC market.
🏅 Trading strategies:
SELL 106000-105500
TP 105000-104500
BUY 140500-103500
TP 105000-106000
If you agree with this view, or have a better idea, please leave a message in the comment area. I look forward to hearing different voices.

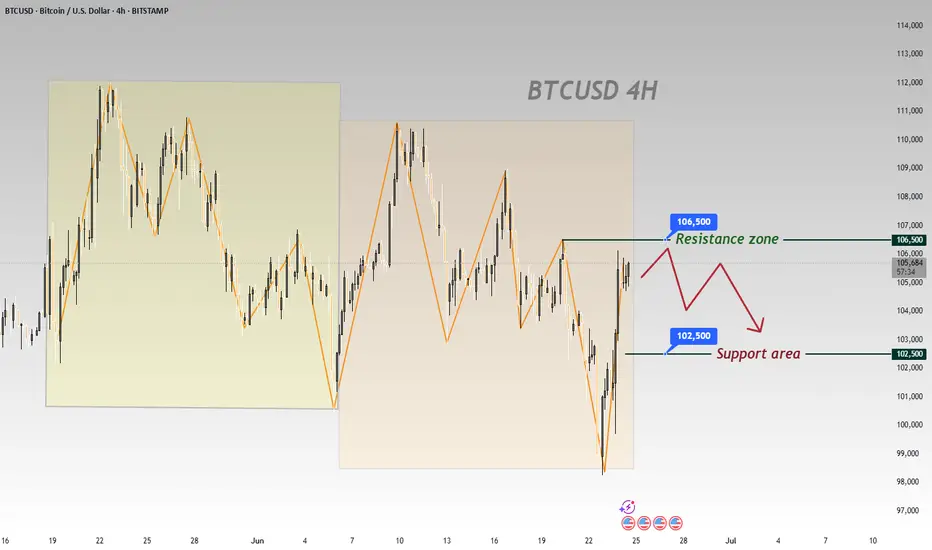
BTCUSD 4-Hour Chart Analysis: Range Bound with Bearish BiasFrom the 4 - hour chart of BTCUSD, the price movement shows obvious range - bound fluctuation characteristics 📊.
Currently, it is necessary to focus on the key resistance and support zones 🎯:
From a technical perspective, BTC is likely to oscillate repeatedly within the range in the near term 🔄, yet the overall trend leans bearish 🐻.
In the short term, opportunities for buying low and selling high within the range can be monitored 📈📉
⚡️⚡️⚡️ BTCUSD ⚡️⚡️⚡️
🚀 Sell@106500 - 105500
🚀 TP 104500 - 103500
🚀 Buy@102500 - 103500
🚀 TP 104500 - 105500
Accurate signals are updated every day 📈 If you encounter any problems during trading, these signals can serve as your reliable guide 🧭 Feel free to refer to them! I sincerely hope they'll be of great help to you 🌟 👇
Bitcoin BTC Pullback Strategy: How I’m Planning My Next EntryI’m currently watching BTCUSDT 👀. Yesterday, we saw a bullish break of structure 🔼, and my bias is to follow that momentum moving forward 📈. Right now, price is overextended 📊, so I’m looking for a retracement into equilibrium, ideally around the 50–61.8% Fibonacci zone 📏.
If price pulls back into that range and holds above the bullish imbalance (discussed in the video) 🧱, I’ll be watching for a long opportunity 🎯. My targets are set at the previous highs and the Fibonacci extension levels 🔝.
⚠️ Disclaimer
This is not financial advice. Trading involves risk, and you should only trade with capital you can afford to lose. Always do your own analysis or consult a qualified financial advisor.

Bitcoin / U.S. Dollar 4-Hour Chart - June 24, 20254-hour chart displays the Bitcoin (BTC) to U.S. Dollar (USD) price movement, currently at $105,121.98, reflecting a decrease of $258.74 (-0.25%) as of 03:15:58. The chart highlights a recent downward trend with a potential support level around $103,509.67 and a resistance zone between $104,651.27 and $107,154.41, indicated by shaded areas. The time frame spans from June 6 to June 25, 2025.

NEW BTC HIGHS?BTC just broke a previous resistance zone. Previous data indicates a more upward push.
This may even lead to new highs.
USD Index (DXY) Bullish Reversal & Breakout PotentialThe DXY chart displays a strong bullish reversal structure from the support zone near the 99,800–100,200 area. Here’s a professional breakdown of the technical setup:
🔍 Key Observations:
🟢 Bullish Reversal Formation
The price rebounded aggressively from a strong demand zone (support), marked by a green arrow and orange highlight.
Multiple historical reaction zones confirm this level's validity as a reliable support.
📉 Previous Decline & Correction
After reaching the resistance area near 110.400, the price corrected with a bearish channel.
This pullback formed a classic bull flag, a bullish continuation pattern, eventually leading to the current breakout.
🟦 Current Price Action
The market has broken out of the recent downtrend and is forming higher highs and higher lows.
A strong bullish impulse candle confirms renewed buying interest.
🧱 Support & Resistance Levels:
🔵 Resistance Zone (Target): 110.409 — a historically respected area and target for the bullish move.
🟣 Current Support Zone: 105.061 — previously resistance, now likely to act as support after the breakout.
🎯 Bullish Target Projection
If price retests and holds the support at 105.061, the next potential leg can extend towards 110.409, offering a strong risk-to-reward setup.
⚠️ Caution
Watch for a pullback and retest near the support level.
A failure to hold above 105.061 could invalidate the bullish structure.
🧠 Conclusion
The DXY is showing a bullish trend continuation after a breakout from a corrective structure. A successful retest of support could propel price towards the 110.400 target zone 📊.
Bias: ✅ Bullish above 105.061
Invalidation: ❌ Below 105.000

Bitcoin / U.S. Dollar 4-Hour Chart (BTCUSD)4-hour candlestick chart displays the price movement of Bitcoin (BTC) against the U.S. Dollar (USD) as of June 23, 2025, 03:45 PM CEST. The chart shows a recent sharp decline from a peak of approximately 104,443.81 USD to around 100,479.47 USD, with a current price of 102,035.20 USD, reflecting a 1.037.09% increase. Key levels include resistance around 104,000 USD and support near 100,000 USD, with notable volatility indicated by the candlestick patterns and a marked low point adorned with U.S. flags and a lightning bolt symbol.

Bitcoin Bounce Alert: Holding the $100K Fortress! 📉 Market Context & Technical Levels
Key support at ~$100K: As the chart shows and multiple analysts confirm, this level continues to act as a strong defence zone. Cointelegraph noted bulls have been “defending the $100K key support level strongly,” triggering bounces during dips
Descending channel overhead: Bitcoin has retraced into a downward channel. A clean breakout above ~107K–109K (past recent peaks) is needed to signal a bullish shift .
Liquidity target at ~106K: Plenty of orders await in that region—flipping it to support may pave the way for another push higher .
📊 Indicators & Momentum
RSI dip near 25 during the latest drop indicates oversold conditions—often a precursor to rebounds
.
Volume surge on rebounds suggests absorbing sell pressure and strong accumulation interest at lower levels.
🚩 Key Price Zones to Watch
Level Significance
$100K Crucial support; losing it risks a slide toward $95K–97K or even $92K
.
$105K–106K Liquidity zone; flipping here as support could confirm upward momentum .
$107K–109K Resistance from channel tops and prior highs; a successful break is key to next leg up .
$112K–$112K+ If breakout occurs, upside targets extend toward prior ATH near $112K and beyond .
🎯 Chart Analysis Summary
Your chart shows three distinct bounces from the $100K–100.7K supply zone (highlighted in blue) and the latest one includes a sharp wick and rebound. This aligns with broader market dynamics emphasizing support at $100K and building liquidity at $106K. The arrow projection signals a probable retest of ~106K, with room to challenge ~107–109K after consolidation.
🧭 Trade Outlook
Bullish scenario: Hold above $100K → reclaim $106K → trendline breakout → potential rally to $112K+.
Bearish risk: Fails support at $100K → breakdown toward $95K–92K region.
📌 Bottom Line
Support $100K is alive and well. Bounces have been crisp and volume-backed.
Next test lies at $105–106K. That’s the battleground—flip it, and we may see bitcoin reclaim recent highs.
Watch the channel overhead (~107K–109K). A breakout could open the door to fresh records.
✅ Conclusion: BTC is defending its psychological base firmly. If this zone holds once more, the path to $106K and beyond is in focus. Breaking above demands conviction, but it’s the pivot to watch.

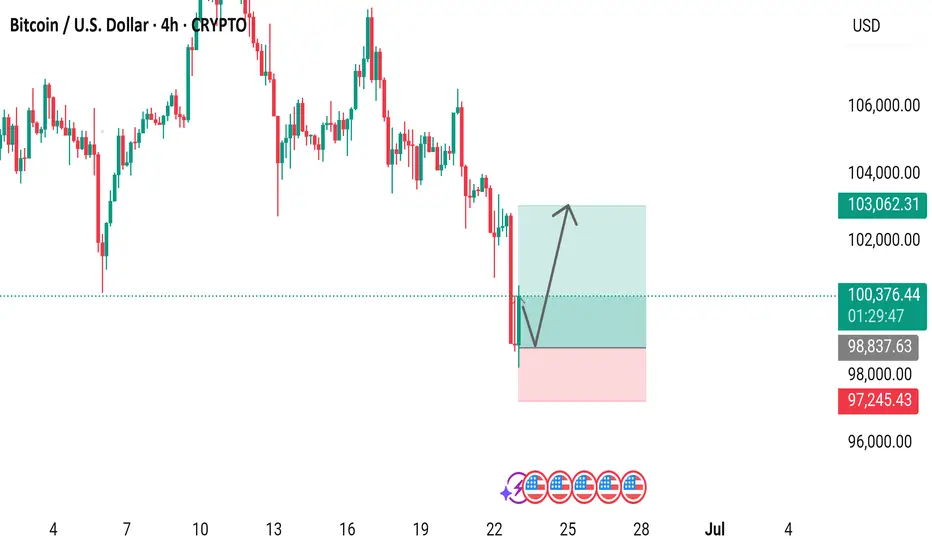
Bitcoin Price Analysis: Potential Rebound Ahead?4-hour Bitcoin price chart reveals a potential rebound opportunity. After a sharp decline, the price has stabilized around $97,245.43, forming a support level. The green and red box annotations suggest a possible price range breakout, with an upward arrow indicating a potential price increase. The current price stands at $100,461.58, down 1.63% from its recent peak. Will Bitcoin bounce back or continue its downward trend?
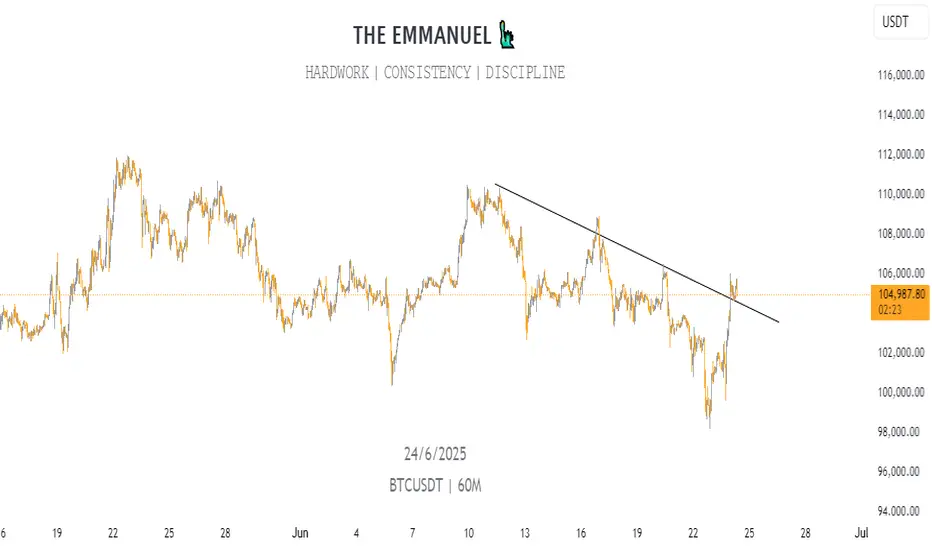
BTC pressure, price under a lot of selling pressure💎 Update Plan BTC weekend (June 22)
Notable news about BTC:
Market overview: Bitcoin's consolidation lasts in the context of increasing macro instability
US President Donald Trump expressed his caution on Thursday when he delayed the decision involving a potential direct attack on Iran for a maximum of two weeks. The global market, including cryptocurrencies, has reacted, slightly increased in Asian and European sessions when investors absorb the impact of crude oil prices in the context of interrupted transport routes.
However, traders are very cautious, reflecting the tough stance of Fed President Jerome Powell on the economy, with the reason for the expectation of inflation in the short term due to tariffs.
Bitcoin -large holders continue to accumulate despite the cautious attitudes of traders on the spot and derivative markets.
Technical analysis angle
Bitcoin price fluctuates around $ 104.057 after cutting up the day from the peak of $ 106,457 of Friday. Main technical indicators, such as relative power index (RSI), strengthen the trend of discounts when the price slip down the average line 50.
Money Flow Index (MFI) indicator, monitoring the amount of money poured into BTC, shortening the trend of increasing, stable around the middle line. This reflects the limited interest in Bitcoin on both spot markets and derivative markets.
If the weakness of the Organizing Committee overshadows the demand on the chain and network activity, supporting the exponent dynamic line (EMA) 50 days at $ 103,169 can be helpful, temporarily absorbing the pressure of selling. Overcoming this level, high fluctuations can accelerate the decline, bringing the main levels, such as EMA 100 days at $ 99,085 and EMA 200 days at $ 93,404, in.
==> Comments for trend reference. Wishing investors successfully trading

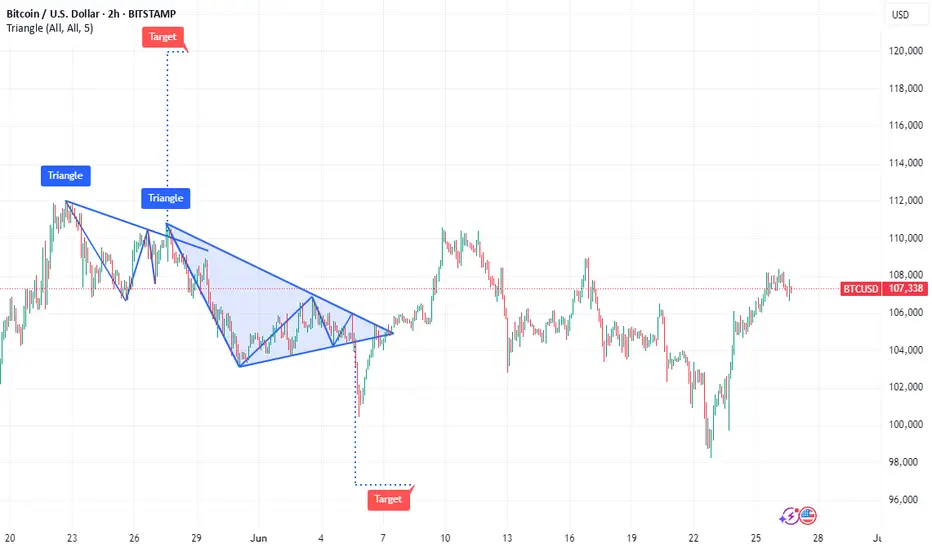
Bitcoin / U.S. Dollar 2-Hour Chart (BTCUSD)2-hour chart displays the recent price movement of Bitcoin (BTC) against the U.S. Dollar (USD), showing a current price of $102,459.21 with a decline of $853.19 (-0.83%) over the period. The chart highlights a significant drop from a peak near $105,898.45, with a shaded area indicating a potential support zone between $101,682.19 and $99,732.49, and a resistance level around $103,000. The timeframe spans from 9:00 to 29:00, with technical indicators and price levels marked for analysis.

Bitcoin (BTC/USD) 2-Hour Candlestick Chart2-hour candlestick chart displays the recent price movement of Bitcoin (BTC) against the U.S. Dollar (USD), showing a current price of $103,904.89 with a gain of $595.12 (+0.58%) as of 01:22:41. The chart highlights a volatile period with significant price fluctuations, including a sharp drop followed by a recovery, and includes key price levels such as $106,099.25 and $102,803.95. The chart also features a highlighted support zone in pink and a resistance zone in light blue

BTC Consolidates 104000-105000: Bearish Breakdown Looming?BTC Technical Update: Bitcoin has been consolidating within the 104000-105000 range for an extended period, with the overall trend showing a downward bias. With the overall trend tilting bearish, traders should watch for a break below 103500 to confirm the next leg down. 📉
⚡️⚡️⚡️ BTCUSD ⚡️⚡️⚡️
🚀 Sell@ 105000 - 104500
🚀 TP 102500 - 101500
Accurate signals are updated every day 📈 If you encounter any problems during trading, these signals can serve as your reliable guide 🧭 Feel free to refer to them! I sincerely hope they'll be of great help to you 🌟 👇

Btc seizes the opportunity to trade with the trendTechnical analysis of BTC contract on June 20:
Today, the large-cycle daily level closed with a small negative line yesterday, and the K-line pattern was a single positive line with a continuous negative line. The price was below the moving average, and the attached indicator was dead cross and running downward, but we should note that the overall volatility this week was not large, and the fluctuation was in a small range. So we should pay attention to keeping short-term trading and closing profits in time. Don't hesitate, drag, and don't think about a big rise or fall. After a large drop on Tuesday this week, the short-term hourly chart has entered a small range of fluctuations. There is no continuation or breakout, so we should just follow the trend. We have sold at the high point of 105,500 as a defense, and bought at 103,000 as a defense, for short-term trading.

Current BTC Trend Analysis and Trading RecommendationsToday, U.S. markets are closed, leading to light trading activity and relatively limited overall market volatility. From a technical analysis perspective, the 4-hour K-line chart currently shows prices trading below the middle band of the Bollinger Bands, exhibiting a classic range-bound consolidation pattern. Bulls and bears are locked in a tug-of-war between key support and resistance levels, with K-line formations alternating between bullish and bearish patterns.
In terms of chart structure, the lower support zone has demonstrated strong buying conviction, while the upper resistance level has exerted clear restrictive force. Multiple failed upward breakouts have formed a short-term top. This box consolidation—characterized by resistance above and support below—is expected to sustain sideways trading through Friday.
Against the backdrop of no major positive catalysts, bearish momentum may gradually dominate if no substantial bullish triggers emerge. Maintain a trading strategy of selling into strength.
BTCUSD
105000-105500
tp:104000-103000
Investment itself is not the source of risk; it is only when investment behavior escapes rational control that risks lie in wait. In the trading process, always bear in mind that restraining impulsiveness is the primary criterion for success. I share trading signals daily, and all signals have been accurate without error for a full month. Regardless of your past profits or losses, with my assistance, you have the hope to achieve a breakthrough in your investment.

Evening BTC Market Analysis and Trading RecommendationsToday, U.S. markets are closed, leading to light trading activity and relatively limited overall market volatility. From a technical analysis perspective, the 4-hour K-line chart currently shows prices trading below the middle band of the Bollinger Bands, exhibiting a classic range-bound consolidation pattern. Bulls and bears are locked in a tug-of-war between key support and resistance levels, with K-line formations alternating between bullish and bearish patterns.
In terms of chart structure, the lower support zone has demonstrated strong buying conviction, while the upper resistance level has exerted clear restrictive force. Multiple failed upward breakouts have formed a short-term top. This box consolidation—characterized by resistance above and support below—is expected to sustain sideways trading through Friday.
Against the backdrop of no major positive catalysts, bearish momentum may gradually dominate if no substantial bullish triggers emerge. Maintain a trading strategy of selling into strength.
BTCUSDT
105000-105500
tp:104000-103000
Investment itself is not the source of risk; it is only when investment behavior escapes rational control that risks lie in wait. In the trading process, always bear in mind that restraining impulsiveness is the primary criterion for success. I share trading signals daily, and all signals have been accurate without error for a full month. Regardless of your past profits or losses, with my assistance, you have the hope to achieve a breakthrough in your investment.
