Price isn’t reacting — it’s delivering.BTC just tapped into the 4H FVG with surgical precision.
If you’ve been watching price the way Smart Money does, this wasn’t a surprise. It was the setup.
Here's the structure:
After reclaiming the 4H OB below, price expanded upward into the Fair Value Gap (FVG 4H)
That delivery aligns with the 0.0 fib at 106,770.4 — a premium zone engineered for liquidity harvesting
The next level above is the RB — Reversal Block — where I expect displacement to either fade or accelerate
What matters now is how price reacts on the pullback into the 0.382 → 0.618 fib range (105,338.9 to 104,454.6).
If we see structure hold, I’ll target 107,082.6 next.
If that zone fails — all eyes go back to the OB 4H at 103,023.2.
Execution clarity:
Holding above 104,454 → Long bias continues
Breaking 103,825 with follow-through? Reversal confirmed
Clean invalidation, clean targets — no guessing
The chart’s not lying. It's just speaking in algorithm.
Want trades like this before they hit the box? Check the profile description. Clarity doesn’t need noise. Just rules.
Btcusdbuy

Liquidity was the excuse. Expansion was the goal.This BINANCE:BTCUSDT.P move was written before it happened — clean sweep, BPR fill, and now the setup is primed. You either knew where price was going, or you reacted late.
Price expanded aggressively into a clear 1H IFVG. That wasn’t just a push — it was a calculated run into a premium imbalance.
Now? We're retracing. Right into the EQ of the breaker block and the 0.5 fib (105,039). Exactly where the market wants you uncertain. I’m not.
Here’s the logic:
1H IFVG is filled. That’s done.
Price retraced directly into the 0.382 and 0.5 fib zone.
We have a defined BPR, and price is now hovering around its midpoint — ideal zone for reaccumulation.
As long as 104,999–105,039 holds, I expect a continuation back into 105,891 → 106,478.
If that range breaks clean, the low-hanging liquidity below 104,359 becomes a magnet.
But the narrative right now? HTF is still aligned bullish. We're in the phase where most traders get shaken out before the real move starts.
Trade idea: If I’m in, my invalidation is clean — under 104,699. Target is north of 106,000. I’ll scale partials at 105,799 and let the rest ride.
You want more trades like this? Check the account description. I don’t just post setups — I build conviction.
Let the influencers scream. I prefer precision.

BTC 4H Setup – OB Rejection or Launchpad? Bitcoin is currently ranging below a 4H Order Block (OB) and forming a potential higher low. With price holding above the key 0.618 fib zone (104.1k), this could act as a springboard for continuation — or a trap.
Key Levels:
Support: 104.1k–103.6k (fib cluster & mid-volume node)
Immediate Resistance: 105.1k (OB 4H)
Breakout Target: 107.1k
Fail-safe: 103.0k
Scenarios:
🟩 Bullish Path:
Hold 104k zone
Reclaim 105.1k OB = confirmation
Push toward 107.1k & higher liquidity sweep
🟥 Bearish Path:
Rejection from OB + break below 104k
Eyes on 103.0k as next bounce zone
Plan:
Long scalp above 104.2k if volume sustains
TP1: 105.1k (retest OB)
TP2: 107.1k
SL: Below 103.6k (tight invalidation)
📌 “OB rejection or flip? Market’s next impulse hinges on this 104k–105k squeeze.”

FVG re-entry or fail – this level decides the tone.Bitcoin tapped the 0.618 fib at ~$104,100 and front-ran the 1H demand zone. Now it's hovering at a decision point just beneath the 1H Fair Value Gap.
What to watch:
→ Price is pressing into FVG (104.4k–104.7k), aiming for acceptance.
→ Value area high sits at 104,275 – acting as pivot.
→ Break + hold above 104.7k? Clean path to 105.8k.
Plan:
Entry: 104.1k–104.3k
SL: below 103.6k
TP1: 104.9k
TP2: 105.8k (liquidity sweep)
Invalidation: Rejection from 104.7k = probable retest of 103k
Narrative flip potential:
Buyers are defending the mid-range + FVG. Breakout would shift market structure bullish on the lower timeframes.
"Acceptance above the gap = momentum reclaim."

BTC didn’t dump — it tapped.BTC reached into the 1H FVG and wicked just above the OB at 104,204 — delivering premium liquidity and then reversing.
Most are staring at red candles, but the real story is the reaction zone:
Price tagged the 0.618 level (104,559) with precision and reversed with displacement.
Now what?
We're mid-delivery. If BTC can reclaim 104,800–105,000 (mid OB/FVG confluence), a strong move into 105,865 is likely — potentially sweeping for external liquidity near 106k.
Execution Plan:
Entry: 104,600–104,700 range
SL: 104,200 or beneath 103,752 swing
TP1: 105,365
TP2: 106,000+
Key invalidation: clean break below 104,200 with volume
Bias: Bullish while above 104,200
Why: Fair Value Gap fill + OB + 0.618 convergence + responsive wick
This wasn’t a sell-off.
This was a setup.

Most called rejection. I called reaccumulation — mid-trade.This wasn’t luck. It was structure.
BTC tapped directly into the 1H Fair Value Gap at 105,016 — precisely the overlap with 0.382 fib and the volume imbalance from the prior impulse. Price didn’t just react. It delivered confirmation. Fast.
Entry was clean, risk tight — and the invalidation was defined. Below 104,517, I’m out. No emotion. Just system.
I’m now watching the 105,325–105,825 pocket. That’s where the thin volume zone transitions back into resistance — and where trapped shorts begin to feel the heat.
If price breaks and holds above 105,900, expect a swift drive into 106.7–107.0 before further consolidation.
Execution clarity:
✅ Entry: FVG 1H — 105,016
🎯 TP1: 105,825
🔒 Stop: 104,517
🔓 R:R = 2.38, no drawdown, full intent
Most wait for confirmation.
I act at the point of imbalance — not after it’s obvious.

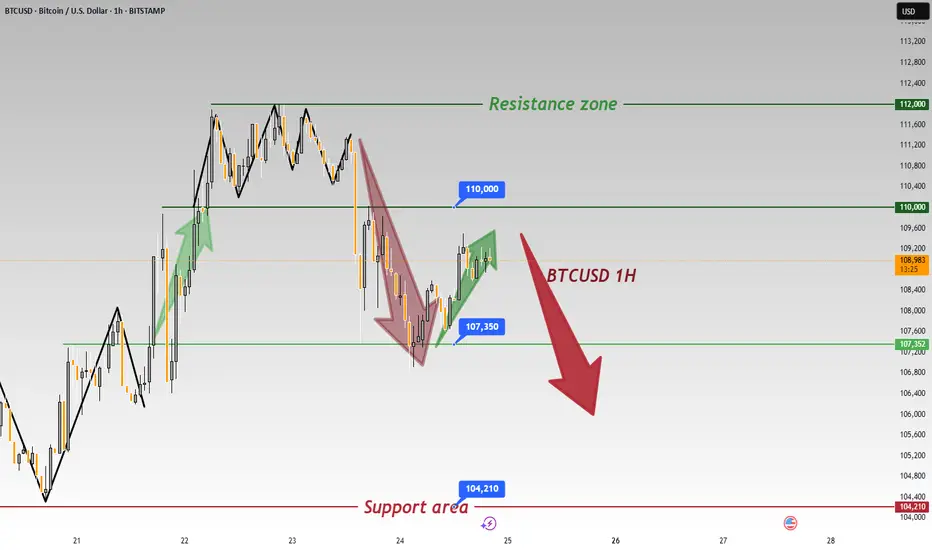
BTC/USDT – Bitcoin 1 hour timeframe 📊 Technical Overview
🟢 Support Zone:
📌 Around $105,700
🛡 Marked by multiple bounces (white arrows), this zone shows strong buyer interest.
🔁 Historically acts as a springboard for upside moves 📈.
🔴 Resistance Zone:
📌 Range: $109,000 – $111,500
🚫 Every approach has triggered a sharp sell-off (black arrows), confirming this zone as significant supply.
🔄 Price Action & Pattern Insights
📉 Bearish Swings from Resistance:
Several high-wick candles followed by strong rejections ⛔
Downward arrows suggest a distribution phase near the top range
📈 Bullish Reversal Signals:
Price sharply rebounds from support 💥
V-shaped recovery setup in motion with a clean reaction from the demand zone ✅
Arrow projection hints at a potential full range recovery 🌈
📦 Box Range Formation:
Market has been consolidating in horizontal zones
Each zone acts as a base for accumulation or distribution 🧭
🎯 Trade Idea & Forecast
📍 Current Price: $105,793.35
📈 Projected Move: Upside rally toward $111,000+
🧠 Rationale:
Bounce from a major support zone
Prior similar price actions led to parabolic rises 🚀
No lower lows made – signs of a bottom forming 🪙
📌 Action Plan
✅ Long Setup:
Entry: Above $106,000
Target: $109,000 – $111,500
Stop Loss: Below $105,000
📉 Risk/Reward: Favorable (~1:3)
🚫 Bearish Alternative:
Breakdown below $105,000 with volume ❗
Target: $103,000 (next liquidity zone)
📎 Conclusion: Ready for a Bullish Comeback?
Bitcoin (BTC/USDT) is showing signs of a textbook bullish reversal 📘 after defending a key demand level 💪. If the current momentum holds, we could see a swift move back to the top of the range. Ideal for short-term buyers looking to ride the intraday wave 🌊.

BTC isn’t bearish. It’s just collecting fuelPrice didn’t fail — it paused.
BTC retraced into the 0.382–0.5 zone after rejecting from the local high, and what looks like weakness to most is actually compression — perfectly staged above a clean 1D OB and nested FVG.
Below the current level sits the real opportunity: the imbalance between 102.4K–100.1K, backed by a 1D demand zone and high-volume support. If Smart Money wants to rebalance before the next leg, that’s where they’ll do it.
The path is simple:
Sweep into the 100.5K–102.4K zone
React off the OB
Expand to rebalance the FVG at 106.2K
Displace toward the next draw: 110.5K (final inefficiency + liquidity shelf)
Only a close below 96.9K changes the macro intent.
Execution mindset:
🔑 Optimal long: 100.5K–102.4K (OB/FVG zone)
🎯 Target 1: 106.2K
🎯 Target 2: 110.5K
❌ Invalidation: Full body close below 96.9K — structure must reset
Most traders chase the move.
I wait where Smart Money needs to act.
I’m not reacting. I’m positioned.

BITCOIN STILL BULLISH ABOVE 97K$HELLO TRADERS
As i can see Bitcion is just created a new ATH 112K$ and now is retracing to downside after a overbought condtions on RSI i am expected a new ATH till design levels if BTC Hold above 97K zone its just a trade idea share your thoughts with us in comments it help many other traders we love ur comments and support Stay Tuned for more updates

Bitcoin is nearing a critical breakout zone at $86,000Bitcoin is nearing a critical breakout zone at $86,000.
If this level breaks with strong momentum, we could see a rapid bullish continuation toward the major resistance area around $105,000. The ascending channel remains intact, and aggressive buying near support points to a strong upside setup.
From a fundamental view, Bitcoin is gaining strength as global uncertainty rises. The latest escalation of trade tariffs has disrupted traditional markets, pushing more investors toward alternative assets like Bitcoin. Historically, Bitcoin has performed strongly during times of economic instability.
Tightening monetary policies worldwide are fueling recession fears, making Bitcoin even more attractive as a hedge — the new "digital gold." With institutional interest growing, Bitcoin is well-positioned for a significant capital inflow.
Stay ready — the next big move is close! 🚀

No breakout. Just engineered liquidity. Watch how I step in.This setup didn’t need noise. Just clarity.
We took sell-side liquidity below the FVG FF with precision, tapping into a 4H OB nested at a deeper 78.6% retracement. That’s where the mispricing ends. That’s where I step in.
Price didn’t reverse because of “oversold.” It reversed because Smart Money engineered the imbalance, swept stops, and delivered into a value zone. Nothing more. Nothing less.
The rejection from that 102,067 level formed the base. From there, I expect delivery up into the 104,953 handle — where the 0.618 confluence and the upper OB sit. That’s the decision point.
Above that, we’ve got unfinished business at 107,614. If price pierces through 106,955 — where the 0.5 lines up with a previous supply — expect the full expansion into the 109,500s.
But I’m not rushing it. Liquidity above that OB at 108,122 has weight — and may serve as distribution before another push lower.
What I’m watching:
✅ Buy-side liquidity resting above 104,953
✅ OB rejection zone at 108,122
❌ 102,067 invalidation if price closes with displacement through the low
🔻 If that fails — price wants the inefficiency down near 102,051
I’m not here to catch every move.
I’m here to catch the right one.
I don’t need confirmation. I am the confirmation.

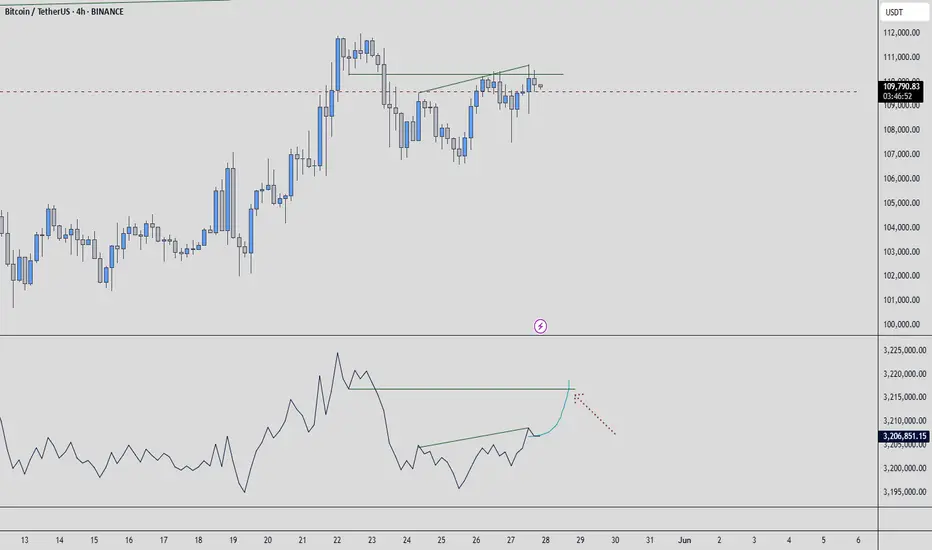
BTCUSDT Analysis: Bullish Intent Building on Higher TimeframesTaking a look at BTCUSDT. My analysis points to this current level as a significant support zone, with my overall target being higher.
While the low timeframe (LTF) action hasn't yet shown a strong influx of buyers, the picture on the higher timeframes is quite compelling. The upward movement we're seeing there is displaying solid support, indicating sustained buying interest at a larger scale.
This divergence between the LTF and HTF suggests a potential build-up of bullish momentum. We might see some consolidation or sideways movement on the lower timeframes as buyers accumulate before a more decisive push upwards.
As always, I'm keeping a close eye on the volume footprint. The sustained buying volume on the higher timeframes lends credence to this bullish outlook. I'll be waiting for the low timeframe to catch up, looking for those clear signs of buyer entry – breakouts above smaller resistances with increasing volume, and successful retests as support. CDV (Cumulative Delta Volume) on both timeframes will also be crucial in confirming this directional bias.
Remember, I focus on coins showing sudden and significant increases in volume, and while the immediate LTF might be quiet, the HTF volume profile is definitely noteworthy here.
My bias for BTCUSDT right now is upwards, given the supportive structure on the higher timeframes. However, as always, I'll be waiting for that low timeframe confirmation before considering any entries. Patience and confirmation are key, even when the higher timeframe picture looks promising. Let's see if the lower timeframes will soon echo the bullish intent we're seeing on the higher ones.
📌I keep my charts clean and simple because I believe clarity leads to better decisions.
📌My approach is built on years of experience and a solid track record. I don’t claim to know it all but I’m confident in my ability to spot high-probability setups.
📌If you would like to learn how to use the heatmap, cumulative volume delta and volume footprint techniques that I use below to determine very accurate demand regions, you can send me a private message. I help anyone who wants it completely free of charge.
🔑I have a long list of my proven technique below:
🎯 ZENUSDT.P: Patience & Profitability | %230 Reaction from the Sniper Entry
🐶 DOGEUSDT.P: Next Move
🎨 RENDERUSDT.P: Opportunity of the Month
💎 ETHUSDT.P: Where to Retrace
🟢 BNBUSDT.P: Potential Surge
📊 BTC Dominance: Reaction Zone
🌊 WAVESUSDT.P: Demand Zone Potential
🟣 UNIUSDT.P: Long-Term Trade
🔵 XRPUSDT.P: Entry Zones
🔗 LINKUSDT.P: Follow The River
📈 BTCUSDT.P: Two Key Demand Zones
🟩 POLUSDT: Bullish Momentum
🌟 PENDLEUSDT.P: Where Opportunity Meets Precision
🔥 BTCUSDT.P: Liquidation of Highly Leveraged Longs
🌊 SOLUSDT.P: SOL's Dip - Your Opportunity
🐸 1000PEPEUSDT.P: Prime Bounce Zone Unlocked
🚀 ETHUSDT.P: Set to Explode - Don't Miss This Game Changer
🤖 IQUSDT: Smart Plan
⚡️ PONDUSDT: A Trade Not Taken Is Better Than a Losing One
💼 STMXUSDT: 2 Buying Areas
🐢 TURBOUSDT: Buy Zones and Buyer Presence
🌍 ICPUSDT.P: Massive Upside Potential | Check the Trade Update For Seeing Results
🟠 IDEXUSDT: Spot Buy Area | %26 Profit if You Trade with MSB
📌 USUALUSDT: Buyers Are Active + %70 Profit in Total
🌟 FORTHUSDT: Sniper Entry +%26 Reaction
🐳 QKCUSDT: Sniper Entry +%57 Reaction
📊 BTC.D: Retest of Key Area Highly Likely
📊 XNOUSDT %80 Reaction with a Simple Blue Box!
📊 BELUSDT Amazing %120 Reaction!
📊 Simple Red Box, Extraordinary Results
📊 TIAUSDT | Still No Buyers—Maintaining a Bearish Outlook
📊 OGNUSDT | One of Today’s Highest Volume Gainers – +32.44%
📊 TRXUSDT - I Do My Thing Again
I stopped adding to the list because it's kinda tiring to add 5-10 charts in every move but you can check my profile and see that it goes on..

BTC Bull time a little correction to $86.5k or a bit lower is possible
and my prediction is BTC will rise afterwards
maybe to $88.9k
BINANCE:BTCUSDT
COINBASE:BTCUSD
𓄀𝓈𝓉𝒶𝓎 𝓉𝓊𝓃ℯ𝒹 𓃓

#BTC/USDT#BTC
The price is moving within a descending channel on the 1-hour frame, adhering well to it, and is on its way to breaking it strongly upwards and retesting it.
We are seeing a rebound from the lower boundary of the descending channel, this support at 106792.
We have a downtrend on the RSI indicator that is about to break and retest, supporting the upward trend.
We are looking for stability above the 100 moving average.
Entry price: 107234
First target: 108262
Second target: 109748
Third target: 111298

Bitcoin & Stock Market Rally Together .. My Trade Plan!🚨 Bitcoin Update! 🚨
Taking a look at the BTC chart 🧠📈 — we saw a sharp retracement followed by a strong rally 💥🔥, likely driven by recent tariff policy shifts 🌍📊.
Right now, I’m leaning bullish 🐂 — especially with the stock markets also pushing higher 📈💹. But let’s be clear: my bullish bias depends on the stock market holding strong 🛡️📊.
I’m keeping an eye out for a pullback to the 61.8% Fibonacci level 🌀 for a potential buy opportunity 💸🚀.
⚠️ This is not financial advice — just sharing my outlook!
👇 Let me know what you think in the comments!

BTCUSDT | No Rejection Yet, Higher Targets in SightThe current price action is still leaning bullish. We haven’t seen a sharp rejection or breakdown from key structure — and until that happens, I expect the move to stretch toward the 107,600 region.
Volume remains consistent, and there’s subtle support in the lower timeframes. Buyers are holding their ground, and as long as that continues, the path of least resistance remains up.
Wait for price to disprove the idea before abandoning it. That’s how you stay ahead.
📌I keep my charts clean and simple because I believe clarity leads to better decisions.
📌My approach is built on years of experience and a solid track record. I don’t claim to know it all but I’m confident in my ability to spot high-probability setups.
📌If you would like to learn how to use the heatmap, cumulative volume delta and volume footprint techniques that I use below to determine very accurate demand regions, you can send me a private message. I help anyone who wants it completely free of charge.
🔑I have a long list of my proven technique below:
🎯 ZENUSDT.P: Patience & Profitability | %230 Reaction from the Sniper Entry
🐶 DOGEUSDT.P: Next Move
🎨 RENDERUSDT.P: Opportunity of the Month
💎 ETHUSDT.P: Where to Retrace
🟢 BNBUSDT.P: Potential Surge
📊 BTC Dominance: Reaction Zone
🌊 WAVESUSDT.P: Demand Zone Potential
🟣 UNIUSDT.P: Long-Term Trade
🔵 XRPUSDT.P: Entry Zones
🔗 LINKUSDT.P: Follow The River
📈 BTCUSDT.P: Two Key Demand Zones
🟩 POLUSDT: Bullish Momentum
🌟 PENDLEUSDT.P: Where Opportunity Meets Precision
🔥 BTCUSDT.P: Liquidation of Highly Leveraged Longs
🌊 SOLUSDT.P: SOL's Dip - Your Opportunity
🐸 1000PEPEUSDT.P: Prime Bounce Zone Unlocked
🚀 ETHUSDT.P: Set to Explode - Don't Miss This Game Changer
🤖 IQUSDT: Smart Plan
⚡️ PONDUSDT: A Trade Not Taken Is Better Than a Losing One
💼 STMXUSDT: 2 Buying Areas
🐢 TURBOUSDT: Buy Zones and Buyer Presence
🌍 ICPUSDT.P: Massive Upside Potential | Check the Trade Update For Seeing Results
🟠 IDEXUSDT: Spot Buy Area | %26 Profit if You Trade with MSB
📌 USUALUSDT: Buyers Are Active + %70 Profit in Total
🌟 FORTHUSDT: Sniper Entry +%26 Reaction
🐳 QKCUSDT: Sniper Entry +%57 Reaction
📊 BTC.D: Retest of Key Area Highly Likely
📊 XNOUSDT %80 Reaction with a Simple Blue Box!
📊 BELUSDT Amazing %120 Reaction!
📊 Simple Red Box, Extraordinary Results
📊 TIAUSDT | Still No Buyers—Maintaining a Bearish Outlook
📊 OGNUSDT | One of Today’s Highest Volume Gainers – +32.44%
I stopped adding to the list because it's kinda tiring to add 5-10 charts in every move but you can check my profile and see that it goes on..
Bitcoin: Will it surpass $109k in its upward trend?Since April, Bitcoin has traded in a clearly defined upward channel with two lower and upper trend lines. This channel was formed three touchpoints both on the lower and upper trendlines.
Near a critical zone
Now, BTC is at a key resistance zone where it previously peaked around $109,000, holding its all-time high. This level resists both judgement as well as forensic level significantly of a psychological barrier because it was the peak of the last major bull cycle. The price is currently hovering around the everyday resistance line while BTC is still in the upward channel. In conjunction with the historic all-time high and the upper channel resistance, range bound price action gives us an accurate capture of BTC’s behaviour.
Bullish breakout
The scenario outlined for this resistance zone makes the most sense as a rejection may lead to a temporary pullback, likely to the somewhat lower boundary of the rising channel. This in itself would not be the termination of the bullish trend, but instead a healthy retracement within the confines of an uptrend structure. But, if the market does break out above the $109,000 level with ample volume and bullish momentum, then things could start changing in the market for the better from there. Such breakout will confirm the uptrend is strong and valid where else new breakout targets will also be set turning the old high into new low. The $109,000 level would then probably move from resistance to support, making it a critical area for bulls to protect on any retests in the future.
A bearish breakout
The ramifications of a breakdown below the rising channel should also be understood by traders. It is crucial to keep an eye on the channel's lower barrier, which is presently at about $104,000. A significant decline below this level would signal a loss of short-term bullish momentum and lead to a more thorough correction. In that scenario, Bitcoin would probably go for the imbalanced area between $97,500 and $100,500, where the price has previously moved quickly without forming any solid support or resistance. Buyers may be able to intervene in this zone and try to restore bullish dominance, which may pave the way for a new breakout attempt and another surge toward the $109,000 barrier.
Conclusion
In conclusion, Bitcoin is at a critical point right now. Bitcoin is currently facing a significant resistance zone at its prior all-time high, but the upward channel that has directed price action since April is still in place. The degree of market momentum and the actions of buyers and sellers at these critical levels will determine whether the price hits new highs or declines. Investors and traders should be alert and ready for both situations since the next action could determine how Bitcoin develops over the following few weeks.
I appreciate your help.
To ensure you do not miss the upcoming analysis, be sure to follow me!
Please leave a remark and a like!

BITCOIN SIGNALS (DON'T MISS)Hello friends
Given the good price growth we had, you can see that the price has entered a correction and has provided us with a good opportunity to buy in steps in the specified support areas (of course with capital management)
The targets have also been specified...
*Trade safely with us*
Bitcoin (BTC/USDT) – Flag Breakout Points to $114KHello guys!
Bitcoin continues to respect the bullish structure within its ascending channel, and we just got a clean breakout from a textbook bull flag.
After a solid move higher earlier this month, BTC cooled off inside a tight flag pattern, consolidating above $106K. That pullback helped reset momentum, and now we’ve broken out with conviction.
You can read about it here:
We’re currently hovering around $ 109.8 K. A short-term retest of the breakout zone near $108K–$108.5K wouldn’t be surprising. it could even offer a great entry opportunity before the next leg up.
If momentum holds, the projected target from this flag pattern lands in the $113.5K–$114K zone.
watch these:
Support: $107.5K–$108.5K
Target: $114K
Invalidation: Break below $107K
Bias remains bullish unless we lose the channel structure.

$BTC to $120K?Bitcoin is still moving strongly inside the ascending channel, respecting both support and midline zones.
After bouncing from the lower boundary and holding above key horizontal support at $104.8K, BTC is showing signs of strength again.
With the trend intact and momentum building, a breakout toward the $116k 120k supply zone looks likely in the coming days.
Bulls remain in control as long as price holds above the mid channel and key FVG (Fair Value Gap) areas.
Watch the channel closely for confirmation.
DYRO, NFA

BTC Crypto Futures Trade Plan 2025-05-26BTC Crypto Analysis Summary (2025-05-26)
Comprehensive Summary of Each Model
Grok/xAI Report
BTC at $109,553, trading above all major MAs (20/50/200 SMAs, 9/21 EMAs) → strong bullish trend RSI 67.02 (approaching overbought), MACD positive but slight bearish divergence Volume declining → possible consolidation or reduced buying interest Funding rate low (0.0002%) → not overleveraged long Trade suggested: long at $110,000, SL $107,000, TP1 $113,000, TP2 $115,000, size 1% equity, confidence 80%
Claude/Anthropic Report
Confirms price above all key MAs, RSI approaching overbought, MACD divergence Price near upper Bollinger Band → resistance Concludes short-term momentum weakening → moderately bearish bias Recommends no trade (confidence 72%), waits for break above $111,800 or below $105,000
Llama/Meta Report
Bullish MA alignment, RSI slightly overbought, price near upper BB Funding rate neutral, sentiment generally positive Trade suggested: long on pullback to SMA20 at $105,295.59, SL $103,000, TP $110,000, size = 2–3% equity, confidence 80%
Gemini/Google Report
Strong bullish trend (EMA9 > EMA21 > SMA20 > SMA50 > SMA200), RSI 67, BB upper ~$111,724 MACD bearish crossover → potential short-term pullback Recommends long at ~$109,550, SL $107,700, TP $113,100, size 1 BTC, confidence 75%
DeepSeek Report
Price near upper Bollinger Band, MACD bearish crossover, RSI divergence Countertrend short trade: entry $109,553, SL $111,725, TP $105,295, size 1 BTC, confidence 75% Areas of Agreement and Disagreement
Agreement
BTC is in a strong uptrend, trading above all major moving averages RSI ~67 suggests rising momentum but nearing overbought MACD shows a bearish divergence or crossover, warning of short-term momentum loss Price is close to the upper Bollinger Band → stretched conditions
Disagreement
Directional bias: Grok, Llama, and Gemini bullish; Claude is cautious/no-trade; DeepSeek bearish countertrend Entry levels: ranges from pullbacks to 105k (Llama) to market price ~109.55k (Gemini/Grok) Risk appetite: varying leverage and position-sizing recommendations Trade/no-trade: Claude advises holding; others recommend active positions Conclusion and Trade Recommendation
Overall Market Direction Consensus
Moderately Bullish: the dominant trend is up, supported by MA structure and recent performance, despite short-term momentum warnings.
Recommended Trade
Direction: Long BTC futures Entry Range: Near current market (109,500–109,600) or immediate retest of EMA9 (~109,550) Stop Loss: 107,700 (below EMA9 and minor support) Take Profit: 113,100 (just above recent swing highs/upper BB) Position Size: 1 BTC (adjust per account to risk ~1–2%) Confidence Level: 78%
Key Risks and Considerations
Momentum Divergence: MACD bearish crossover and RSI near overbought may trigger a pullback Volatility Spikes: leverage can amplify slippage and liquidation risk Broader Crypto Moves: altcoin correlation or market-wide news can quickly shift prices Funding Rate Shifts: a sudden spike could accelerate long-side liquidations
TRADE_DETAILS (JSON Format) { "instrument": "BTC", "direction": "long", "entry_price": 109550.0, "stop_loss": 107700.0, "take_profit": 113100.0, "size": 1, "confidence": 0.78, "entry_timing": "market_open" }
📊 TRADE DETAILS 📊 🎯 Instrument: BTC 📈 Direction: LONG 💰 Entry Price: 109550.0 🛑 Stop Loss: 107700.0 🎯 Take Profit: 113100.0 📊 Size: 1 💪 Confidence: 78% ⏰ Entry Timing: market_open
Disclaimer: This newsletter is not trading or investment advice but for general informational purposes only. This newsletter represents my personal opinions based on proprietary research which I am sharing publicly as my personal blog. Futures, stocks, and options trading of any kind involves a lot of risk. No guarantee of any profit whatsoever is made. In fact, you may lose everything you have. So be very careful. I guarantee no profit whatsoever, You assume the entire cost and risk of any trading or investing activities you choose to undertake. You are solely responsible for making your own investment decisions. Owners/authors of this newsletter, its representatives, its principals, its moderators, and its members, are NOT registered as securities broker-dealers or investment advisors either with the U.S. Securities and Exchange Commission, CFTC, or with any other securities/regulatory authority. Consult with a registered investment advisor, broker-dealer, and/or financial advisor. By reading and using this newsletter or any of my publications, you are agreeing to these terms. Any screenshots used here are courtesy of TradingView. I am just an end user with no affiliations with them. Information and quotes shared in this blog can be 100% wrong. Markets are risky and can go to 0 at any time. Furthermore, you will not share or copy any content in this blog as it is the authors' IP. By reading this blog, you accept these terms of conditions and acknowledge I am sharing this blog as my personal trading journal, nothing more.

Accumulate waiting for the next new ATH, BTC 💎 Update Plan BTC (May 26)
Notable news about BTC:
Bitcoin (BTC) is trading above $109,000 as of Monday, staging a solid rebound after Friday’s sharp pullback. The recovery has been largely driven by renewed optimism following US President Donald Trump’s decision to postpone the implementation of a 50% tariff on European Union imports. This move helped calm market jitters and reignited investor appetite for risk assets, including digital currencies.
Institutional interest in Bitcoin also appears to be gaining momentum, with the latest data showing the strongest weekly inflows since late April—an encouraging sign that confidence in the asset remains resilient despite recent volatility.
Trump’s tariff delay spurs BTC bounce
In a post on his Truth Social platform, President Trump announced an extension of the EU tariff deadline to July 9, backing away from the previously scheduled June 1 hike. This announcement came just days after he criticized the lack of progress in negotiations with Brussels, which had rattled markets and led to a 3.9% drop in BTC on Friday. The policy reversal helped restore calm and provided a tailwind for Bitcoin’s upward move to start the week.
Technical analysis angle
The question that investors most interested now is when BTC will have 120k?
Congratulations to the investors. BTC goes on our analysis. Although the price is sideways, we still earn 3000 prices from this coin.
Note that the 113k region can be an important price area for adjustment before 120k and even higher
🔥BTC 4H is currently in the adjustment phase, this time will cause a lot of traders, Future - Margin to lose money, this rhythm will last long
At this time, whether new or old, should spend more time to practice, load more knowledge about the PTKT, as well as find knowledge posts at the channel ..., to strengthen the solid foundation, as well as avoid losing money at this time offline
==> Comments for trend reference. Wishing investors successfully trading

Gold Surges, Euro Plunges, BTC at RiskOn May 23rd's U.S. session, Trump's EU/Apple tariff plans sparked market chaos:
Gold surged 💥 as a safe haven.
The euro plunged on EU tariff fears.
If tariffs persist, capital may flood into gold/forex, likely triggering a BTC crash.
⚡⚡⚡ BTCUSD ⚡⚡⚡
🚀 Sell@109500 - 108500
🚀 T P 106500 - 104500
👇Accurate signals are updated every day 📈 If you encounter any problems during trading, these signals can serve as your reliable guide 🧭 Feel free to refer to them! I sincerely hope they'll be of great help to you 👇