#BTC/USDT#BTC
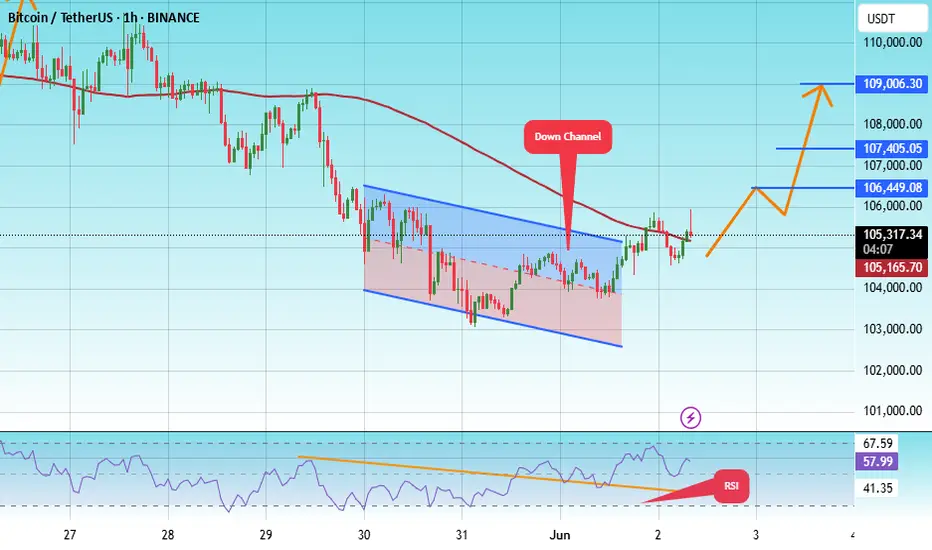
The price is moving within a descending channel on the 1-hour frame, adhering well to it, and is heading for a strong breakout and retest.
We are experiencing a rebound from the lower boundary of the descending channel, which is support at 103141.
We are experiencing a downtrend on the RSI indicator, which is about to break and retest, supporting the upward trend.
We are looking for stability above the 100 moving average.
Entry price: 105268
First target: 106500
Second target: 107405
Third target: 109006
BTCUSDC
It didn’t reject. It repriced.BINANCE:BTCUSDT just tested the 4H OB at 105,044 — and didn’t break. That’s not weakness. That’s precision. The kind of structure Smart Money doesn’t chase, it absorbs.
Here’s the breakdown:
Price retraced into a clean OB off the 0.236 fib, holding structure without even needing to sweep the BPR below
Volume supported the move — no absorption, no deviation
Short-term high is now marked at 106,487, and above that, my next draw is 108,941
If price closes back above 106,000 with momentum, the path of least resistance is clear: continuation. If we lose the OB and reclaim fails, BPR becomes the fallback zone — anything deeper, and we’re re-evaluating the narrative.
Execution plan:
Long from OB (already tested) — continuation depends on reclaiming 106K
TP1: 106,689
TP2: 108,941
Invalidation: 103,429 (50% fib) or hard break into 102.7 BPR
There’s no “maybe” in structure. Price is either reacting or it isn’t. This one is.
Setups this precise don’t wait — they’re mapped. You’ll find more in the profile description.

Bitcoin (BTCUSD) - Daily Price Consolidation Under ResistanceBitcoin (BTCUSD) price has been in a short-term downtrend since June 2025.
Price is currently consolidating under $106,000 resistance.
Watching to see if an evening star candle pattern prints on the daily chart, for a very-short-term pullback.
Support targets: $105,000, $104,000, $101,000, $100,000.
Resistance targets: $107,000, $109,000, $110,000, $112,000.
Bitcoin has been correlating with the USA stock market, tech stocks, consumer sentiment, and breaking news.

Last 133 days of the bull market!This idea gives more details about the pint in the cycle we are at right now. When measuring the duration between halving and tops we usually see the best in ~500 days after the halving. Following my previous idea about topping in October you can find the same pattern translating in 546 days after last halving. If this proves right , we are about 133 days before top. At this point we should see fireworks till October. In blue is price action in those 133 in 2017 and in yellow 2021, according to the btc nature of diminishing returns we should see peaks bellow those years.Cheers

Technical analysis of BTC contracts (outlook for next week)Technical analysis of BTC contract on June 7 (next week outlook):
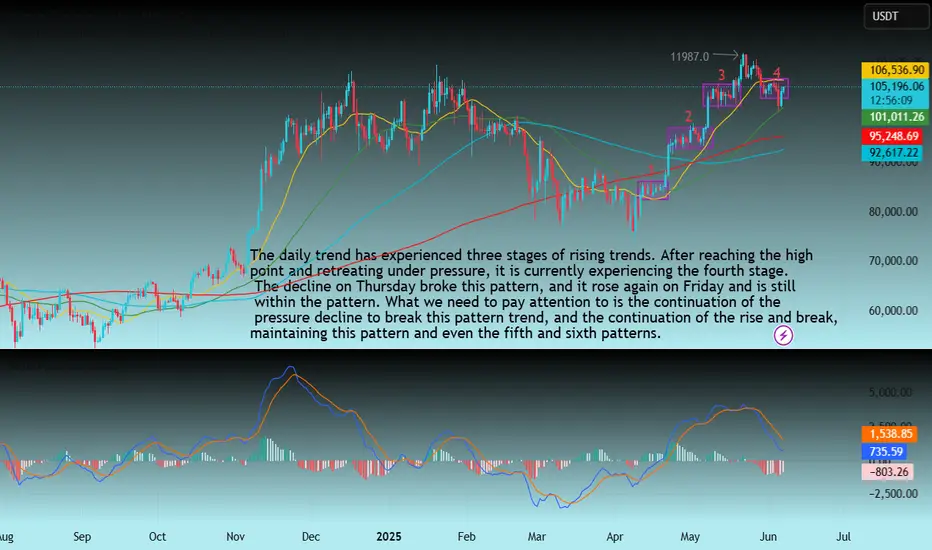
The weekly trend, after the price hit the high point of 112000 area, it retreated under pressure. The current K-line pattern is negative, but the price is still at a high level, which also exacerbates the overall trend of volatility. The daily price was fluctuating downward before Friday. The impact of yesterday's data caused the price to rise, which seemed to break this trend, and it also became contradictory. The technical indicators of the four-hour chart and the hourly chart changed very quickly, and there was no reference signal for the medium and long term; in general, the current trend will continue the oscillating pattern, with the upper pressure position in the 107000 area and the low point support position in the 100600 area;
BTC-----Sell around 104000, target 102000 areaTechnical analysis of BTC contract on June 6:
Today, the large-cycle daily level closed with a big negative line yesterday, the K-line pattern continued to fall, the price was below the moving average, and the attached indicator was dead cross. The large trend of falling again appeared to be advantageous. The price continued to break the previous low position, and the upward stage trend was also broken, so the market outlook will also fluctuate downward; the short-cycle hourly chart of the US market fell sharply, and the low point touched the 100300 area. The price supported the rebound in the morning. The current K-line pattern continued to rise, and the attached indicator was golden cross, but the price was already close to the moving average resistance of the four-hour chart. Today, the decline continued to break the low, and the rebound strength could not be large. This is a rule.
BTC short-term contract trading strategy:
Sell at the 104000 area, stop loss at the 104500 area, and target the 102000 area;

Price tapped the low — but didn’t break structure. That’s all I BTC delivered a clean sweep into the 15M low, filled the imbalance, and now it’s reclaiming. If you’re still wondering whether it’s valid — you’re not reading structure. You’re chasing candles.
Here’s the setup:
Price swept a key low at 104,870.98, tapping into a precision FVG
That move also kissed the edge of a lower BPR — institutional order flow at work
Now we’re rotating back toward the 15M OB near 106,438.94, with the first real reaction zone at 105,779.08
Above that, fib confluence and the OB offer a decision point: either distribute from 106.4 or break higher into premium inefficiency zones.
If price stalls at 0.5 (105,831) and rejects hard, I’ll expect a revisit to the low. If we blow through with displacement — we’re heading higher.
Execution bias:
Longs are valid as long as price holds above 104,870
TP1: 105,779
TP2: 106,438
Failure to reclaim FVG = scenario invalid, stand down
This isn’t a “setup.” It’s a replay of logic. The market does this every day — if you know how to listen.
More trades like this? No noise, just precision — check the profile description.

BTC Bitcoin Warning: No Clear Setup — Don’t Get Trapped!🚨 BTC Market Outlook: Analysis & Key Warning for Traders 🧠💡
Currently keeping a close eye on Bitcoin (BTC) 🔍. Previously, we saw strong bullish momentum propelling price upward 📈. However, that momentum is now under pressure — especially when you zoom into the 4-hour timeframe. We've seen a clear break in market structure, with lower highs and lower lows forming 🔻.
Right now, there’s no clean trade setup on the table. Price has pulled back, and we’re at a key inflection point — either we see a bullish breakout, or further downside could unfold 📉.
This video is more of a technical warning ⚠️ for traders feeling the urge to jump in early. The current structure is risky, and taking impulsive trades here could do more harm than good.
In the video, I also cover how to identify the highest-probability setups — particularly when price consolidates in a range and then breaks out in the direction of the prevailing trend. These continuation setups offer far better odds than guessing mid-range.
📌 Be patient. Let the setup come to you. Don’t force trades when conditions are unclear.
💬 If you’ve watched the analysis or have thoughts on BTC’s next move, comment below — I’d love to hear your view.
❗️Disclaimer: This is not financial advice. Everything shared is for educational purposes only. Always do your own analysis and trade responsibly. Risk management is key.

Price is coiled. Expansion is near. The setup is clean — if you BINANCE:BTCUSDT has reclaimed its 4H range low and is now driving into the midpoint of a prior leg. This isn’t random — it’s the prelude to a move Smart Money has been framing for days.
Here’s the breakdown:
Price respected the 0.618 (105,780) and rotated upward — that level is now the line between structure and noise
First objective: OB 4H at 107,839, aligning with 0.5 → 0.382 retracement
If that gets cleared with displacement, we extend into 109,621 — final premium zone before HTF liquidity is satisfied
The upper wick at 111,897 is still untouched — a long-term draw that only unlocks if we break 109k with intent
But if price fails and flips below 105,780, that signals fading momentum — and opens the door for a sweep toward the 4H OB at 104,116 or even the FVG 4H down near 101,998
Execution mindset:
Longs are valid above 105,780
Targeting: 107.8 → 109.6 → possibly 111.9
Invalidation: Daily close below 104,116
Liquidity lies above — Smart Money is already positioned
You don’t need signals when structure tells the story. You just need precision.
More entries, levels, and logic? They’re in the profile description — not in the crowd.

Price isn’t reacting — it’s delivering.BTC just tapped into the 4H FVG with surgical precision.
If you’ve been watching price the way Smart Money does, this wasn’t a surprise. It was the setup.
Here's the structure:
After reclaiming the 4H OB below, price expanded upward into the Fair Value Gap (FVG 4H)
That delivery aligns with the 0.0 fib at 106,770.4 — a premium zone engineered for liquidity harvesting
The next level above is the RB — Reversal Block — where I expect displacement to either fade or accelerate
What matters now is how price reacts on the pullback into the 0.382 → 0.618 fib range (105,338.9 to 104,454.6).
If we see structure hold, I’ll target 107,082.6 next.
If that zone fails — all eyes go back to the OB 4H at 103,023.2.
Execution clarity:
Holding above 104,454 → Long bias continues
Breaking 103,825 with follow-through? Reversal confirmed
Clean invalidation, clean targets — no guessing
The chart’s not lying. It's just speaking in algorithm.
Want trades like this before they hit the box? Check the profile description. Clarity doesn’t need noise. Just rules.

Bitcoin (BTCUSDT) - Price Testing 26EMA and 12EMA - Daily ChartBitcoin (BTCUSDT) price is currently testing the 26EMA and 12EMA price levels on the Daily chart.
Bitcoin price has been in a medium-term uptrend since April and May 2025.
However, a short-term downtrend pullback has occurred and the price recently bounced up from the 26EMA zone ($104,000).
A morning star candle price pattern printed above the 26 EMA support line.
Large buyer volume could confirm the price candle pattern and Bitcoin price could rally up above 12EMA resistance ($106,000).
If price continues to reject and fall below $106,000 the downtrend would likely continue into June 2025.
Breaking news and stock market correlations could affect the price of Bitcoin and cryptocurrencies.
Tariff news and trade deals are supposed to occur throughout June and July 2025.

BTC 4H Setup – OB Rejection or Launchpad? Bitcoin is currently ranging below a 4H Order Block (OB) and forming a potential higher low. With price holding above the key 0.618 fib zone (104.1k), this could act as a springboard for continuation — or a trap.
Key Levels:
Support: 104.1k–103.6k (fib cluster & mid-volume node)
Immediate Resistance: 105.1k (OB 4H)
Breakout Target: 107.1k
Fail-safe: 103.0k
Scenarios:
🟩 Bullish Path:
Hold 104k zone
Reclaim 105.1k OB = confirmation
Push toward 107.1k & higher liquidity sweep
🟥 Bearish Path:
Rejection from OB + break below 104k
Eyes on 103.0k as next bounce zone
Plan:
Long scalp above 104.2k if volume sustains
TP1: 105.1k (retest OB)
TP2: 107.1k
SL: Below 103.6k (tight invalidation)
📌 “OB rejection or flip? Market’s next impulse hinges on this 104k–105k squeeze.”

BTC isn’t bearish. It’s just collecting fuelPrice didn’t fail — it paused.
BTC retraced into the 0.382–0.5 zone after rejecting from the local high, and what looks like weakness to most is actually compression — perfectly staged above a clean 1D OB and nested FVG.
Below the current level sits the real opportunity: the imbalance between 102.4K–100.1K, backed by a 1D demand zone and high-volume support. If Smart Money wants to rebalance before the next leg, that’s where they’ll do it.
The path is simple:
Sweep into the 100.5K–102.4K zone
React off the OB
Expand to rebalance the FVG at 106.2K
Displace toward the next draw: 110.5K (final inefficiency + liquidity shelf)
Only a close below 96.9K changes the macro intent.
Execution mindset:
🔑 Optimal long: 100.5K–102.4K (OB/FVG zone)
🎯 Target 1: 106.2K
🎯 Target 2: 110.5K
❌ Invalidation: Full body close below 96.9K — structure must reset
Most traders chase the move.
I wait where Smart Money needs to act.
I’m not reacting. I’m positioned.

BTCUSDT Analysis: Bullish Intent Building on Higher TimeframesTaking a look at BTCUSDT. My analysis points to this current level as a significant support zone, with my overall target being higher.
While the low timeframe (LTF) action hasn't yet shown a strong influx of buyers, the picture on the higher timeframes is quite compelling. The upward movement we're seeing there is displaying solid support, indicating sustained buying interest at a larger scale.
This divergence between the LTF and HTF suggests a potential build-up of bullish momentum. We might see some consolidation or sideways movement on the lower timeframes as buyers accumulate before a more decisive push upwards.
As always, I'm keeping a close eye on the volume footprint. The sustained buying volume on the higher timeframes lends credence to this bullish outlook. I'll be waiting for the low timeframe to catch up, looking for those clear signs of buyer entry – breakouts above smaller resistances with increasing volume, and successful retests as support. CDV (Cumulative Delta Volume) on both timeframes will also be crucial in confirming this directional bias.
Remember, I focus on coins showing sudden and significant increases in volume, and while the immediate LTF might be quiet, the HTF volume profile is definitely noteworthy here.
My bias for BTCUSDT right now is upwards, given the supportive structure on the higher timeframes. However, as always, I'll be waiting for that low timeframe confirmation before considering any entries. Patience and confirmation are key, even when the higher timeframe picture looks promising. Let's see if the lower timeframes will soon echo the bullish intent we're seeing on the higher ones.
📌I keep my charts clean and simple because I believe clarity leads to better decisions.
📌My approach is built on years of experience and a solid track record. I don’t claim to know it all but I’m confident in my ability to spot high-probability setups.
📌If you would like to learn how to use the heatmap, cumulative volume delta and volume footprint techniques that I use below to determine very accurate demand regions, you can send me a private message. I help anyone who wants it completely free of charge.
🔑I have a long list of my proven technique below:
🎯 ZENUSDT.P: Patience & Profitability | %230 Reaction from the Sniper Entry
🐶 DOGEUSDT.P: Next Move
🎨 RENDERUSDT.P: Opportunity of the Month
💎 ETHUSDT.P: Where to Retrace
🟢 BNBUSDT.P: Potential Surge
📊 BTC Dominance: Reaction Zone
🌊 WAVESUSDT.P: Demand Zone Potential
🟣 UNIUSDT.P: Long-Term Trade
🔵 XRPUSDT.P: Entry Zones
🔗 LINKUSDT.P: Follow The River
📈 BTCUSDT.P: Two Key Demand Zones
🟩 POLUSDT: Bullish Momentum
🌟 PENDLEUSDT.P: Where Opportunity Meets Precision
🔥 BTCUSDT.P: Liquidation of Highly Leveraged Longs
🌊 SOLUSDT.P: SOL's Dip - Your Opportunity
🐸 1000PEPEUSDT.P: Prime Bounce Zone Unlocked
🚀 ETHUSDT.P: Set to Explode - Don't Miss This Game Changer
🤖 IQUSDT: Smart Plan
⚡️ PONDUSDT: A Trade Not Taken Is Better Than a Losing One
💼 STMXUSDT: 2 Buying Areas
🐢 TURBOUSDT: Buy Zones and Buyer Presence
🌍 ICPUSDT.P: Massive Upside Potential | Check the Trade Update For Seeing Results
🟠 IDEXUSDT: Spot Buy Area | %26 Profit if You Trade with MSB
📌 USUALUSDT: Buyers Are Active + %70 Profit in Total
🌟 FORTHUSDT: Sniper Entry +%26 Reaction
🐳 QKCUSDT: Sniper Entry +%57 Reaction
📊 BTC.D: Retest of Key Area Highly Likely
📊 XNOUSDT %80 Reaction with a Simple Blue Box!
📊 BELUSDT Amazing %120 Reaction!
📊 Simple Red Box, Extraordinary Results
📊 TIAUSDT | Still No Buyers—Maintaining a Bearish Outlook
📊 OGNUSDT | One of Today’s Highest Volume Gainers – +32.44%
📊 TRXUSDT - I Do My Thing Again
I stopped adding to the list because it's kinda tiring to add 5-10 charts in every move but you can check my profile and see that it goes on..

Fireworks after the summerBitcoin to climax in Aug/Sep 2025.
The charts are a little skewed because of depreciating dollar. There is no new ATH on the BTCEUR and BTCGBP charts. Don't get fooled by this range-bound move.
Let's try this.

#BTC/USDT#BTC
The price is moving within a descending channel on the 1-hour frame, adhering well to it, and is on its way to breaking it strongly upwards and retesting it.
We are seeing a rebound from the lower boundary of the descending channel, this support at 106792.
We have a downtrend on the RSI indicator that is about to break and retest, supporting the upward trend.
We are looking for stability above the 100 moving average.
Entry price: 107234
First target: 108262
Second target: 109748
Third target: 111298

BTCUSDT | No Rejection Yet, Higher Targets in SightThe current price action is still leaning bullish. We haven’t seen a sharp rejection or breakdown from key structure — and until that happens, I expect the move to stretch toward the 107,600 region.
Volume remains consistent, and there’s subtle support in the lower timeframes. Buyers are holding their ground, and as long as that continues, the path of least resistance remains up.
Wait for price to disprove the idea before abandoning it. That’s how you stay ahead.
📌I keep my charts clean and simple because I believe clarity leads to better decisions.
📌My approach is built on years of experience and a solid track record. I don’t claim to know it all but I’m confident in my ability to spot high-probability setups.
📌If you would like to learn how to use the heatmap, cumulative volume delta and volume footprint techniques that I use below to determine very accurate demand regions, you can send me a private message. I help anyone who wants it completely free of charge.
🔑I have a long list of my proven technique below:
🎯 ZENUSDT.P: Patience & Profitability | %230 Reaction from the Sniper Entry
🐶 DOGEUSDT.P: Next Move
🎨 RENDERUSDT.P: Opportunity of the Month
💎 ETHUSDT.P: Where to Retrace
🟢 BNBUSDT.P: Potential Surge
📊 BTC Dominance: Reaction Zone
🌊 WAVESUSDT.P: Demand Zone Potential
🟣 UNIUSDT.P: Long-Term Trade
🔵 XRPUSDT.P: Entry Zones
🔗 LINKUSDT.P: Follow The River
📈 BTCUSDT.P: Two Key Demand Zones
🟩 POLUSDT: Bullish Momentum
🌟 PENDLEUSDT.P: Where Opportunity Meets Precision
🔥 BTCUSDT.P: Liquidation of Highly Leveraged Longs
🌊 SOLUSDT.P: SOL's Dip - Your Opportunity
🐸 1000PEPEUSDT.P: Prime Bounce Zone Unlocked
🚀 ETHUSDT.P: Set to Explode - Don't Miss This Game Changer
🤖 IQUSDT: Smart Plan
⚡️ PONDUSDT: A Trade Not Taken Is Better Than a Losing One
💼 STMXUSDT: 2 Buying Areas
🐢 TURBOUSDT: Buy Zones and Buyer Presence
🌍 ICPUSDT.P: Massive Upside Potential | Check the Trade Update For Seeing Results
🟠 IDEXUSDT: Spot Buy Area | %26 Profit if You Trade with MSB
📌 USUALUSDT: Buyers Are Active + %70 Profit in Total
🌟 FORTHUSDT: Sniper Entry +%26 Reaction
🐳 QKCUSDT: Sniper Entry +%57 Reaction
📊 BTC.D: Retest of Key Area Highly Likely
📊 XNOUSDT %80 Reaction with a Simple Blue Box!
📊 BELUSDT Amazing %120 Reaction!
📊 Simple Red Box, Extraordinary Results
📊 TIAUSDT | Still No Buyers—Maintaining a Bearish Outlook
📊 OGNUSDT | One of Today’s Highest Volume Gainers – +32.44%
I stopped adding to the list because it's kinda tiring to add 5-10 charts in every move but you can check my profile and see that it goes on..
Bitcoin Overextended? Watch These Key Levels for the Next Move!BTC/USDT 1H – Retrace Before the Next Leg? 🚦
Bitcoin has shown impressive strength recently. On the 1-hour chart the current price action looks overextended 📈. After a strong impulsive move up, we’re seeing signs of exhaustion, with price stalling near the $111,800 region. Liquidity appears thin on the buy side, and there’s a cluster of potential sell stops resting below the current high in the form of sell stop.
I’m anticipating a retrace into the Fibonacci zone, with key levels at the 50% - 61.8% retracement. This area aligns with previous consolidation and could act as a magnet for price, especially as liquidity is swept from late long positions. If we see price rotate and break structure bullishly at my point of interest, I’ll be looking for a long entry opportunity. 🔄
Fundamentals & Macro Backdrop 🌍
On the fundamental side, Bitcoin remains sensitive to macroeconomic and geopolitical developments. Ongoing uncertainty in global politics and central bank policy continues to drive volatility across risk assets. Bitcoin’s correlation with tech stocks and the NASDAQ remains significant—recent data shows that when the NASDAQ pulls back, Bitcoin often follows suit. If we see a correction in tech stocks, be prepared for a retrace in BTC as well. 📉
Institutional interest is still strong, but short-term sentiment is cautious as traders await clarity on inflation, interest rates, and regulatory news. Keep an eye on U.S. economic data releases and any major headlines out of Washington or global hotspots, as these can quickly shift risk appetite.
Fundamentals and macro news remain key drivers—stay nimble!
Let’s see if BTC can reload for another leg up, or if broader market weakness drags it lower. Trade safe! 🚀

BITCOIN - Time to buy again!Bitcoin will reach $130k with a slight price correction.
previous analysis
Best regards CobraVanguard.💚

BTCUSDT | Chasing in Euphoria? Here’s the Smarter MoveI’ve watched BTC explode during rallies like this, and trust me, finding low-timeframe entries in euphoria is a trap for most. The move looks unstoppable… until it isn't.
Right now, I’m only considering a 1R risk from the green box support . No more. No less. The risk is calculated, not emotional.
If you’re thinking of jumping in recklessly, don’t.
I’ll be watching the 1-minute timeframe closely for a clean upward break before doing anything. No confirmation, no trade.
Reminder:
“I will not insist on my short idea. If the levels suddenly break upwards and do not give a downward break in the low time frame, I will not evaluate it. If they break upwards with volume and give a retest, I will look long.”
Most people don’t know how to think like this. That’s why they lose.
You’re here to win, and I’m here to guide you.
📌I keep my charts clean and simple because I believe clarity leads to better decisions.
📌My approach is built on years of experience and a solid track record. I don’t claim to know it all but I’m confident in my ability to spot high-probability setups.
📌If you would like to learn how to use the heatmap, cumulative volume delta and volume footprint techniques that I use below to determine very accurate demand regions, you can send me a private message. I help anyone who wants it completely free of charge.
🔑I have a long list of my proven technique below:
🎯 ZENUSDT.P: Patience & Profitability | %230 Reaction from the Sniper Entry
🐶 DOGEUSDT.P: Next Move
🎨 RENDERUSDT.P: Opportunity of the Month
💎 ETHUSDT.P: Where to Retrace
🟢 BNBUSDT.P: Potential Surge
📊 BTC Dominance: Reaction Zone
🌊 WAVESUSDT.P: Demand Zone Potential
🟣 UNIUSDT.P: Long-Term Trade
🔵 XRPUSDT.P: Entry Zones
🔗 LINKUSDT.P: Follow The River
📈 BTCUSDT.P: Two Key Demand Zones
🟩 POLUSDT: Bullish Momentum
🌟 PENDLEUSDT.P: Where Opportunity Meets Precision
🔥 BTCUSDT.P: Liquidation of Highly Leveraged Longs
🌊 SOLUSDT.P: SOL's Dip - Your Opportunity
🐸 1000PEPEUSDT.P: Prime Bounce Zone Unlocked
🚀 ETHUSDT.P: Set to Explode - Don't Miss This Game Changer
🤖 IQUSDT: Smart Plan
⚡️ PONDUSDT: A Trade Not Taken Is Better Than a Losing One
💼 STMXUSDT: 2 Buying Areas
🐢 TURBOUSDT: Buy Zones and Buyer Presence
🌍 ICPUSDT.P: Massive Upside Potential | Check the Trade Update For Seeing Results
🟠 IDEXUSDT: Spot Buy Area | %26 Profit if You Trade with MSB
📌 USUALUSDT: Buyers Are Active + %70 Profit in Total
🌟 FORTHUSDT: Sniper Entry +%26 Reaction
🐳 QKCUSDT: Sniper Entry +%57 Reaction
📊 BTC.D: Retest of Key Area Highly Likely
📊 XNOUSDT %80 Reaction with a Simple Blue Box!
📊 BELUSDT Amazing %120 Reaction!
📊 Simple Red Box, Extraordinary Results
I stopped adding to the list because it's kinda tiring to add 5-10 charts in every move but you can check my profile and see that it goes on..

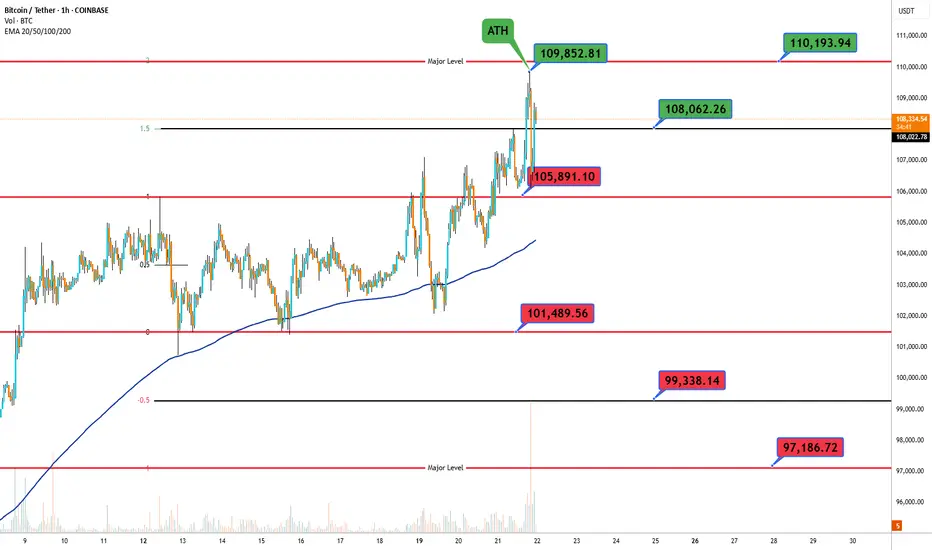
Bitcoin ATHBased on the chart for Bitcoin/Tether ( BINANCE:BTCUSDT ) on a 1-hour timeframe 📈, here are the complete support and resistance levels:
Support Levels: 🛡️
97,186.72
99,338.14
101,489.56
Resistance Levels: 🚧
108,062.26
109,852.81
110,193.94
Bitcoin BTC Bullish Setup: Here’s What I’m Watching Next!Bitcoin (BTC) is looking incredibly strong right now on the higher timeframes 🔥. We’re seeing a clear bullish trend with consistent higher highs and higher lows, which keeps my bias firmly to the upside 🚀...
In this video, I take you through my full multi-timeframe analysis, breaking down:
- The macro bullish structure unfolding on the daily chart 🗓️
- My key levels of interest for a potential pullback entry 🎯
- What I’m watching for on the 4H and 1H charts to confirm continuation setups ⏱️
- My target zones, including recent swing highs and areas of liquidity 📍
If Bitcoin gives us a healthy retrace, I’ll be watching closely for a bullish break of structure to confirm a high-probability buy opportunity 🟢.
⚠️ Reminder: This is not financial advice — always do your own research and manage your risk appropriately. 🛡️💼

#BTC/USDT#BTC
The price is moving within a descending channel on the 1-hour frame, adhering well to it, and is on its way to breaking it strongly upwards and retesting it.
We are seeing a rebound from the lower boundary of the descending channel, which is support at 104090.
We have a downtrend on the RSI indicator that is about to break and retest, supporting the upward trend.
We are looking for stability above the 100 moving average.
Entry price: 104619
First target: 105128
Second target: 106128
Third target: 107091
