Bitcoin (BTCUSD) – Bearish Trend ContinuesReferring to the previous analysis, BTCUSD remains in a dominant bearish trend, currently testing a critical support zone at the lower boundary of the double channel pattern.
If the $86K level holds as a support, a potential short-term bullish retracement towards the upper boundary of the double channel at $96.8K may occur. However, failure to sustain above $86K could trigger further downside pressure, with the next key support levels positioned at the Fibonacci retracement level of $74.6K.
In a worst-case scenario, a deeper breakdown could drive BTCUSD towards the major support at GETTEX:52K , a historically significant demand zone within the long-term market structure.
Traders and investors should closely monitor price action and volume dynamics around these critical levels to anticipate the next potential move.
Previous analysis
BTCUSDC

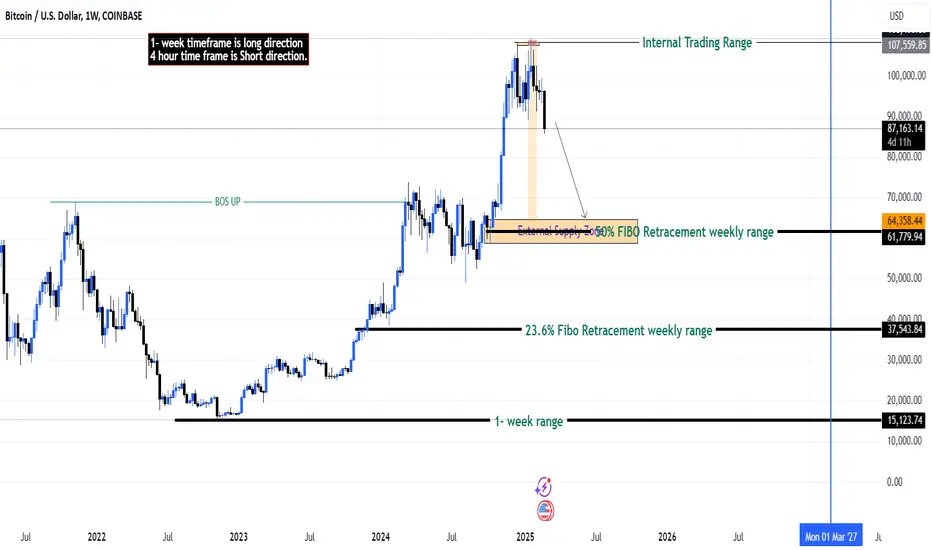
Broad View on Bitcoin - FxDollars - 26/02/2025Educational Analysis says BTCUSD may move DOWN from this range, according to my technical.
Broker - COINBASE
Because the BTCUSD pair showed some bullish weakness, it finally did liquidity, which was taken out on buy-side orders to show a sign of a downtrend, and I am looking to counter-trend this position.
Let's see what this pair brings to the table for us in the future.
Please check the comment section to see how this turned out.
DISCLAIMER:-
This is not an entry signal. THIS IS ONLY EDUCATIONAL PURPOSE ANALYSIS.
I have no concerns with your profit and loss from this analysis.
I HAVE NO CONCERNS WITH YOUR PROFIT OR LOSS,
Happy Trading, Fx Dollars.
Bitcoin Plummets: ETF Exodus, Liquidations, and Global Jitters
Bitcoin's recent plunge below the $90,000 threshold, a level unseen since November 2024, has sent ripples of concern through the cryptocurrency market. This sharp correction is attributed to a confluence of factors, including persistent ETF outflows, a surge in leveraged liquidations, and mounting geopolitical tensions, creating a volatile environment that has shaken investor confidence.
The most immediate catalyst for Bitcoin's decline has been the sustained outflows from US-listed Bitcoin ETFs. These exchange-traded funds, which had previously fueled Bitcoin's ascent by providing institutional investors with easy access to the cryptocurrency, have recently witnessed a reversal in sentiment. Investors, possibly reacting to broader market anxieties and profit-taking, have begun withdrawing funds, putting downward pressure on Bitcoin's price. This outflow signals a shift in institutional appetite, raising questions about the sustainability of the previous bullish momentum.
Adding fuel to the fire, the crypto market has experienced a significant wave of liquidations. Over $1.3 billion in leveraged positions were wiped out as Bitcoin's price plummeted. These liquidations, which occur when traders using borrowed funds are unable to meet margin requirements, exacerbate price volatility by triggering cascading sell orders. The sheer volume of liquidations underscores the high degree of leverage prevalent in the crypto market, highlighting the inherent risks associated with such trading strategies.
Furthermore, macroeconomic uncertainties are contributing to the risk-off sentiment permeating financial markets. The recent strengthening of the Japanese yen, often seen as a safe-haven asset, reflects investor concerns about global economic stability. Similarly, the dip in Nasdaq futures suggests a broader aversion to risk in traditional equity markets, which often spills over into the crypto space. The re-emergence of US-China trade tensions adds another layer of uncertainty, as any escalation could have far-reaching economic consequences, impacting investor sentiment and asset valuations.
The technical outlook for Bitcoin remains precarious. Analysts are closely monitoring the $85,000 support level, which, if breached, could trigger a further sell-off. The potential for over $1 billion in long liquidations below this level suggests that a significant drop is possible. Some analysts are even warning of a potential free fall to $81,000 if the $85,000 support fails to hold, indicating a severe test of market resilience.
Moreover, a more dire prediction posits that Bitcoin could potentially drop below $70,000, erasing gains made since the US election. This scenario, while alarming, highlights the vulnerability of Bitcoin to macroeconomic factors and investor sentiment. The prospect of a significant correction raises concerns about the stability of the crypto market and its ability to withstand external shocks.
The current market conditions serve as a stark reminder of the inherent volatility of cryptocurrencies. While Bitcoin has demonstrated remarkable resilience in the past, its price remains susceptible to a wide range of factors, including ETF flows, leveraged trading, and global economic conditions. Investors must remain vigilant and exercise caution in navigating this turbulent landscape.
The recent downturn underscores the importance of risk management in cryptocurrency trading. Leveraged positions, while offering the potential for amplified gains, also carry the risk of substantial losses. The high degree of leverage prevalent in the market can exacerbate price swings, leading to rapid liquidations and further downward pressure.
Furthermore, the growing correlation between traditional financial markets and the crypto space highlights the need for investors to consider broader macroeconomic factors. Changes in interest rates, inflation, and geopolitical tensions can all impact investor sentiment and asset valuations.
In conclusion, Bitcoin's recent tumble below $90,000 reflects a confluence of factors, including ETF outflows, leveraged liquidations, and global economic uncertainties. The market remains highly volatile, and further price swings are possible. Investors should exercise caution and prioritize risk management in navigating this challenging environment. The ability of Bitcoin to recover from this downturn will depend on a variety of factors, including the resumption of ETF inflows, a reduction in leveraged trading, and a stabilization of global economic conditions. The coming weeks will be critical in determining whether Bitcoin can regain its footing or succumb to further downward pressure.

Bitcoin is Bullish now & many Traders don't see it !!As you can see, in the previous Correction of Bitcoin, Bitcoin dropped by about $25,000 and then experienced a potential growth. Now, the price has fallen by about $25,000 from its all-time high (ATH) until now. If we consider the previous correction of Bitcoin, this could be a very strong signal for an increase in Bitcoin's price.
What do you think about it ?
_ _ _ _ _ _ _ _ _ _ _ _ _ _ _ _ _ _ _ _ _ _ _ _ _ _ _ _ _ _ _ _ _
Give me some energy !!
✅Thank you, and for more ideas, hit ❤️Like❤️ and 🌟Follow🌟!
❗Disclaimer
⚠️Things can change...
The markets are always changing and even with all these signals, the market changes tend to be strong and fast!!
Best regards CobraVanguard.💚

Bitcoin's Unbalanced move with the US electionsThe overall trend is still bullish, but the market needs to rebalance at $86,686 before it can push to new highs. Right now, the price action is not respecting bullish structure and is moving sideways in a consolidation phase.
The market does not move in a straight line. Every strong move needs to be balanced before continuing. The price left behind inefficiencies during the last expansion, and the market seeks to correct these before the next leg up. Liquidity is key. Right now, there is an imbalance that needs to be filled, and resting liquidity below must be taken before the market can resume its upward trend.
Smart money is not buying at current levels. They need better pricing and the market naturally moves to levels where institutional interest is highest. That level is around eighty-six thousand six hundred eighty-six, where a large amount of liquidity is positioned. The market is likely to dip into this level, take out weak-handed buyers, and trap sellers before pushing higher.
A ten percent drop from here would bring the price into that area, where real accumulation can take place. Until then, any short-term rallies are likely to be liquidity grabs rather than true continuation.
Please do not forget that this is a daily chart and we can see more liquidity grabs before reaching the target. This is an idea and nothing in the future is certain. With unexpected news we can see unexpected moves.
COINBASE:BTCUSD INDEX:BTCUSD BINANCE:BTCUSD KRAKEN:BTCUSD BINANCE:BTCUSDT BINANCE:BTCUSDT28H2025

Bitcoin Overextended? Key Levels & 15-Min Chart Setup Revealed!📈 Bitcoin seems overextended right now. 🔑 In my opinion, it's testing key support levels. I'm watching for a retrace into the midpoint of the previous price swing for a potential short opportunity. 🎥 In the video, I break down key insights on the trend, market structure, and price action, and show exactly what I'm looking for on the 15-minute chart for an entry. 🚨 Not financial advice! 📉

Bitcoin BTC Breaking Structure? Key Levels & Trade Setup!👀 👉 In this video, we analyze Bitcoin (BTC) and its recent price action. The four-hour chart shows a bearish break of structure, and my short-term bias remains bearish. I'm waiting for a short entry, aiming for previous lows highlighted in the video. This is not financial advice.

Watch closely Expect a movement at any time On the chart you can see the previous
movement how happened
All the points are shown on the chart
I expect a trend on matic that can lead us to see
1$ if we break the of 0.44$
Under 0.44$ the price will swing between 0.28$
to 0.43$ but if we break the resistant of 0.44$
and i do expect it, the target going to be 1$

$BTC: warning📉 CRYPTOCAP:BTC Chart Tells a Different Story Than Social Media
Bitcoin whales seem desperate to lure retail investors into CRYPTOCAP:BTC , but the charts paint a different picture—one that looks more like a warning signal than a buying opportunity.
🚨 Key Observations
🔴 Rejected at GETTEX:98K SIX times – The dream of a pump to $100K+ is fading fast.
🔴 Rejected twice at $97.2K – Further signs of weakness.
🔴 Failed support at $96.7K – Old supports are now turning into resistance.
📊 Technical Breakdown
✅ Daily Chart: Shows bullish momentum, but price action cancels it as sellers take profits.
❌ Weekly Chart: Bearish and confirmed—this trend is playing out now. (Check my weekly bearish trend warning here: 🔗 TradingView Link )
📉 Support Levels to Watch
🔻 $95.7K, $95K, $93.3K, and $92.4K
🔻 CRYPTOCAP:BTC should not drop below $91K without a strong bounce.
🕰️ A Look Back: I Warned About This
📌 December 17, 2024: I called the market top—it seemed crazy then, not so crazy now. 🔗 TradingView Link
📌 November 25, 2024: I warned about this bearish consolidation, and it’s playing out exactly as expected. 🔗 TradingView Link
🔮 Where is the Bottom?
📍 I still believe $85K is the likely bottom of this consolidation. Charts don’t lie—math always plays out in the long run. Of course everything can happen, I am talking about probabilities.
❓ Is This the End of the Bull Market?
🤔 No clear answer. However, ETFs have changed Bitcoin’s cycle. Instead of a classic bear market, I expect:
🔹 1-month pumps 🚀
🔹 Followed by 5-month consolidations 📉 (-30% corrections)
Conclusion: We are chopping sideways, much like we did from June to October 2024. The probability of seeing $85K is high. Be cautious and trade smart. 🧐📊
The bull market will resume around May 2025.

Bitcoin Trading Plan & Market Analysis🚀 In this breakdown, I outline my trading plan for Bitcoin (BTC), focusing on market structure, price action, and key liquidity dynamics.
🔍 Key Observations:
✅ Price Action & Liquidity Sweeps
* Bitcoin has been forming equal highs/lows, with dips below the lows targeting southside liquidity before rallying.
* On the 4-hour timeframe, this pattern has repeated multiple times—suggesting smart money accumulation at current levels.
✅ Confirmation Criteria
* My bullish thesis remains unconfirmed until we see:
* A decisive breakout of the current range.
* A successful retest and failure of that breakout level.
* If these conditions are met, I will be looking for buying opportunities.
✅ Final Confirmation
* A break of key resistance (highlighted in the video) is critical for confirming a trend reversal.
📺 Everything is explained in detail in the video—this is NOT financial advice!

Traders who followed my plan made a huge profit of 1500 pipsThis moment is exciting, happy, and incredible.
For traders who followed my plan and bought at 93500, the price of BTCUSD has reached 95500 at this moment, and the second target TP94800 I provided has been accurately reached. The traders who followed it have made a huge profit of 1500 points. This is a pleasing and incredible plan. I feel very happy and proud at this moment. This plan has helped me help more traders get huge profit returns. Great. Of course, I will continue to share my ideas and accurate trading plans here. Traders who think my plan is great, remember to stay tuned.
Mr. Baker
CRYPTO:BTCUSD INDEX:BTCUSD BINANCE:BTCUSDT.P BINANCE:BTCUSDT

Bitcoin is accelerating its decline, and a reversal opportunityComprehensive overall trend analysis shows that Bitcoin has experienced a single-day decline.
The opening of the US stock market in the evening accelerated the decline of Bitcoin
Currently, Bitcoin has fallen below the 95,000 mark. According to trend technical analysis,
Bitcoin has hit the short-term support level, and now we can plan to do long transactions
Bitcoin long plan:
Buy: 93,800-93,500
Closing: 94,500-94,800
Stop loss: 93,200
Mr. Baker
INDEX:BTCUSD CRYPTO:BTCUSD

Bitcoin Priced in Gold Macro Resistance Rejection CorrectionBTCGOLD monthly line chart, which uses monthly close data.
Obvious long term resistance line and clear major topping pattern on the most recent maximum showing connection with the last market cycle top (both of them.)
What does it mean? It means there's useful information in the BTCGOLD chart that isn't priced in. It also means the most recent correction is a rejection at major resistance, which could indicate further downside risk.

Can Bitcoin Survive the Inflation Storm?Bitcoin, the world's most prominent cryptocurrency, has experienced a turbulent period, recently dipping below the $95,000 mark.1 This price correction comes amidst growing concerns about rising inflation in the United States, as reflected in the latest Consumer Price Index (CPI) data. The CPI, a key indicator of inflation, surpassed market expectations, reigniting fears of persistent price pressures and their potential impact on risk assets like Bitcoin.2
Inflation's Shadow Over Bitcoin
The unexpectedly high CPI reading has sent ripples through financial markets, with investors becoming increasingly wary of the Federal Reserve's response to inflation. The Fed's primary tool for combating inflation is raising interest rates, a move that can make borrowing more expensive and potentially slow down economic growth. This prospect often leads investors to reduce their exposure to riskier assets, including cryptocurrencies like Bitcoin.
The connection between inflation and Bitcoin is complex. While some argue that Bitcoin can serve as a hedge against inflation due to its limited supply, others believe that it is still too volatile to be considered a safe haven asset. The recent price drop suggests that market sentiment is currently leaning towards the latter view, with investors reacting to the inflation news by selling off their Bitcoin holdings.
Market Dynamics and Technical Levels
Bitcoin's price movements are influenced by a multitude of factors, including macroeconomic trends, regulatory developments, and market sentiment. In addition to inflation concerns, the recent price drop could also be attributed to normal market corrections, profit-taking by traders, and technical factors.
Analyzing Bitcoin's price chart reveals key support and resistance levels that traders are closely monitoring. The $95,000 level appears to be a crucial support zone, and a sustained break below this level could lead to further price declines. On the upside, the $101,000 mark is a significant resistance level, and a decisive move above this level could signal a potential recovery for Bitcoin.
The Fed's Dilemma and Potential Scenarios
The latest CPI data presents a challenge for the Federal Reserve, which is tasked with balancing the goals of controlling inflation and maintaining economic growth. While the higher-than-expected inflation reading might suggest the need for more aggressive interest rate hikes, the Fed also needs to be mindful of the potential impact on economic activity.
Despite calls for lower interest rates, the Fed is widely expected to continue its path of gradual rate increases in the coming months. The central bank has repeatedly emphasized its commitment to bringing inflation under control, and a strong labor market provides further support for its policy stance.
Looking ahead, several scenarios could play out for Bitcoin. If inflation remains elevated, the Fed might need to take more aggressive action, potentially leading to further price declines for Bitcoin. On the other hand, if inflation starts to subside, the Fed could adopt a more dovish stance, which could provide some relief for Bitcoin and other risk assets.
Bitcoin's Long-Term Outlook
Despite the recent price volatility, the long-term outlook for Bitcoin remains positive for many market participants. The cryptocurrency's underlying technology, blockchain, continues to attract interest from various industries, and the adoption of Bitcoin by institutional investors is steadily increasing.3
Furthermore, some argue that Bitcoin's decentralized nature and limited supply make it an attractive alternative to traditional currencies, especially in times of economic uncertainty. While Bitcoin's price can be volatile in the short term, its long-term potential continues to draw investors seeking exposure to the digital asset space.
Navigating the Uncertainty
The current market environment is characterized by uncertainty, with inflation concerns and macroeconomic factors weighing on investor sentiment. Bitcoin, like other risk assets, is susceptible to these broader market trends. However, it is essential to remember that Bitcoin is a nascent asset class, and its price volatility is to be expected.
Investors considering Bitcoin should carefully assess their risk tolerance and conduct thorough research before making any investment decisions. While Bitcoin's long-term potential remains intriguing, it is crucial to be aware of the inherent risks associated with investing in cryptocurrencies.

Is BTC Gearing Up for a Bullish Reversal? Here’s My Game Plan!👀 👉 In this video, we analyze BTC, which is currently rangebound. On the 4-hour chart, I’m noticing equal lows followed by a liquidity sweep, then a higher low and a higher high. If Bitcoin breaks above the current range high, I’ll be looking to buy. However, if it trades lower, breaks the range low, and fails a retest, a short setup would be more suitable. We’ll cover trend analysis, price action, market structure, and both bullish and bearish scenarios. Not financial advice.

BTC's next market trendHello traders
The price is consolidating between 100096 and 96700, indicating a potential upward move toward 100096. If the price breaks above this level with strong momentum and volume, it is likely to continue rising toward 102360, where it may enter the bullish zone. Further bullish movement could push the price toward 106961, where it might face stronger resistance. The ascending trendline and recent bullish attempts suggest that buyers are trying to gain control, supporting the bullish outlook.
If the price fails to break 100096 and reverses, it may retest the lower support at 96700. A confirmed bearish trend will start if the price drops below 96700 and exits the ascending channel, leading to further downside movement. In that case, possible support levels to watch are 93723 and 91579, where buyers might attempt to regain control.
Traders, if you find this analysis helpful or have your own insights, drop a comment below! I’d love to hear your thoughts.

The latest momentum into the $120k areaBitcoin continues to move into the 120k area for further distribution. We are now on the cusp of a strong push! Buckle up! The altseason is also starting right now. The parabola for altcoins will begin after bitcoin passes 108k.

Bitcoin at a Crossroads: How to prepare for the Next Big Move👀 👉 Bitcoin (BTC) has been consolidating within a defined range over the past few days, exhibiting sideways price action. The key question now is: where does it go from here? In this video, I delve into critical elements of technical analysis, including market structure and price action, to outline potential scenarios. I’ll map out a strategic approach for both a breakout above the range high and a breakdown below the range low. Please note, this is not financial advice.

The Wait Is Almost Over – Alt Season Is Near
The moment we've all been waiting for is just around the corner. Now is the time to apply cycle indicators and accumulate high-potential coins.
I was much less active in January due to the 3-day cycle failures on most altcoins. The last 60-day cycle of the weekly trend didn’t offer great buying opportunities. But now, it's time to start aiming for those 100%-200% gains with relatively lower risk. (Premium members are already scouting top coins in our chat!)
🔸 Not Everything Is Straightforward Yet
Just because some alts have dipped **60-70%** over the last two months doesn’t mean they’ll immediately pump. You still need to **buy in the “green” zone** on cycle indicators—otherwise, you risk getting rekt.
🔹 Bitcoin Outlook
BTC is slowly approaching its **60-day cycle low** toward the end of the month. The **3-day cycle topped above 80**, increasing the chances of BTC heading toward the **90s area** before finding support.
😱 More blood on the charts?
Possibly. Right now, there are two types of traders:
1️⃣ Those who believe the top is in.
2️⃣ Those who think February will be extremely bullish.
I believe once both groups are confused, the upside will resume—likely in March, after the 3-day cycle resets and Bitcoin takes another leg down to shake out traders.
📉 Watching the 2-Week & 3-Day Cycles
When the 2-week cycle trends downward, we usually don’t perform well. Sure, we could reverse before the cycle fully resets, but ideally, we want the 3-day cycle to drop to around 20 before rebounding.
If the 3-day cycle continues to fall (which is likely unless we move up soon), February could see more bearish action before a stronger recovery.
Stay sharp & follow the cycles. 🚀

Bitcoin's Price Outlook: Support Levels, ETF Surge, and EmergingBitcoin's Price Outlook: Support Levels, ETF Surge, and Emerging Threats
Bitcoin, the world's leading cryptocurrency, finds itself at a critical juncture. While recent data reveals a surge in U.S. spot Bitcoin ETF inflows and identifies a key support level, looming challenges related to liquidity, government policy, and weakening momentum suggest a potential struggle in the near future. The next 30 days could prove to be a game-changer, determining whether Bitcoin can consolidate its gains or faces a significant downturn.
Key Support Level Identified
Technical analysis suggests a crucial support level for Bitcoin at $96,000. This figure coincides with the realized price for short-term Bitcoin holders, a metric that often acts as a reliable support or resistance level. Should Bitcoin fall below this threshold, it could trigger further sell-offs and potentially lead to a deeper correction. Conversely, if the price can hold above this level, it may signal renewed strength and pave the way for a potential rebound.
U.S. Spot Bitcoin ETF Inflows Surge
Despite the uncertainty surrounding Bitcoin's price action, U.S. spot Bitcoin ETFs have witnessed a remarkable surge in inflows. Year-over-year, these inflows have increased by a staggering 175%, with total net inflows exceeding $40.6 billion. This substantial investment from institutional and retail investors underscores the growing acceptance of Bitcoin as a legitimate asset class and suggests a strong underlying demand. The continued accumulation of Bitcoin by these investment vehicles could provide a buffer against potential price drops and contribute to long-term price appreciation.
The Next 30 Days: A Potential Turning Point
The next 30 days are crucial for Bitcoin. Several factors could influence its price trajectory, making this period a potential turning point for the market. These factors include:
• Liquidity Conditions: Bitcoin's price is heavily influenced by the availability of fiat currency. Concerns are rising as critical sources of fiat liquidity begin to tighten. This tightening could make it more difficult for investors to purchase Bitcoin, potentially putting downward pressure on the price.
• Government Policy: The U.S. presidential administration's approach to Bitcoin remains a significant factor. The slow progress in creating a strategic Bitcoin reserve raises questions about the government's long-term vision for the cryptocurrency. Clarity on regulatory frameworks and government adoption could significantly impact investor confidence and market sentiment.
• Technical Momentum: Bitcoin's upward momentum appears to be weakening. Technical charts suggest a potential loss of steam, with indicators pointing towards a possible correction. Traders will be closely monitoring these technical signals to gauge the direction of the market.
Risks to Watch Out For
Bitcoin faces several risks that could hinder its progress and potentially lead to a significant price correction. These include:
• Loss of the $96,000-$110,000 Range: Failure to hold above the $90,600 support level could lead to a retest of the broader $96,000-$110,000 range. A sustained break below this range could signal a more significant downturn.
• Tightening Liquidity: As mentioned earlier, the tightening of fiat liquidity poses a major threat to Bitcoin's price. Reduced access to fiat currency could limit buying power and lead to increased volatility.
• Uncertainty in Government Policy: The lack of clarity regarding government regulation and adoption of Bitcoin creates uncertainty in the market. Negative regulatory developments or a lack of clear guidance could dampen investor enthusiasm.
Balancing Act
Bitcoin's current situation is a delicate balancing act. While the surge in ETF inflows and the identification of a key support level offer some positive signs, the looming risks related to liquidity, government policy, and weakening momentum cannot be ignored. The next 30 days will be crucial in determining whether Bitcoin can navigate these challenges and continue its upward trajectory.
Conclusion
Bitcoin's price outlook remains uncertain. While the substantial inflows into U.S. spot Bitcoin ETFs and the presence of a key support level offer some encouragement, the cryptocurrency faces significant headwinds. Tightening liquidity, the slow progress in establishing a national Bitcoin reserve, and weakening technical momentum are all cause for concern. The next month will be critical in determining whether Bitcoin can maintain its footing or if it is poised for a correction. Investors should proceed cautiously, closely monitoring market developments and preparing for potential volatility. The long-term potential of Bitcoin remains a topic of much debate, but the short-term future hinges on how it navigates these immediate challenges.

BITCOIN - preparing for something great!on 12H chart btc showing a consolidation of bullish pennant pattern.. Breaking it will provide a massive push to break the larger megaphone pattern.
The chart also shows a hidden bullish divergence on the RSI indicator.
Bitcoin is now on its way to retest its previous high at $109K, and if it successfully breaks through, the price is expected to surpass $125K.
Best regards Ceciliones

BTC Swing ShortI have this in mind, so far 80% confidence in it (still waiting for one last confirmation for it to be 100%)
Will take this trade with strongly managed risk to reward. If flipped, will look for another short, personally I think top is near.

Bitcoin BTC price analysis + FED ratesHere is a CRYPTOCAP:BTC chart on which we have marked the days on which the Fed rates announced + #Trump inauguration as a bonus)
Everyone can compare for themselves how the market reacted to the US macroeconomic data.
❗️ Today at 19.00 UTC, another update of the Fed's rate - the forecast is that it will remain unchanged at 4.50%, and if so, this is a pretty good option against the backdrop of rising inflation.
🔴The worst-case scenario for the OKX:BTCUSDT price is a drop to the range of $92-94k (+ we keep in mind a possible squeeze to $ 88K, especially on futures, in order to “remove” all the longs' stops in consolidation over the past 3 months)
🟢 It will be great if BTC.D also falls with the fall of #Bitcoin (and it has room to fall) - this will allow altcoins, which are already at the bottom, not to spill too much.
The next announcement of the Fed's rate is on March 19, which means that a 1.5-month window will open, during which the market will have every chance to “come to life”
_____________________
Did you like our analysis? Leave a comment, like, and follow to get more
