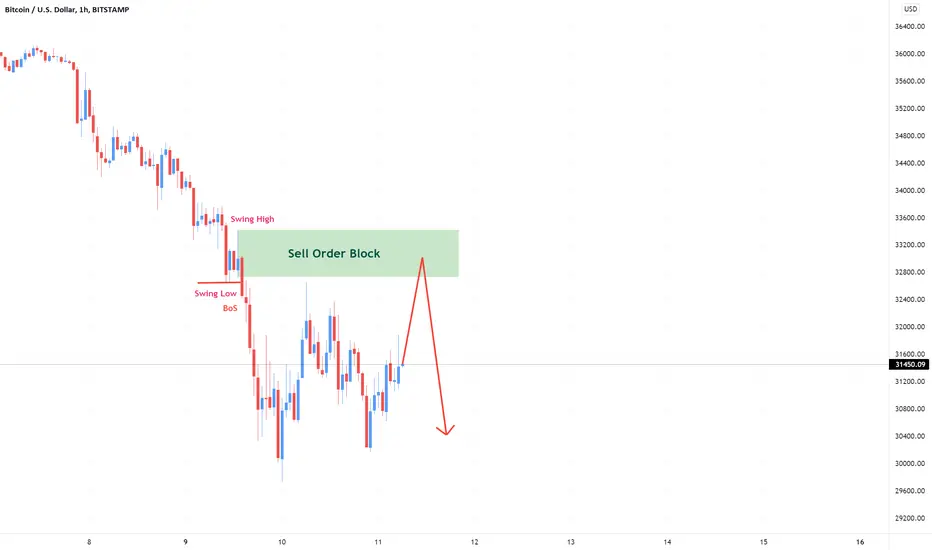
Bitcoin Prediction H1Here is my view for BTCUSD on H1. The price could go down, you can put a pending order on the Order block or find an entry on LTF within OB Zone. Trade Safe!
Btcusdforecast
btcusdt stuck in symmetrical triangleThis is not financial advice. This is for only my private trade plan. If you have follow at your own risk.

Bitcoin Technical Analysis to Determine Price next MoveApparently, #BTC is consolidating at a lower timeframe 1hr, once price breakout from this consolidation zone upward ⬆️ , a possible bullish move is comfirmed.
Alternatively if price breakout occurs Lower surely price continues to dip more.
Standby for price actions to confirm next price move..

BTCUSD - Parabolic CurveAn update on where price is for BTCUSD relative to the parabolic curve drawn against strong support points throughout BTC's history
25K (roughly) seems like max drawdown

Expect a bounce soon in BTC As I had showed my idea in my earlier publish, BTC DID FOLLOW EXACTLY THE SAME PATTERN but it was so quick and without a small relief bounce. So from here I expect BTC to do some consololidation n touch the support line a few times n then bounce for uptrend till the resistance area. Potentially braking above it after 2 3 test on the resistance. For me I think BTC could touch max 27k in a quick dip. Nothing below that. 27k-30k is a good buy zone for long term holders. Also the weekly ema as u can see, follows a nice pattern, support and resistance are accurate. I expect the resistance will b broken above in the next bull Run.

Bitcoin bears eyeing 20k!Looking at BTCUSD (Bitcoin), I think it is trying to fulfil it's double top formation. Bitcoin made a rejection from the 30k support level and rose up with at least 6% today. This might be due to profit taking. Looking at it, I predict it breaking it's 30k handle and falling to 20k level, to the 200 simple moving average.
Please support this idea with likes if you find it helpful.

Bitcoin- 30k target hit, what's next?Last week I said that Bitcoin could drop hard and reach 30k soon and yesterday the price reached this target.
The big question is now what?
Looking at the daily posted chart we can see that the trend is grossly bearish and Bitcoin could easily drop under 30k.
My idea remains unchanged, sell rallies and a expect BtcUsd to drop under 30k support
The next important support is around 20k and for a more optimistic view the price should pass above 37k

BTCUSDT 1D TFExpect a drop to the lower point of the channel to $29300 region then an upwards rally.
If this area doesn't hold I'm afraid we'll heading downwards hard.
I fully expect it to hold as it's an area of confluence of both the support reguon and descending channel

BITCOIN HIT $31,000 Who is following me on this journey, i believe everyone is busy bagging and we are all STUCKINPROFIT

BTC Important key levelsBTC / USD
I think BTC still following my idea that I published on 14th april
price finally hit 37k (second support line in my chart )
You can check my last idea here :
WHAT NEXT ?
From here I expect Bitcoin to test first support of channel which turned to resistance now (around 41k)
The price action there will determine the next move :
1–If price able to hold above 41k expect good bullish move toward the upper boundary of channel
2–If price see another rejection , this time i think channel will break to downside and my first target will be around 34k
Don’t forget to like and follow for more updates and analysis

Possible movement of bitcoin pirce per usdtIn a monthly basis, as shown in the chart, these are possible targets of daily trend.
But if it fails the monthly pivot (black box, lower bottom), the price may reach 16700 $.
But in the past, it is probable the price will return to the upper targets in daily trend, and the targets are also pictured.
The movement momentum can possibly come into action from the daily box (orange box), since it is the trigger price.
We'll wait to see what happens.

BTCUSD BEAR RALLY HIT $32,000Woke up to glory, woke up a winner, woke up to BTC locked in profit of over 5,000 pips for the week, An update was dropped before the dump, who else is STUCKINPROFIT..

$BTCUSDWhat is Bitcoin?
Bitcoin is a cryptocurrency. It is a decentralized digital currency that is based on cryptography. As such, it can operate without the need of a central authority like a central bank or a company. It is unlike government-issued or fiat currencies such as US Dollars or Euro in which they are controlled by the country’s central bank. The decentralized nature allows it to operate on a peer-to-peer network whereby users are able to send funds to each other without going through intermediaries.
Who created Bitcoin?
The creator is an unknown individual or group that goes by the name Satoshi Nakamoto with the idea of an electronic peer-to-peer cash system as it is written in a whitepaper. Until today, the true identity of Satoshi Nakamoto has not been verified though there has been speculation and rumor as to who Satoshi might be.

BTCUSD a falling knife and where it might reverseConsistent to my previous analysis, BTCUSD did get to the predicted level however price did not reverse. It seems now price is seeking lower level liquidity indicated on the chart. The likely reversal zones are also shown with the lower one being a more high-probability zone.
Never enter longs unless you see market structure reversal on lower timeframes (H1, H4). Good luck

BTCUSD 1W What's next: apocalypse or new growth wave?Next week in the cryptocurrency market promises to be very interesting and fateful
The price of BTCUSDT has approached the liquid price range of $31,000-34,000, which has been a strong support zone for buyers for more than 1.5 years.
What's next? :
1) Apocalypse in the cryptocurrency market - If sellers manage to sell and fix the price of BTC below this liquidity zone, the "Head and Shoulders" pattern is fully activated. Below $31k are a lot of levels where hidden stop orders of longs. If they break and the market will start falling mercilessly, something like March 2020 (if anyone remembers these painful feelings).
The first fall goal is to close GAP $23800-26500, which has not been filled since December 2020 (the market remembers everything ..). Even lower - this is $20-21 thousand - growth peaks in 2017.
2) A new wave of growth - In 12 hours, a new weekly candle will open. It is possible that with its opening, sellers will try to bring down the price of BTCUSD and break stops below $32,900, but buyers must act aggressively and redeem any attempts to fall.
If buyers show themselves with dignity, courage and aggression, like real warriors, then the opportunity for a new wave of growth will open up. This has already happened a few times in the history of BTCUSDT bidding.
On the graph, we have shown a possible growth projection for the next 7-8 weeks in the area of 53,000 for Bitcoin.
Which scenario is closer to your heart?, share your thoughts in the comments
_______________________________
Since 2016 , we have been analyzing and trading the cryptocurrency market.
We transform our knowledge, trading moods and experience into ideas. Each "like under the idea" boosts the level of our happiness by 0.05%. If we help you to be calmer and richer — help us to be happier :)

BITCOIN ON CORRECTION PHASE ! when the correction phase we saw in bitcoin in the past,we can clearly see that the bitcoin takes time to complete a correction wave , on that point I can say bitcoin will go below the 27000 price range then we can see a rally of an impulsive move
thank you!

BTC The Past Present and FutureIn my previous articles, I pointed out the current status of BTC. I expect an apology from those who insulted me for saying that BTC will fall in my previous analysis :)..
I think the current chart is trying to complete the head and shoulder pattern.
When we look at the past accumulation regions, we can see that the previous picture is similar to this one. According to this chart, it suggests that the price may decline to an average of 33K - 28K levels.
When we look at the weekly time frame, if the pattern we see is a harmonic pattern, we cannot expect the prices to rise before the fib of leg D falls to the 1.24 level. But I must say that I don't believe what I'm saying myself. So I don't think the price can go down to these levels.
But if the price hangs around here, we can summarize the support zones that may occur as follows;
When we projection with Schiff and Fan, we can say that the intersection of schiff and fann is a strong support. Especially the schiffin, which crosses the gann fan's 8/1 and 4/1 twice, may indicate that there may be strong support for the current price, although there is no accumulation in these regions. I marked these regions with red dots.
Based on all these assumptions, I expect the price to decline to the region indicated by the green box in the chart below. I don't believe it will go any lower. I also indicated the price resistances that may occur when there is an upward trend in the future with the Fibonacci channel. Of course, these are all assumptions and calculations based on the probability of repeating past data. However, I think that the price may definitely encounter a reaction at these levels in up or down movements.
When we look at BTC dominance, we can see that it is in the triangle range. In order for this triangle to be completed, I think the chart data should go down and regress to the 39 levels of dominance.
If we make a measurement with technical indicators, we can say that this level will go down even more. When we measure it with Fibonacci, we see that the earliest stop point is 36.
But the good news is that there is a bullish formation in graphic. When BTC completes the dominance pattern, a harmonic pattern in favor of the bull emerges. This will quickly increase the dominance to 55 .
When everything in the world and in nature comes to the highest or lowest level, it definitely turns upside down. That is, the highest one begins to descend, the lowest one begins to rise. It's like the law of physics. This never changes.. Nothing stays always down or always up. We can see this when we look at the BTC fear index.
If we talk about indicators; Considering that rsi graph data is a reflection frequency, we can use rsi not only with numerical measurements but also with graph measurements. I know it sounds silly, let's look at the graph.
I think there is a shark pattern on the rsi in the chart above. I know that graphic analysis will not be done on the indicators, but I would like to share it with you because it works for me most of the time. According to the theoretical knowledge, this harmonic pattern should reduce the data numerically. If this is a shark pattern as I thought, the rsi value should regress up to 10 . If we compare this with the real price chart, we can think that prices can decrease up to 30K levels on average.
We can see the power of the sellers on the aroon indicator in the daily time frame. We see that the trend in the adx indicator is strong and the levels of the adx should regress in order to start an upward movement again. but this way it can point to new trend. Cmf is my favorite indicator. It never surprises. It can even eliminate manipulated movements. It's like a graph filtering indicator for me. So I see that despite such a strong price drop, it still does not produce a strong signal.
In order to say that the prices will definitely go up, the cmf must go down to -20 and below. Currently at -5 levels. Momentum indicator shows -3100. This value definitely indicates an upward reversal. But according to an algorithm that I have formulated using the data of all of them together with other indicators, the value of momentum indicator for upturn does not reflect the truth yet. In the algorithm I formulated, the ratio of the momentum indicator to the other indicators has always changed direction. However, although the value of the momentum indicator is very high, its proportioning with other indicators does not give the return score. As a result of the prolonged decline of BTC, I think the data of this indicator is bottom. To summarize briefly; I expect the BTC price to be in the 24K to 30K range. After returning from these price levels, I think that a long-term rise is certain.
NOTE: This is not investment advice.

$27,000 PIPS ON BTCUSD BEAR RALLY Position trading on BTCUSD
price hit $36k, entry at $61k, over 27,000 pips bagged successfully..
STUCKINPROFIT.. the holding continues.

BTCUSD (Bitcoin) Bull and bear caseBTCUSD tumbled as decrease in demand for riskier assets.
Bear case-
Levels to watch- $34000.
Bull case-
Primary supply zone -$38000.

#BTCUSDT looks ready. Long Here...BTCUSDT 12 Hour Nice daily close above $39600.
Posted a long at $37700 and still holding.
PERFECTLY ON TRACK AS PER OUR PREVIOUS UPDATES.
BTC needs to take over the $40.8k- $42k level asap which will eventually trigger the rally.
So far looks like a breakout on this 12-hour chart.
A perfect retest and continuation is what I am looking at now.
Invalidation:- Close below the red trendline will invalidate the chart.
Do hit the like button if you find my charts helpful.
Let me know your thoughts/suggestions in the comment section.
Thank you
#PEACE

#BTC #bitcoin HTF analysis, BTC to 30K Inevitable?#BTC Struggling at the moment and just breakdown from the rising Parallel channel. we expect it to Retrace upwards to test the lower trendline of the rising Parallel channel, to keep it simple its Short the bounce market till BTC closes Daily above 42K, so plan ur trades accordingly.
BTC to 30K is inevitable

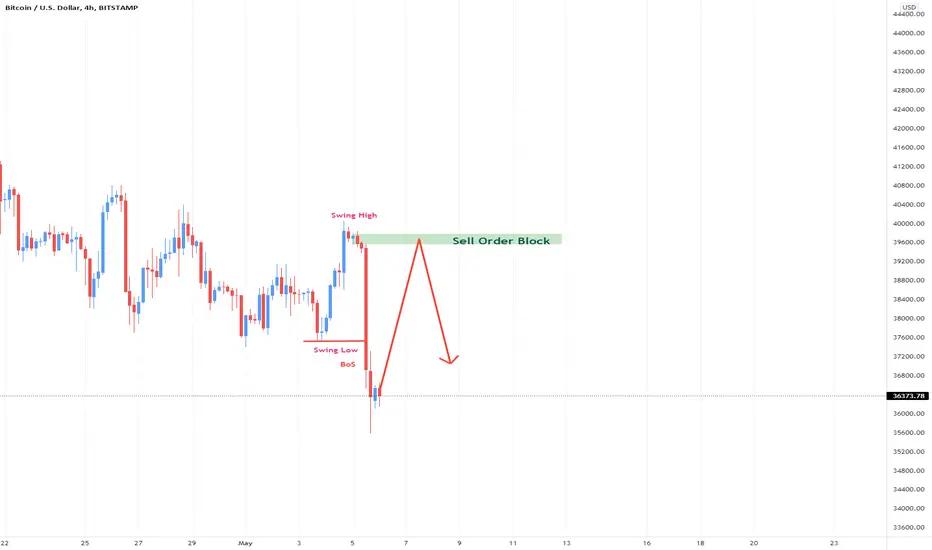
Bitcoin Chart H4Here is my view for BTCUSD on H4. The price could go down, you can put a pending order on the Order block or find an entry on LTF within OB Zone. Trade Safe!
BITCOIN SMASH $36,000 SUCCESSFULLYBitcoin Bear rally continues, moon buys can go to bed now, price is now trading in the zone. who is STUCKINPROFIT
