Bitcoin in Tactical Suspension - Beneath the Compression Veil.⊣
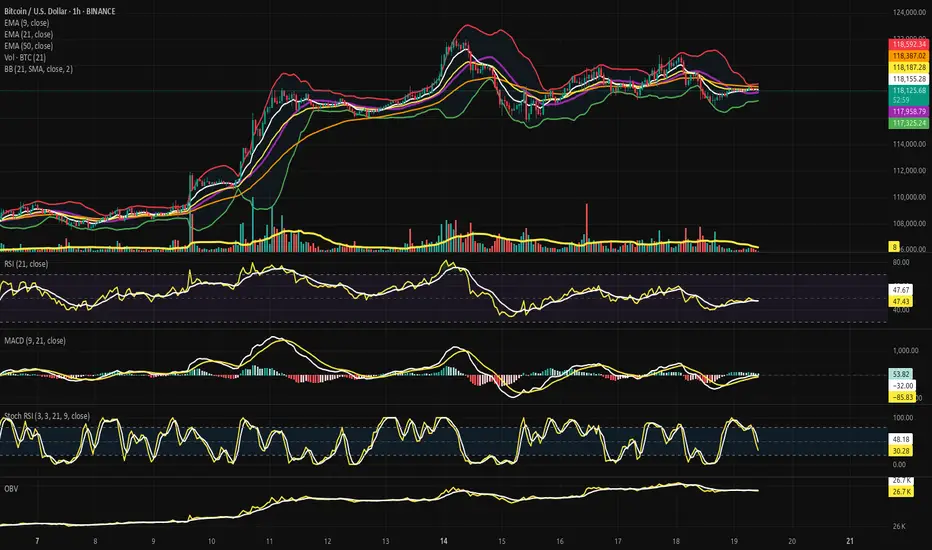
⨀ BTC/USD – BINANCE – (CHART: H1) – (July 19, 2025).
◇ Analysis Price: $118,192.34.
⊣
⨀ I. Temporal Axis - Strategic Interval - (H1):
▦ EMA9 - (Exponential Moving Average - 9 Close):
∴ Price: $118,192.34 | EMA9: $118,176.07;
∴ EMA9 is currently being pierced by price - neither clearly above nor decisively rejected;
∴ The EMA9 has flattened - signaling short-term equilibrium tension, not momentum dominance;
∴ Price candles are compressing into the EMA9 without thrust - indecision at the microstructure.
✴️ Conclusion: Logic sealed - EMA9 reflects tactical stalling; energy coiled at surface level.
⊢
▦ EMA21 - (Exponential Moving Average - 21 Close):
∴ EMA21: $118,199.53 - now above current price, acting as immediate tactical resistance;
∴ A minor bearish slope is forming in EMA21, reflecting recent downside pressure;
∴ Price failed to sustain any candle close above this level in the last 5 sessions - confirming resistance activation.
✴️ Conclusion: Logic sealed - EMA21 has turned from guide to barrier; tactical trend favors compression below.
⊢
▦ EMA50 - (Exponential Moving Average - 50 Close):
∴ EMA50 stands at $118,400.31, well above both price and the shorter EMA's - defining a ceiling of short-term exhaustion;
∴ Its curve is turning sideways, indicating that dominant upward momentum has faded;
∴ The last time price touched EMA50 was during the failed attempt to reclaim the upper Bollinger band - sign of rejection.
✴️ Conclusion: Logic sealed - EMA50 confirms the upper boundary of compression; the short-term trend remains capped.
⊢
▦ Bollinger Bands - (21 SMA, 2 Standard Deviations):
∴ Current BB range:
• Upper Band: $118,586.19;
• Lower Band: $117,291.33;
• Midline - (SMA21): $117,938.76;
∴ Price sits marginally above the midline, but beneath the upper band - indicating a neutral stance within the envelope;
∴ Bands are in a state of mild contraction, reflecting reduced volatility and lack of decisive breakout pressure;
∴ Price has failed to close above the upper band on multiple attempts, suggesting exhaustion without thrust;
✦ Tactical Signal:
• The flattened curvature of the bands and the centering of price near the midline indicates that the market is in compression;
• This condition favors mean-reversion trades or breakout anticipation setups, but lacks directional conviction;
• No squeeze pattern is imminent - but energy is coiling slowly.
✴️ Conclusion: Logic sealed - Bollinger structure is balanced, with compression overtaking directional thrust; breakout not yet awakened.
⊢
▦ Volume + EMA21 - (Tactical Volume Profile H1):
∴ The latest H1 volume candle registers 9 (unit scale), significantly below the average trend of the prior days;
∴ There has been a consistent decline in volume since the spike observed near the $120k rejection zone - participation is fading;
∴ Volume EMA21 is now visibly above most recent volume bars, signaling that market energy has dropped beneath its tactical baseline;
✦ Tactical Diagnosis:
• A market with low volume near compression zones often reflects lack of initiative, not calm;
• The absence of sellers is not strength - it is hesitation;
• The lack of follow-through volume confirms that current price action is drifting, not being driven.
∴ No volume-led breakout is forming - the structure is floating within silence.
✴️ Conclusion: Logic sealed - tactical volume profile confirms stasis; market awaits external spark to ignite movement.
⊢
▦ RSI (21) + EMA9 - (Relative Strength Index – H1):
∴ RSI value: 48.13, EMA9 of RSI: 47.86 - both seated precisely on the neutral axis (50), indicating momentum equilibrium;
∴ RSI has been flatlining between 45/50 for several hours, reflecting a lack of directional force from both bulls and bears;
∴ The minor bullish crossover of RSI over its EMA9 is present, but lacks slope, strength, or historical reliability in the current formation;
✦ Interpretation Layer:
• This is a classic pause zone - RSI not weak enough to signal reversal, not strong enough to suggest advance;
• The close proximity of RSI and its EMA9 suggests a market suspended in technical indecision;
• No bullish or bearish divergence is visible - just momentum silence.
∴ Tactical RSI echoes the broader reading: structure without drive, energy held in restraint.
✴️ Conclusion: Logic sealed - RSI reflects equilibrium; momentum direction is undefined and dormant.
⊢
▦ MACD (9,21) - (Tactical Momentum Engine - H1):
∴ Current MACD Line: (+165.21), Signal Line: (+188.36) - forming a bearish crossover, with the MACD line now trailing the signal line for multiple candles;
∴ The histogram is negative and expanding, confirming that bearish momentum is actively growing, not stalling;
∴ The slope of the MACD line has turned definitively downward, with no flattening in sight - this indicates a sustained momentum bleed;
✦ Tactical Interpretation:
• The momentum crest occurred near $119,700, and since then, MACD has been fading consistently;
• Price has failed to reclaim the MACD highs despite proximity, suggesting a divergence in effort vs. energy;
• This is not a false cross - but a validated tactical downturn with histogram acceleration.
∴ The engine beneath the structure is declining in output - the wheels turn, but they no longer drive.
✴️ Conclusion: Logic sealed - MACD confirms tactical momentum decay; the engine is reversing beneath the surface.
⊢
▦ Stochastic RSI (3,3,21,9) - (Short-Term Momentum Oscillator - H1):
∴ %K: 51.29, %D: 68.32 - a confirmed bearish crossover has occurred, with %K now beneath %D and both values descending;
∴ The oscillator has recently exited the overbought region (>80) and is now transitioning through the mid-zone, reflecting short-term loss of thrust;
∴ Price has failed to respond to prior overbought readings with continuation — indicating momentum dissipation without execution;
✦ Microstructure Insight:
• The current descending arc of %K + %D shows that micro-traders are unwinding positions;
• The zone between 50/70 is a tactical fading region, not a place of strength;
• Absence of a rebound in %K suggests that short-term buyers are standing down.
∴ This oscillator confirms that momentum is not only absent - it is actively declining at the tactical level.
✴️ Conclusion: Logic sealed - short-term momentum cycle is unwinding; compression reigns over velocity.
⊢
▦ OBV + EMA9 - (On-Balance Volume with Tactical Smoothing - H1):
∴ Current OBV: (–89.21K, EMA9 of OBV: –89.02K) - OBV remains slightly below its moving average, indicating a net negative flow of volume;
∴ While price has drifted sideways, OBV has continued to tilt downward, reflecting silent capital outflow beneath surface price stability;
∴ There is no upward curvature or crossover attempt - the OBV line remains submissive, signaling passivity or tactical retreat from market participants;
✦ Strategic Implication:
• The sustained divergence between OBV and price implies that larger hands are not accumulating - rather, they are disengaged;
• This condition often precedes fake breakouts or downward drifts, especially when unconfirmed by volume or RSI;
• The EMA9 serving as a lid rather than support confirms that internal flow is structurally bearish at the H1 frame.
∴ The tactical OBV structure reveals the undercurrent: orderless and hollow, despite price still holding ground.
✴️ Conclusion: Logic sealed - OBV confirms quiet withdrawal of pressure; tactical structure lacks foundational support.
⊢
🜎 Strategic Insight - Technical Oracle:
∴ The H1 tactical frame reveals a market in constrained inertia - price floats between short-term EMA's, yet every major momentum engine (MACD, Stochastic RSI, OBV) confirms internal recession;
∴ EMA's no longer guide - they constrain;
∴ Bollinger Bands contract - but hold no breakout;
∴ Volume is absent - and OBV confirms retreat;
∴ The chart is alive in form, yet dead in force;
∴ No element acts as initiator - only sustainers remain;
∴ The next tactical move must emerge externally, not organically.
✴️ Conclusion: The Tactical Oracle speaks - market energy is sealed beneath compression; movement is possible, but currently unprovoked.
⊢
▦ Structurally (H1):
✴️ Structurally: Neutral.
∴ Price floats near EMA9, below EMA21 and EMA50 - without rejection or breakthrough;
∴ No directional dominance has been established in the current cycle;
∴ Compression prevails over construction - this is not collapse, but pause.
✴️ Conclusion: Logic sealed - the structure is balanced but unsustained; no active trend is in command.
⊢
▦ Tactically: Suspended under Soft Compression:
∴ Momentum indicators (MACD, Stoch RSI, OBV) are all aligned in tactical decay - no upside thrust is evident;
∴ Volume remains below threshold and fails to accompany price fluctuations - a sign of apathy, not conflict;
∴ Price is trapped between EMA's and centered within Bollinger range - with no pressure buildup for breakout.
✴️ Conclusion: Logic sealed - the market is in tactical suspension, drifting within a soft compression chamber; movement requires external ignition.
⊢
⧉
· Cryptorvm Dominvs · MAGISTER ARCANVM · Vox Primordialis ·
⚜️ ⌬ - Wisdom begins in silence. Precision unfolds in strategy - ⌬ ⚜️
⧉
⊢