26,567 Target UpdatedBTC reached a new low on the 4 hour, and rejected the 30MA on 4 hour. I can now understand why this has happened and why this is temporarily bullish for Bitcoin .
I don't think we are dumping yet; here's why:
A perfect fakeout would be to close the Weekly candle ABOVE the 200MA Weekly. This would be a HUGE BUY SIGNAL for retail buyers and many traders who don't think about what this actually means. They would just assume the bull run is back on.
Literally everyone would be buying Bitcoin . Every Bear would switch Bull, and then, and ONLY THEN, does the dump begin. The liquidations would be HUGE.
We currently close the Weekly on Sunday 24th. On the 25th (just like on the 25th July, 4 years ago) we reach the top - which on Kucoin would be 26,567. (Please refer to my 2 "Link to Related Ideas" to see how I measured this target originally. I have redone the extension with the new numbers to show you the updated target.)
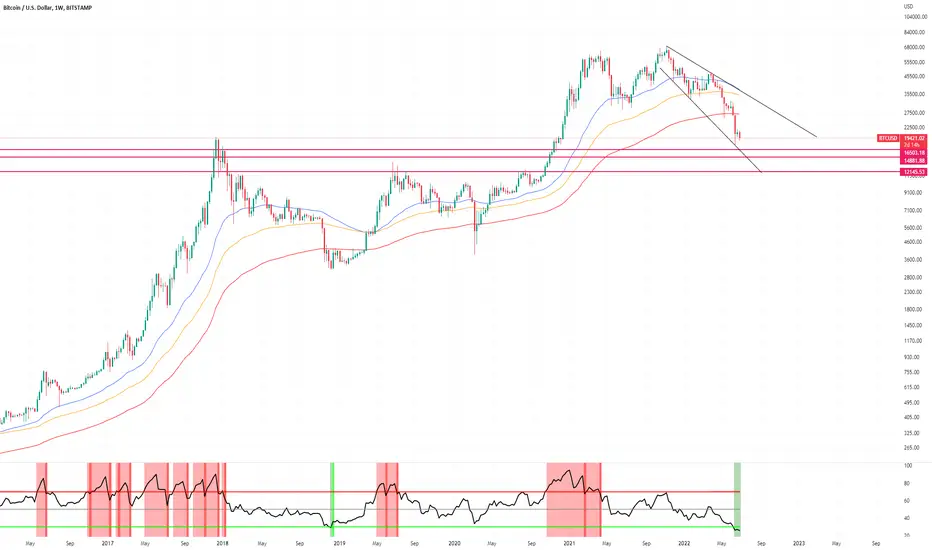
Funnily enough, if you look at my chart you can see that thick orange line above the 0.786 fib of 26,567. That thick orange line is the 200EMA Weekly. I expect this 200EMA Weekly to meet around this fib level by then, and THIS will be the REAL TOP.
So around this time, the 25th would be a Monday. Now we all know that on Monday's, there are generally fake moves. So it would probably reach the top on Monday, pretend dump and then back up halfway to liquidate some late bears.
Then it should start dumping around Wednesday 27th/Thursday 28th. The Monthly close would likely end up being a green Monthly candle with a wick. From then on, we descend towards 19k-18.5k before levelling out and going sideways in September.
Btcusdidea

BTCUSD intraday trading & flying to the moon🚀 22 JUL 2022Bitcoin intraday trading alert
3 steps must fulfill before entry
1. 1st breakout done
2. Retracement done
3. 2nd breakout and see you in the sky🚀
Hope you like my Trading Alerts~
Cheers~

BTCUSD Chart H1Here is my view for BTCUSD on H1. The price could go up, you can put a pending order on the Order block or find an entry on LTF within OB Zone. Trade Safe!

Bitcoin 2D Improving Strength SnapshotFollowers may request a strength snapshot of any cryptocurrency, so like and follow.
1) Strenght Profile: Finally the strength profile turned green since it turned red on April 3rd 2022, this is a bullish trend reversal.
2) Bull Bear Squeeze: Caution is needed though, as you can see, the bears are still in charge and they have not been entirely squeezed yet for the bulls to be back in charge.
3) Money Flow: The money flow is steadily increasing but is not positive yet.
For now, the Bitcoin 2D Strength Snapshot is finally improving: Strength Profile 🟢 Bears in Charge 🔴 Money Flow 🔴

Bitcoin 2D Stronger Strength SnapshotFollowers may request a strength snapshot of any cryptocurrency, so like and follow.
1) Strenght Profile: Green and getting stronger.
2) Bull Bear Squeeze: The bears are almost squeezed and then the bulls will be firmly in charge.
3) Money Flow: The money flow just turned green and positive.
We are in a very similar situtation as on July 24th 2021 when we started a nice leg up, see chart.
For now, the Bitcoin 2D Strength Snapshot is continuing to improve: Strength Profile 🟢 Bears in Charge 🔴 Money Flow 🟢

BTCUSD - OutlookHello there all,
Here's the BTCUSD analysis outlook potential direction.
Please do let me know if you are seeing what I'm seeing or have a different perspective on it, I would love to see your analysis.
Please do drop the chart link below on comment section.
This is not financial advice. 🙂
Thanks all.

BTCUSD Idea H1Here is my view for BTCUSD on H1. The price could go up, you can put a pending order on the Order block or find an entry on LTF within OB Zone. Trade Safe!

BTCUSD intraday trading & flying to the moon🚀 15 JUL 2022Bitcoin intraday trading alert
3 steps must fulfill before entry
1. 1st breakout done
2. Retracement done
3. 2nd breakout and see you in the sky🚀
Hope you like my Trading Alerts~
Cheers~

MACD golden cross of BTC 4H is 100% correct in the last 4 times
Strongly bullish on BTC
Reason 1: Since the US CPI data was announced at 9.1% on July 13, bitcoin first plummeted by nearly $1,000, then rebounded to erase the decline, and the market reversed, proving that even if the CPI data is very poor, it has a limited impact on the crypto market.
Reason 2: Bitcoin is still in a perfect ascending channel and the price is close to the support level , so it has a higher probability of continuing to rise.
Reason 3: The last 4 times the MACD indicator golden cross has shown a big increase, and the correct rate is 100%. Now the 4H golden cross has appeared again, and the market is expected to continue to rebound.
Conclusion: Bitcoin will continue to rise, focus on the support and resistance lines on the chart.
Ideas from traders with 10 years of trading experience

Nostradamus 101: BTC EUR 1 year aheadI made this observation for myself to see what a year in crypto really looks like, let's see how right or wrong one can be, tread carefully. Personally, see it going to 30k, but that is speculation. Safe trading.
#Theywillwanttoflushthemarketbeforerealadoption
#Nothingiseverwhatitseemswhenbigmoneyisinvolved
Divide it all.

BTCUSD Idea H1Here is my view for BTCUSD on H1. The price could go down, you can put a pending order on the Order block or find an entry on LTF within OB Zone. Trade Safe!

bitcoin analyzeyou have to be protect you money and use stop loss as you see in the chart btc can dump and go lower to other price like 14$ or 12$

Bitcoin 2D Still Weak Strength SnapshotFollowers may request a strength snapshot of any cryptocurrency, so like and follow.
1) Strenght Profile: BTC looked good on the daily for a few days (not anymore), so I'm still waiting for the 2D strength profile to turn green. That's what I'm waiting for since April 3rd. As you can see we are way oversold, yellow line was way below -1% already since May 5th and never above 0! When the strength profile turns green that would indicate an incredible buy for BTC, patience is key, in the meantime, follow me and I will update you when that happens.
2) Bull Bear Squeeze: Check the chart, you can see that the bears are still in charge and they have not been squeezed yet for the bulls to be back in charge.
3) Money Flow: The money inflow is slowly flattening out, loosing momentum, if it turns south (and potentially crossing the average) it won't be pretty.
For now, the Bitcoin 2D Strength Snapshot is still weak: Strength Profile 🔴 Bears in Charge 🔴 Money Flow 🔴

Bitcoin Support Levels And Where To EnterMarket situation is harsh right now but I don't expect a bounce at these levels : from 18.5k to 21.8k tonight was just a hunt to generate more liquidity for more shorting.
We have 50 Monthly EMA as support at 16.5k.
Weekly RSI at 26 and an expanding wedge same as on Nasdaq and SPX which I expect to make a move just a bit lower than previous lows and bounce hard Bogdanoff style.
In case it goes below this as a wick, might move to 15k and last support is 12.5k.
Plan : I start to buy btc and alts when bitocin touches 16.5k.
Thx, cheers )
BTCUSD Idea H1Here is my view for BTCUSD on H1. The price could go down, you can put a pending order on the Order block or find an entry on LTF within OB Zone. Trade Safe!

BTC/USDT
🟢 Bitcoin update.
Currently, the price of Bitcoin is 20,600, and it will rise to $24,000 to convince traders that the bottom has been achieved, and traders enter the market forcefully and are locked up, and the market falls strongly with big targets 14000
The bottom line is, run away from the market at a price of $23,500, whatever the temptations are.

Bitcoin 2D Weak Strength Snapshot1) I'm still waiting for the strength profile to turn green, it turned red on April 3rd 2022 and has not been bullish since (short since then).
2) You can also see that the bears are still in charge and they have not been squeezed yet for the bulls to be back in charge.
3) When you look at the money flow, there is money coming into BTC but for me to become bullish, the money flow needs to be above 0, or positive.
For now, the Bitcoin 2D Strength Snapshot is weak: Strength Profile 🔴 Bears in Charge 🔴 Money Flow 🔴
Followers may request a strengthsnapshot of any cryptocurrency , like and follow.

BTC retrace to 22.800BTC looks like there is a retrace that can reach the price of 22,800 if you look at the existing pattern.
On the D1 chart the candle forms a bullish momentum, but all the ichimoku parameters still indicate that the selling pressure is still strong. This retrace is not the start of a bullish trend in my opinion, this is only a retrace with a simple a-b-c pattern, most likely.
The kumo cloud still indicates selling pressure, with quite thick volume. Don't be fooled into making a purchase. Well you wait. I'm more focused on determining when it's time for me to enter to short

BTC, BTCUSD H4 Timeframe AnalysisHello Everyone.
This is BTCUSD H4 timeframe analysis. This is jut market ideas its not 100% sue. So please take entry on your own risk and proper money management. You know very well stock market is very risky so 1st you make your own analysis and 2nd take entry with stop loss. Thank You!!!
Yasir Abbasi

BTC/USDQuick idea
i expect a correction from this lvl to 17k ( re-test the dip again ) bounce to 28 k - 32 k


BTCUSD H1Here is my view for BTCUSD on H1. The price could go down, you can put a pending order on the Order block or find an entry on LTF within OB Zone. Trade Safe!

Ipdate #BTC nearly dropped to the support zone around $20,100#BTC nearly dropped to the support zone around $20,100. Now, it's a decision time, if price break this support then a dump will continue till $18,700 and below. Moreover, price will build-up a range which will continue moving between $20,100 - $21,400 levels.
