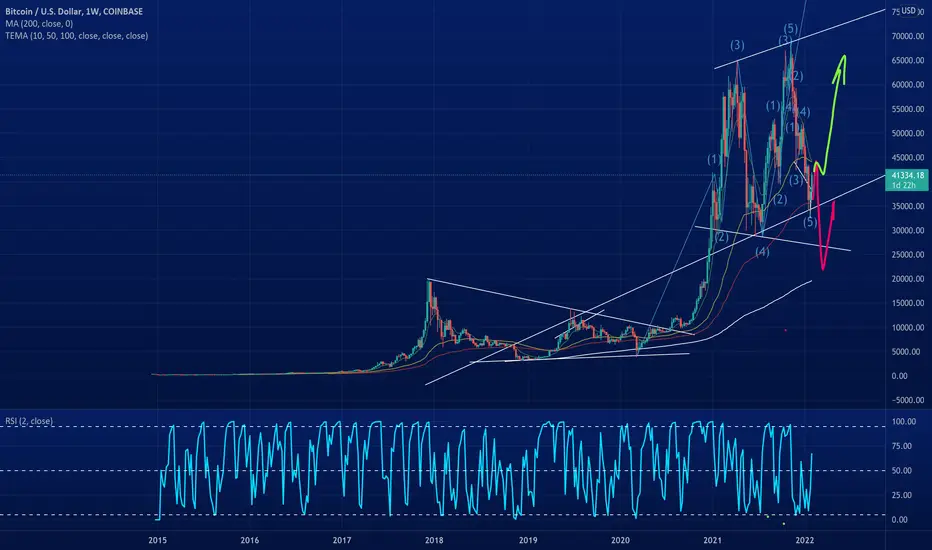
BTC ANALYSIS-TREND FOLLOWINGHi
Lines have an important place in our lives, especially in the stock market.
Where the candles spun, broke hard, etc. These are very important. Here I came up with a btc chart based on these.
Traces of the past determine the future. Graphs and lines are important to follow the trend.
Black lines can be followed like channels,
Yellow lines can be seen as shorter term resistance and support lines,
Purple lines should be followed carefully.
Have a nice day.
.
.
.
Investment information, comments and recommendations contained herein are not within the scope of investment consultancy. Investment consultancy service is offered individually, taking into account the risk and return preferences of individuals. The content, comments and recommendations contained herein are in no way guiding, but are of a general nature. These recommendations may not be suitable for your financial situation and risk and return preferences. Therefore, making an investment decision based solely on the information contained herein may not yield results that meet your expectations.
.
.
.
You can support by like it.
Btcusdidea

BTC SMALL BULLISH MOVE OR BEARISH?Hello, I am back with an idea on the BTCUSDT chart in the 4h time frame. What it's interesting about this pattern is that it has formed an ascending broadening pattern with a few impulsive waves. You can see clearly all the patterns formed in the chart and the way I have followed it with the small time frames and also 4h and daily.
The ascending broadening pattern is usually a bearish continuation pattern (only a few times indicates a consolidation move) and it is a small correction of the bearish movement. Looking at the weekly chart, I do not like how BTC looks like in that chart, and I think we are experiencing a bullish corrective movement probably topping around 48-50k before we see the bearish trend continuation or maybe a consolidation, dependable in the support and resistance areas. The 4th wave may be finished and we are about to experience the last wave as the 41.5 area was hit and it is forming a bullish flag. But in my opinion, this pattern looks as a bearish continuation and I expect to retest the 30s. However I would not remove the possibility of a corrective market at this moment and preparing for the next move, doing sideways movement for a while. Do not forget to manage every trade with a SL, but a small bullish trend is about to happen and in the mid term, I still see it bearish. We need more volume and also the news make it even more uncertain in which direction. But you can make profits trading in the areas mentioned.
If you have any comment, you are welcome. :)

Bitcoin Live Chart BTCUSD H1Here is my view for BTCUSD on H1. The price should go up, you can put a pending order on the Order block or find an entry on LTF within OB Zone. Trade Safe!

Comparing 2019 mid cycle correction with 2020-2021 on 3D chartStaring on the charts i noticed similar market structure on 2019-2020 and 2020-2021 mid cycle corrections.
After first market top (marked with number 1) there were strong correction until the moment when RSI formed double bottom on around 34-40 level.
After RSI formed a bottoming pattern there were secondary rally until 70 on RSI. Secondary rally marked with number 2.
I must say that back then in 2019 secondary rally was weaker than Bitcoin had in late 2021.
Secondary rally ended with massive price plunge "corona dump" which brought RSI down to 30 on 13th of march 2020. This time crypto market did not have any critical news that affected price this much BUT anyways for the last 3 month price declined pretty massively, slowly but steady.
Please notice that both times after secondary rally, RSI created lower low on level 30.
I marked with green lines places where i think Bitcoin price is (12.02.22 and 28.03.20)
P.S. Chart is on 3d time frame.
I see almost everyone has turned bearish right now, expecting price to go as low as 20k and 10k. Back then in march 2020 i saw the same thing happened in crypto community.
I believe that we witnessed huge buy opportunity for the next year.
Finger crossed :)

BTCUSD: Bull Trap Pending ⚠️This is my second sell option to join the market. Please look at my related idea below to see my original idea for sells.
If price holds and continues to reject this region, I will consider sells into 20k from here. IF price invalidates this sell idea with won't take a trade and we will simply wait for our first idea below to play out.
Traders, if you have your own opinion about this idea, write in the comments section, I always reply. 💬
🚨 RISK DISCLAIMER:
Trading Crypto, Futures, Forex, CFDs, and Stocks involves a risk of loss.
Please consider carefully if such trading is appropriate for you.
Past performance is not indicative of future results.
Always limit your leverage and use a tight stop loss.
--------------------------------------------------------------------------------------------------------
Please like, subscribe, and share this idea with others! ⬇️
--------------------------------------------------------------------------------------------------------

BTCUSD Analysis/Ideas Check this video about the recent breakout on BTCUSD from the channel and the expected retest to the support level .
For a very long time now, BTCUSD has being in a bearish form, precisely in a channel. But from what we are seeing now, the market has broken through the channel and got cleanly rejected at 61.8 fib level. Now, this rejection shows that there will be a retest will likely be on the next support level at 40167.87 which the same level with 200 SMA and 32.8 fib level. This level holds as the major strong support and reversal level.
Follow us to get exclusive/ simplified tutorials, ideas and signals

BTCUSD Analysis/Ideas LongCheck this video about the recent breakout on BTCUSD from the channel and the expected retest to the support level.
For a very long time now, BTCUSD has being in a bearish form, precisely in a channel. But from what we are seeing now, the market has broken through the channel and got cleanly rejected at 61.8 fib level. Now, this rejection shows that there will be a retest will likely be on the next support level at 40167.87 which the same level with 200 SMA and 32.8 fib level. This level holds as the major strong support and reversal level.
Follow us to get exclusive/ simplified tutorials, ideas and signals

Bitcoin through my eyesBitcoin is in a bear market whether you like it or not.
I think it should be decided by May.
Quite possibly the market is just giving us a chance to get out at better prices.
Situation when Whale adresses numbers are declining and retail is buying is not a good sign.
Do what smart money do, not retail.

Bitcoin Live Chart BTCUSD H1Here is my view for BTCUSD on H1. The price should go up, you can put a pending order on the Order block or find an entry on LTF within OB Zone. Trade Safe!

Bitcoin- 44-45k zone in focusAs I said yesterday, Bitcoin is very probable that has put a higher low on our chart. This is confirmed now, with a higher high and a break above both horizontal and descending trend line resistance.
There is a high probability of continuation to the upside now and bulls can target the 44-45k zone, but Btc can even extend gains to the 50k zone.
Dips towards 40k should be bought.

BTCUSD LONG Ready Though Over All Trend in 1D BTCUSD is Bearish but the last BIG BULL candle is Changing the scenario. Now i m not Bearish on BTCUSD anymore after the News we received recently though i See a Correction Down side for BIG BULLISH Move !

Btc going up to 46000As my idea and based on fibonatchi and macd BTC going up to 38.2 fibonatchi . It''s 46.300
But need pulback. Wait and get profit.
Good luck.


BTC short?- stochastic RSI shows that there is space for the RSI to move up before a drop, with that move up BTC could tap our POI
- lots of areas of liquidity which needs to be grabbed below the current price
- all TPs are reasonable in my opinion, although with a drop i believe we can go a lot lower than the last TP

BTC will be back 📈BINANCE:BTCUSD confirmed ascending triangle meas he is trying to go back long, and also we can expect the other cryptos can go long too

Is this BTC rally for real? I don't think the macro environment is crystal clear for the markets. While jobs reports turned out well, noone knows what the rate hikes will do the macros. If the fed screws it up and have to reverse their policies, expect a selloff to 20K, they turn on the printing press and we go to 200K. Otherwise, we can expect a slow grind to 100K from here.
BTCUSD Bitcoin long / MOONSo the chart is telling everything and as we have all expected, it is going in the trend lines and going to break to top soon enough

BTCUSD: Feb 3 update & Feb 4th + 5th ProjectionI am an amateur technical analyst. This is not financial advice. You should always do your own research. Consider this post as entertainment. I'm simply sharing what I see in the charts and always welcome collaboration and feedback.
Updating my previous post of Feb 3rd. BTCUSD stayed within the fractal and yesterday went the full depth of the fractal bar. So far, the fractal remains intact as the market continues to work within the pattern of the May '21 fractal.
Based on the fractal pattern, today and tomorrow should be up days. There's a possibility that we reach as high as 41,250, which is the upper trend line above the pattern, and would be slightly above tomorrow's daily bar. After tomorrow, the pattern indicates a gradual decline until Feb 21st. Feb 21st then offers the opportunity for a reversal and potentially the launch pad for ALT season.

Time to short bitcoin before a massive dump- Weakness so clear to break 40k.
- Will visit 33k first or below before any upside move.
- Not able to break EMA 100 after testing on 4hr time frame.
- Downtrend still valid since 69k peak.
- lower highs & higher lows ( 4hr - 1D timeframes)
- Stock market is not good and crypto will follow.
- Fear & greed index went slightly higher since last massive dump to go down again.
- Therefore, ready for a big short.
short:✅ 38.5k - 37.7k ✅
🎯TARGETS:
1- 36,700
2- 35,800
3- 33,000
💵 Leverage: 3x - 5x
🚫Invalidation(SL): 39,480

BTC May '21 Fractal Tracks to Current BTC Price Action (updated First, know that I am an amateur technical analyst.
This is not financial advice. You should always do your own research. Consider this post as entertainment. I'm simply sharing what I see in the charts and always welcome collaboration and feedback.
Updating my previous post of Feb 2 to add anticipated target zone for the current retracement

BTC TO CHOOSE A DIRECTION!As I said previously on my idea, btc dropped correctly at the 35-36k level and kept it to bounce back to new highs, However we are still looking at a rising wedge pattern in the 4h chart and coordinated with a strong resistance which indicates reversal point on the daily chart that needs to be broken but it has not been broken in a while.
I remain kind of neutral in the market but I expect 2 scenarios playing out.
First Scenario- As seen in the chart, I expect Head and shoulders pattern forming, indicating that BTC will probably fall out of the wedge and bounce at 37.1k support up to 38k before falling again to the 35k, which may be a strong area to bounce back and trap the bears not going down. Personally I think this will happen and then we need to watch out the 35k level because if it does not hold, 30k is the target.
Second Scenario- Be careful with the breakout! If it breaks the level of 40k, it may be a trap for the bulls as it has happened before and this pattern looks perfect to do that, especially on the daily. Volume is declining and an upward movement could be the perfect trap for the bulls and also shaken the shorts.
Trade with SL, trade smart and don't FOMO. If you can not choose a side, better watch firstly.

Bitcoin- will it finally break up?As I said yesterday, a sell at 40k is too obvious and as I don't believe in "buy here, is the bottom", some I don't believe in "sell here, is the top".
Technically, from the 33k recent low, BtcUsd is trading upwards and is drawing an ascending triangle on our chart and we can clearly see that the dips are bought.
A break above 39k should accelerate gaines and the target for the pattern is 44k.
To buy on a break can be a good strategy for short term traders

Bitcoin Holding UP!!Quick $BTC TA. | Weekly Chart
See short analysis on chart. Let's have your opinions and thoughts.
@CryptonKidd
